. 2016 Jan 8;12(1):e1005380.
doi: 10.1371/journal.ppat.1005380. eCollection 2016 Jan.

A Higher Activation Threshold of Memory CD8+ T Cells Has a Fitness Cost That Is Modified by TCR Affinity during Tuberculosis

Affiliations

A Higher Activation Threshold of Memory CD8+ T Cells Has a Fitness Cost That Is Modified by TCR Affinity during Tuberculosis

Stephen M Carpenter et al. PLoS Pathog. .

Abstract

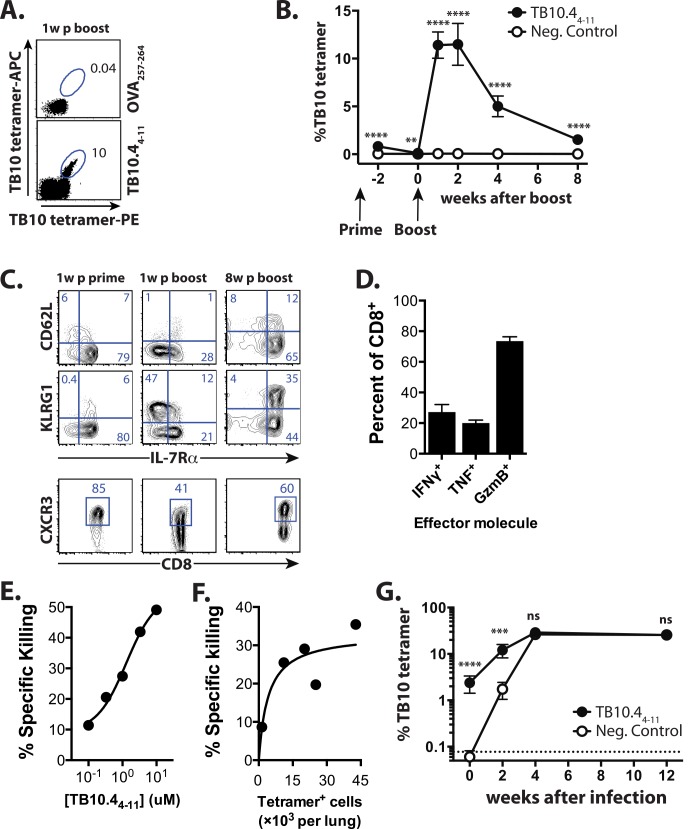
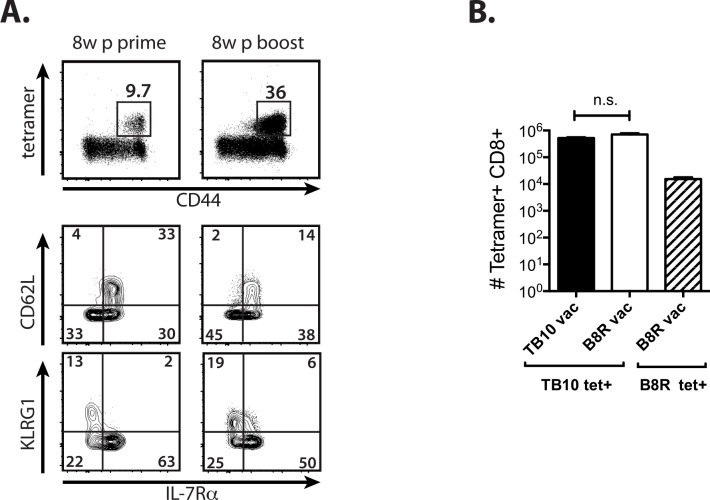
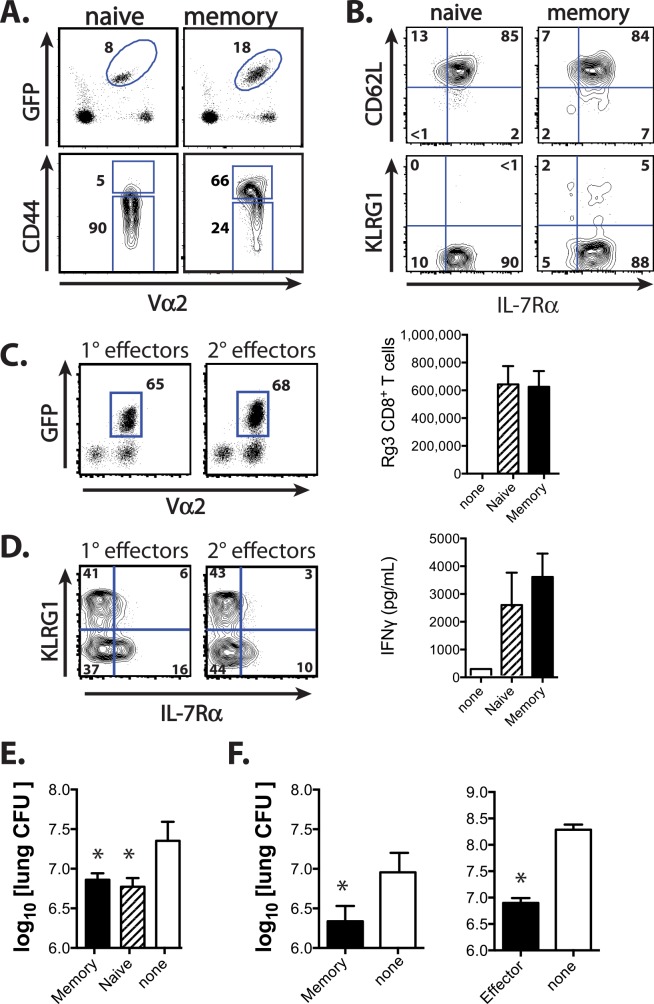
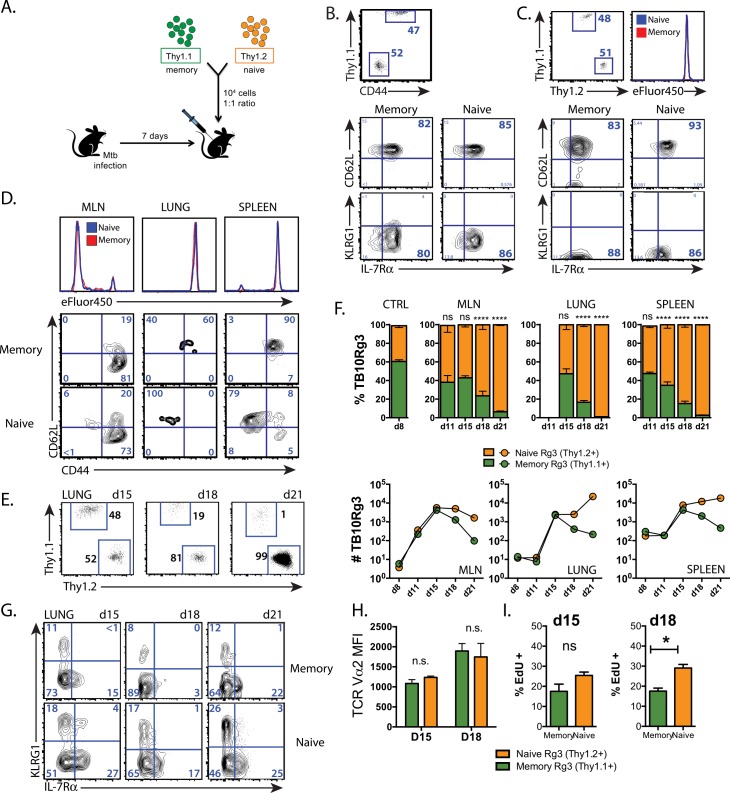
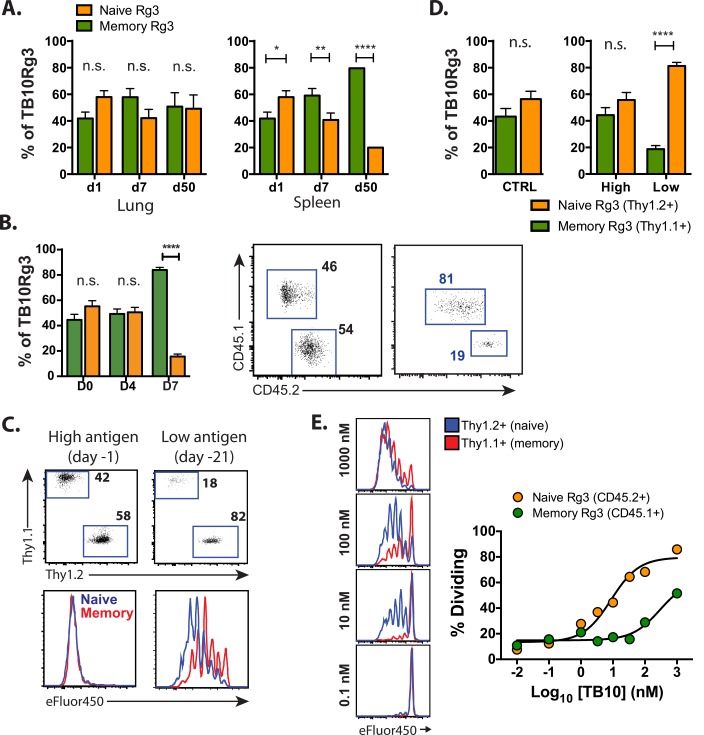
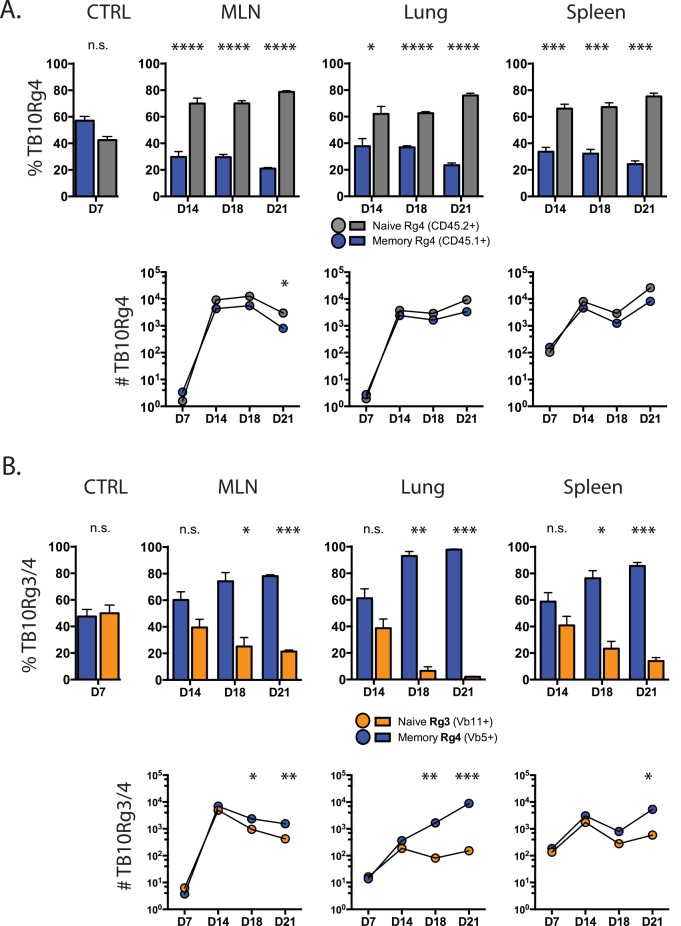
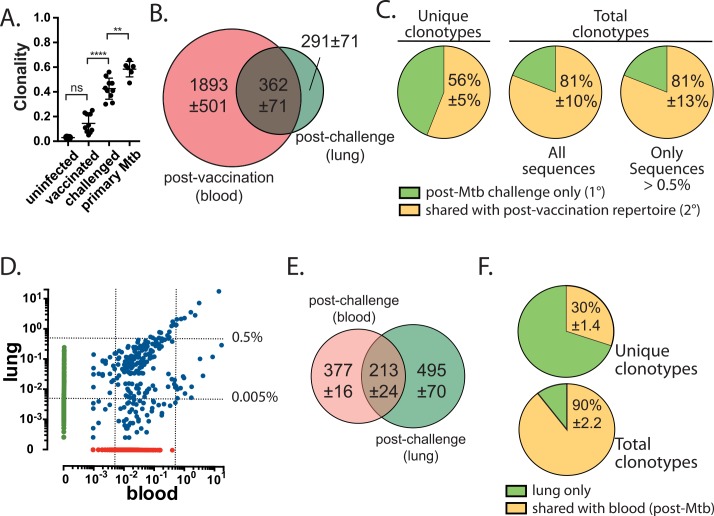
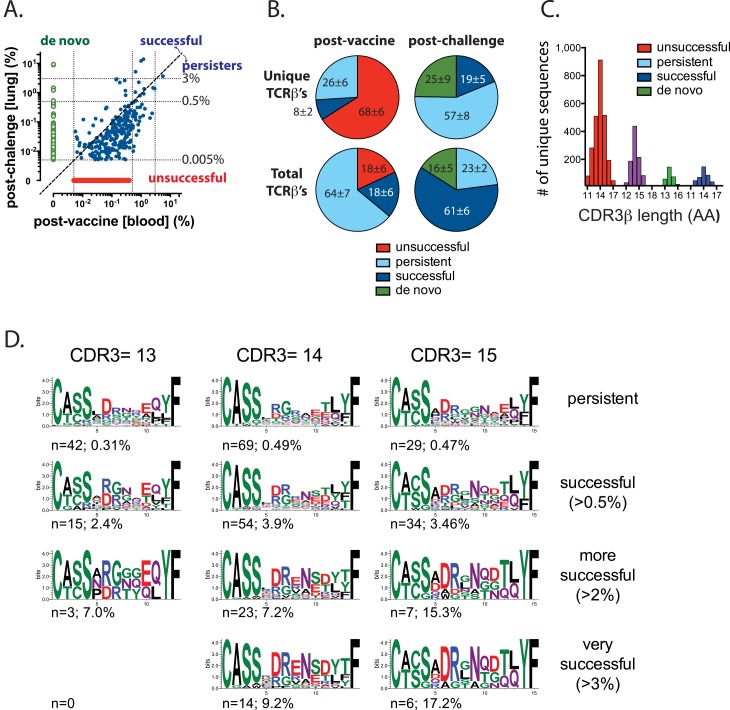
T cell vaccines against Mycobacterium tuberculosis (Mtb) and other pathogens are based on the principle that memory T cells rapidly generate effector responses upon challenge, leading to pathogen clearance. Despite eliciting a robust memory CD8+ T cell response to the immunodominant Mtb antigen TB10.4 (EsxH), we find the increased frequency of TB10.4-specific CD8+ T cells conferred by vaccination to be short-lived after Mtb challenge. To compare memory and naïve CD8+ T cell function during their response to Mtb, we track their expansions using TB10.4-specific retrogenic CD8+ T cells. We find that the primary (naïve) response outnumbers the secondary (memory) response during Mtb challenge, an effect moderated by increased TCR affinity. To determine whether the expansion of polyclonal memory T cells is restrained following Mtb challenge, we used TCRβ deep sequencing to track TB10.4-specific CD8+ T cells after vaccination and subsequent challenge in intact mice. Successful memory T cells, defined by their clonal expansion after Mtb challenge, express similar CDR3β sequences suggesting TCR selection by antigen. Thus, both TCR-dependent and -independent factors affect the fitness of memory CD8+ responses. The impaired expansion of the majority of memory T cell clonotypes may explain why some TB vaccines have not provided better protection.


Conflict of interest statement

The authors have declared that no competing interests exist.

Figures

Fig 1
Fig 1. TB10 vaccination elicits memory CD8+ T cells that generate 2° effectors during Mtb infection.
(a) The TB10 tetramer+ response enumerated by duel-tetramer staining in blood 1 week post-boost with TB104-11 or Ova257-264 (control) vaccination. Numbers indicate the % of CD8+ T cells. (b) TB10 tetramer+ responses from blood after TB104-11 or control (B8R20-27 or Ova257-264) vaccination at time points post-boost. (c) Representative plots showing CD62L, KLRG1, IL-7R, and CXCR3 expression by TB10 tetramer+ CD8+ T cells from blood 1w after prime, and 1w or 8w after boost. (d) Ex vivo TB104-11-stimulated production of IFNγ, TNF, or granzyme B from CD8+ T cells isolated from combined lungs, spleens, or LNs of TB10-vaccinated mice. (e) In vivo specific killing of targets coated with TB104-11 peptide. (f) In vivo specific killing of 1μM TB104-11-coated targets vs. TB10-specific response. (g) TB10 tetramer responses of mice vaccinated with TB104-11 or the control peptide B8R20-27 immediately prior, or 2w, 4w, or 12w after Mtb infection. **** p < 0.0001, *** p < 0.001, by two-way ANOVA with Sidak’s post test. Data are representative of 3–6 independent experiments, each with 4–6 mice per group.
Fig 2
Fig 2. Vaccination with an amphiphilic TB10 peptide increases the precursor frequency but does not improve the kinetics the recall response.
(a) Peripheral blood TB10 tetramer+ responses 8w post-prime or 8w post-boost with amphi-TB10 vaccination. CD62L, KLRG1, and IL-7R expression by tetramer+ CD8+ T cells is shown for each time point. (b) Lung tetramer+ responses from amphi-TB10 prime/boost-vaccinated (3 weeks apart), negative control-vaccinated (B8R), or unvaccinated mice 28d after Mtb infection. **** p < 0.0001, *** p < 0.001, n.s. not significant by one-way or two-way ANOVA with Sidak’s post test. Data are representative of 2–3 independent experiments, each with 4–6 mice per group.
Fig 3
Fig 3. TCR retrogenic TB10-specific CD8+ T cells allow direct comparison of the 1° and 2° responses during infection.
(a) The proportion of TB10Rg3 cells (%GFP+Vα2+) among CD8+ T cells and their CD44 expression, 8w after vaccination of TCR Rg mice (memory) or age-matched unvaccinated TCR Rg mice (naïve). (b) CD62L, KLRG1, and IL-7R expression of naïve TB10Rg3 cells, and 8w after a single immunization with TB104-11. (c) Proportion (left) and absolute numbers (right) of TB10Rg3 cells in the lungs of TCRα-/- mice 28d after adoptive transfer of 105 naïve or memory TB10Rg3 CD8+ T cells and Mtb infection. (d) Ex vivo KLRG1 and IL-7R expression by TB10Rg3 cells (left) and IFNγ production after ex vivo stimulation of lung cells [from (c)] with TB104-11 peptide (right). (e) Lung CFU of TCRα-/- mice 28d after transfer of naïve or memory TB10Rg3 CD8+ T cells and Mtb infection. (f) Lung CFU of sub-lethally irradiated C57BL/6 mice 21d after Mtb infection and transfer of memory TB10Rg3 (8w post-vaccination; left) or effector TB10Rg3 (1w post-vaccination; right). Numbers in quadrants or gated regions represent percent events. CFU were log10-transformed before a student’s t-test or one-way ANOVA with a Bonferroni post-test. Data are representative of 2–4 independent experiments, each with 5 mice per group. * p < 0.05. n.s., not significant.
Fig 4
Fig 4. The primary response dominates the memory-derived secondary response during Mtb infection.
(a) Experimental strategy for adoptive co-transfer experiments. Relative proportion of naïve and memory TB10Rg3 CD8+ T cells and their expression of CD62L, KLRG1, and IL-7R before transfer (b) and in the spleen 1d after transfer into uninfected mice (c). Baseline labeling with the eFluor450 proliferation dye is shown. (d) Concatenated histograms of eFluor450 staining of naïve and memory-derived TB10Rg3 cells in the MLN, lung, and spleen (top) and their CD62L and CD44 expression (bottom) from a representative experiment on d11 post-infection. (e) Proportion of adoptively-transferred memory (Thy1.1+) and naïve (Thy1.2+)-derived TB10Rg3 CD8+ T cells in the lung 15, 18, or 21d after Mtb infection. (f) The relative proportion of memory (Thy1.1) and naïve (Thy1.2)-derived TB10Rg3 CD8+ T cells in the MLN, lung, and spleen after infection, compared to spleens from uninfected mice 1 day after transfer (CTRL) (top). Cell numbers of memory (Thy1.1+) and naïve (Thy1.2+)-derived TB10Rg3 CD8+ T cells from the same mice (bottom). (g) KLRG1 and IL-7R expression by memory and naïve-derived TB10Rg3 cells recovered from lung at each time point. (h) TCR Vα2 median fluorescence intensity (MFI) (median ± SEM) in memory and naïve-derived TB10Rg3 CD8+ T cells from the same mice at d15 and d18 post-infection. (i) EdU uptake (mean ± SEM) by memory and naïve-derived TB10Rg3 cells recovered from lung. EdU uptake was compared with a student’s t-test. * p < 0.05, ** p < 0.01, *** p < 0.001, **** p < 0.0001 n.s. not significant, n.d. < 10 cells detected. Data are representative of 2–10 independent experiments, each with 3–4 mice per group.
Fig 5
Fig 5. Memory CD8+ T cells proliferate but have a higher activation threshold than naïve CD8+ T cells.
(a) The proportions of naïve and memory-derived TB10Rg3 cells in the lung (left) or spleen (right) 1, 7, or 50 d after adoptive co-transfer into mice administered amphi-TB10/poly(I:C)/CD40 1d prior to transfer. (b) Bar graphs (left) and representative flow plots (right) of the proportion of splenic TB10Rg3 CD8+ T cells (mean ± SEM) derived from memory (CD45.1+) or naïve (CD45.2+) TB10Rg3 0, 4, or 7 days after i.v. LmΔActA-TB10 challenge of Thy1.1+ hosts, in which 104 memory and naïve TB10Rg3 cells were co-transferred at a 1:1 ratio 1 day prior to challenge. (c, d) The proportion of splenic TB10Rg3 cells (mean ± SEM) derived from naïve or memory TB10Rg3 3d after their co-transfer into mice administered amphi-TB10/poly(I:C)/CD40 1d (high antigen) or 21d (low antigen) prior to transfer. Their ratios and dilution of proliferation dye are shown. (e) eFluor450 dilution by naïve or memory TB10Rg3 cells 64h after culture with peptide-coated splenocytes (left) and summary of dose-response data (right). Memory: naïve T cell ratios across time points were compared by a 2-way ANOVA and the Bonferroni post-test. * p < 0.05, ** p < 0.01, **** p < 0.0001, n.s. not significant. Data are representative of 2–3 independent experiments, each with 3–4 mice per time point.
Fig 6
Fig 6. Memory CD8+ T cells with a higher affinity TCR can display improved responses during tuberculosis.
(a) Proportion of adoptively-transferred memory (CD45.1+) and naïve (CD45.2+)-derived TB10Rg4 CD8+ T cells in the MLN, lung, and spleen 14, 18, or 21d after Mtb infection, compared to spleens from uninfected mice 1 day after adoptive transfer (CTRL) (top). Cell numbers of memory and naïve-derived TB10Rg4 CD8+ T cells from the same mice (bottom). (b) The relative proportion of adoptively-transferred, memory-derived TB10Rg4 (Vβ5+) and naïve-derived TB10Rg3 (Vβ11+) CD8+ T cells in the MLN, lung, and spleen 14, 18, or 21d after Mtb infection, compared to those in the spleens of uninfected mice 1 day after adoptive transfer (CTRL) (top). Cell numbers of memory-derived (TB10Rg4) and naïve-derived (TB10Rg3) CD8+ T cells from the same mice at each time point during infection (bottom). * p < 0.05, ** p < 0.01, *** p < 0.001, **** p < 0.0001, n.s. not significant. Data are representative of 2 independent experiments, each with 4 mice per group.
Fig 7
Fig 7. TCRβ deep sequencing reveals the dual contribution of the primary and secondary effector CD8+ T cell response in vaccinated mice challenged with Mtb.
(a) Clonality of TB10-specific CD8+ T cells from blood 1w after amphi-TB10 vaccination, compared to those isolated from lung in the same individuals 4-5w after Mtb challenge, or compared to those isolated from unvaccinated, Mtb-infected mice [data for primary Mtb-infected mice from [32]]. Data are from 3–10 individuals/group, independently analyzed from two independent experiments. One-way ANOVA with a Bonferroni post-test was used to compare clonality. * p < 0.05, **** p < 0.0001. (b) Sharing of unique TCRβ DNA sequences between the post-vaccination (blood) and post-Mtb challenge (lung) repertoires of TB10-specific CD8+ T cells. Numbers are the average of unique TCRβ DNA clonotypes, determined for four subjects, each analyzed individually. (c) The percentage of the lung TB10-specific CD8+ TCRs detected either only post-Mtb challenge (e.g., 1° response); or, detected both post-vaccination and post-Mtb challenge (e.g., 2° response). Left, unique clonotypes; center, total TCRs; right, total TCRs that had a frequency of >0.5%. (d) Representative logarithmic scatter plot showing the frequencies of all clonotypes detected in the blood or in the lung of a single individual 5 weeks after Mtb challenge. Green, lung only; Red, blood only; Blue, Shared. The dotted lines indicate frequencies of 0.005% and 0.5%, respectively. (e) Sharing of unique TCRβ DNA sequences between blood and lung repertoires of TB10-specific CD8+ T cells in individual mice, 5 weeks after infection. Numbers are the average of unique TCRβ DNA clonotypes, determined for three subjects analyzed individually. (f) The percentage of the lung repertoire of TB10-specific CD8+ TCRs that were detected only in the lung (“lung only”) or detected in the blood and lung (“shared with blood”) after Mtb challenge. Left, unique clonotypes; right, total TCRs. Only clonotypes with a frequency of >0.005% were analyzed.
Fig 8
Fig 8. Selection drives the expansion of TB10-specific CD8+ T cells.
(a) Representative logarithmic scatter plot showing the frequencies of all clonotypes detected in the post-vaccination (blood) or in the post-Mtb challenge (lung) repertoire of TB10-specific CD8+ T cells. Green, lung only (de novo response); red, blood only (unsuccessful); blue, shared (persistent & successful). The diagonal dashed line separates the successful and the persistent clonotypes. The dotted lines indicate frequencies of 0.005%, 0.5%, and 3%. (b) The proportion of total TCRβ amino acid sequences categorized as “unsuccessful”, “persisters”, “successful”, or “de novo” as defined in the text, from the post-vaccination (blood, left) or post-Mtb challenge (lung, right) repertoires. Top row, unique clonotypes; bottom row, total TCRs. Only clonotypes with a frequency of >0.005% were analyzed. (c) CDR3β length distribution among unique clonotypes categorized as “unsuccessful”, “persisters”, “successful”, or “de novo”. (d) CDR3β amino acid motifs were determined for highly prevalent clonotypes (>0.5% in post-vaccination or post-Mtb challenge repertoire), which were identified as “persisters” or “successful” TCR clonotypes with a CDR3 length of 13, 14, or 15 aa. For successful TCRs, different frequency thresholds were chosen (0.5%, 2%, or 3%) to identify structural motifs among highly prevalent clonotypes. The numbers below each sequence refer to the number of unique clonotypes that were used to derive the motif and the average frequency of each clonotype among total productive sequences.

Similar articles

Cited by

References

    1. Swain SL, Weinberg AD, English M. CD4+ T cell subsets. Lymphokine secretion of memory cells and of effector cells that develop from precursors in vitro. J Immunol. 1990;144: 1788–1799. - PubMed
    1. Swain SL, Bradley LM, Croft M, Tonkonogy S, Atkins G, Weinberg AD, et al. Helper T-cell subsets: phenotype, function and the role of lymphokines in regulating their development. Immunol Rev. 1991;123: 115–144. - PubMed
    1. Jameson SC, Masopust D. Diversity in T Cell Memory: An Embarrassment of Riches. Immunity. Elsevier Inc; 2009;31: 859–871. 10.1016/j.immuni.2009.11.007 - DOI - PMC - PubMed
    1. Ahmed R, Gray D. Immunological memory and protective immunity: understanding their relation. Science. 1996;272: 54–60. - PubMed
    1. Vitetta ES, Berton MT, Burger C, Kepron M, Lee WT, Yin XM. Memory B and T cells. Annu Rev Immunol. 1991;9: 193–217. 10.1146/annurev.iy.09.040191.001205 - DOI - PubMed

Publication types

Substances