. 2016 May;24(5):921-31.
doi: 10.1016/j.joca.2015.12.009. Epub 2015 Dec 31.

Unilateral anterior crossbite induces aberrant mineral deposition in degenerative temporomandibular cartilage in rats

Affiliations

Unilateral anterior crossbite induces aberrant mineral deposition in degenerative temporomandibular cartilage in rats

M Zhang et al. Osteoarthritis Cartilage. 2016 May.

Abstract

Objective: To investigate whether mechanical stress induces mineral deposits that contribute to matrix degradation at the onset of osteoarthritis (OA) in temporomandibular joint (TMJ) cartilage.

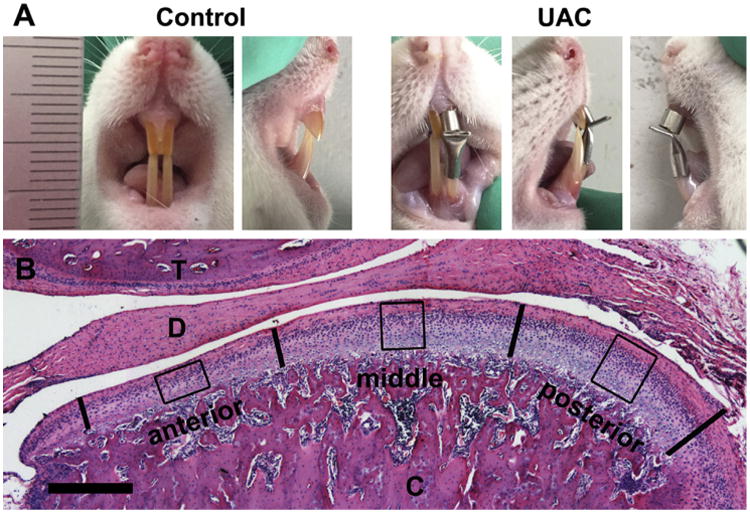
Design: Female Spraguee-Dawley rats were subjected to an unilateral anterior crossbite (UAC) procedure. Histology, electron microscopy, and energy dispersive spectrometer (EDS) were used to examine cartilage matrix structures and composition of mineral deposit in the affected TMJ cartilage. Protein and/or RNA expression of phenotypic markers and mineralization modulators and matrix degradation was analyzed by immunohistochemistry and/or real-time PCR. Synthetic basic calcium phosphate (BCP) and calcium pyrophosphate dehydrate (CPPD) crystals were used to stimulate ATDC5 cells for their impact on cell differentiation and gene expression.

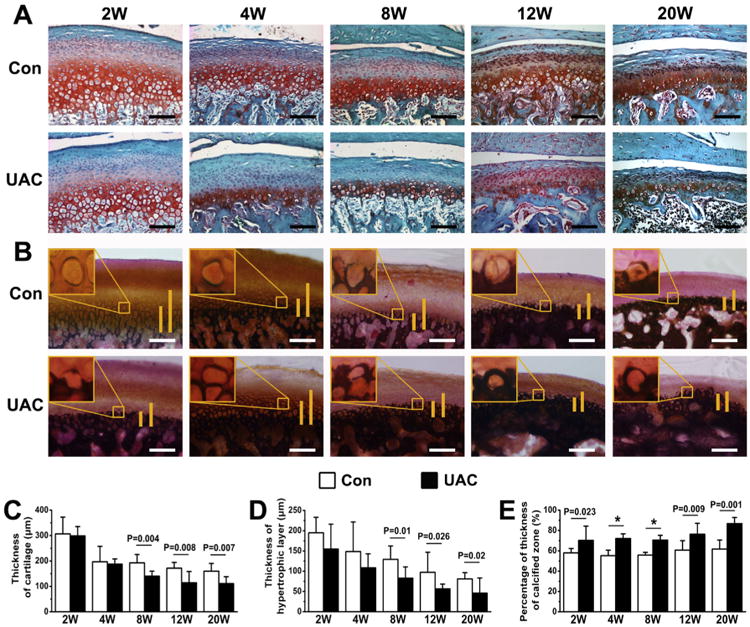
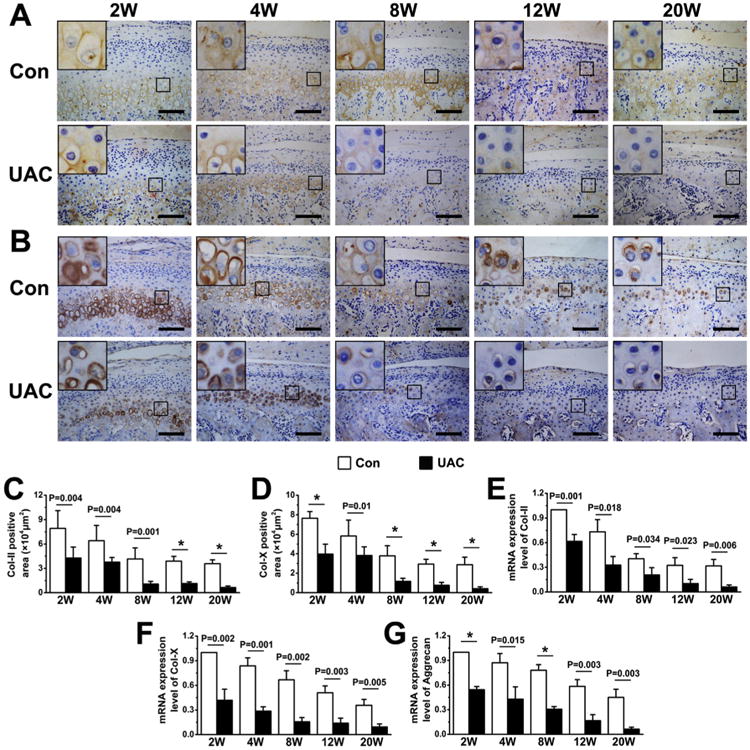
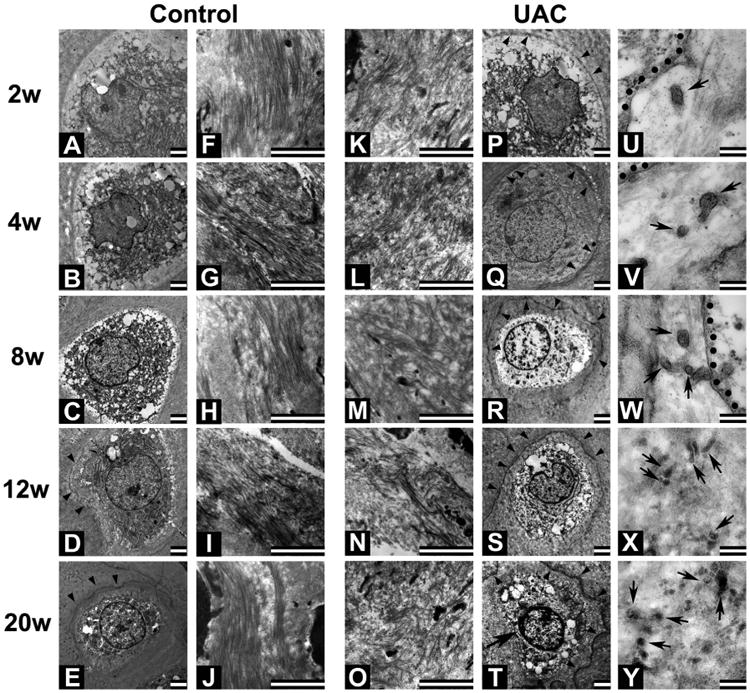
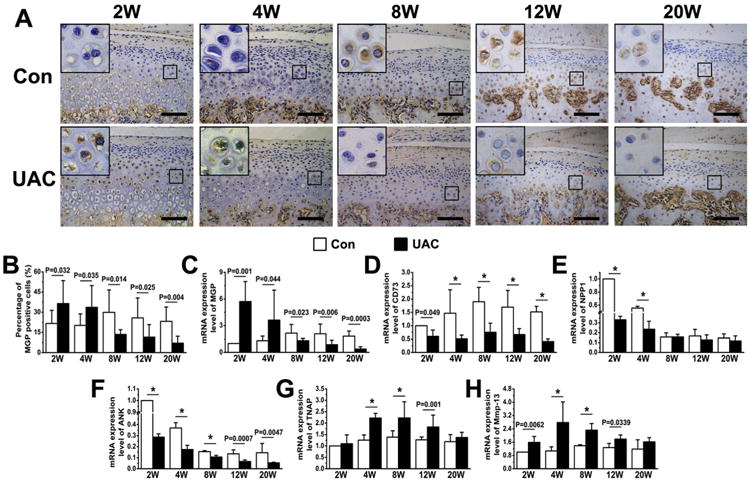
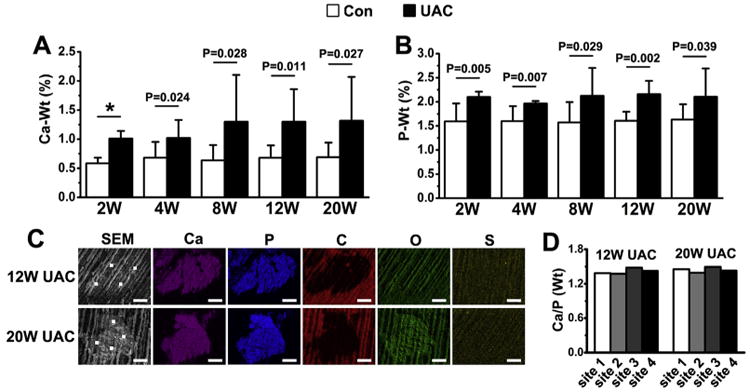
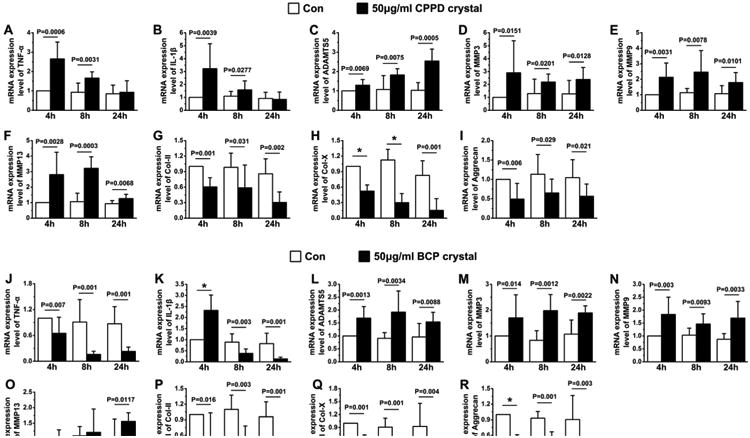
Results: Fragmented and disorganized collagen fibers, expanded fibrous spaces, and enhancement of matrix vesicle production and mineral deposition were observed in matrices surrounding hypertrophic chondrocytes in cartilage as early as 2-weeks post-UAC and exacerbated with time. The mineral deposits in TMJ cartilage at 12- and 20-weeks post-UAC had Ca/P ratios of 1.42 and 1.44, which are similar to the ratios for BCP. The expression of mineralization inhibitors, NPP1, ANK, CD73, and Matrix gla protein (MGP) was decreased from 2 to 8 weeks post-UAC, so were the chondrogenic markers, Col-2, Col-X and aggrecan. In contrast, the expression of tissue-nonspecific alkaline phosphatase (TNAP) and MMP13 was increased 4-weeks post-UAC. Treating ADTC5 cells with BCP crystals increased MMPs and ADAMTS5 expression, but reduced matrix production in a time-dependent manner.

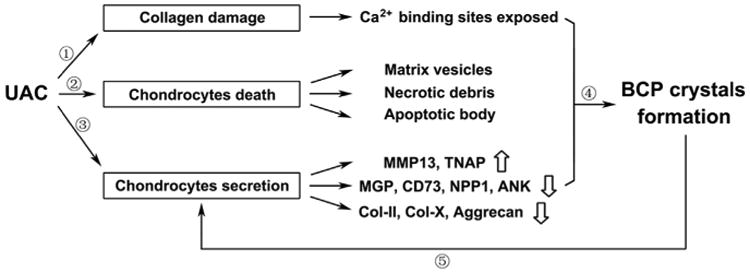
Conclusion: UAC induces deposition of BCP-like minerals in osteoarthritic cartilage, which can stimulate matrix degradation by promoting the expression of cartilage-degrading enzymes to facilitate OA progression.

Keywords: BCP; CPPD; Calcium-crystal; Osteoarthritis (OA); Temporomandibular joint (TMJ).


Conflict of interest statement

Competing interests: The authors do not have any conflicts of interest to report.

Figures

Fig. 1
Fig. 1
(A) The representative frontal and lateral views of anterior dental occlusion relationship in the control and UAC rats. (B) A typical central sagittal section of TMJ stained with hematoxylin and eosin. The bold vertical lines divide the articular cartilage of mandibular condyle into three equal sections (anterior, middle, and posterior). The boxes depict regions of interest in each section, which were included in quantitative analyses. T, temporal bone; D, articular disc; C, mandibular condyle.
Fig. 2
Fig. 2
Histology staining of condylar cartilage from control and UAC rats at different time points (2, 4, 8, 12, and 20 weeks) after the operation. (A) Safranin O staining showed the irregularly arranged chondrocytes and reduced proteoglycan content in the cartilage of UAC vs control groups. (B) von Kossa staining showed expanded calcified zones in the UAC vs age-matched control cartilage. Long vertical bars depict total height of the hypertrophic cartilage. Short vertical bars indicate mineralized cartilage. Measurements of (C) total thickness, (D) hypertrophic layer thickness and (E) proportion of calcified cartilage in the mandibular condylar cartilage from UAC and control rats. n = 4 rats per group. Con, control group; UAC, UAC group; Bar = 100 μm. Values are represented as the mean with lower and upper limits of 95% CI. *P < 0.0001 or as specified.
Fig. 3
Fig. 3
Immunohistochemical staining and quantitative real-time PCR analyses of condylar cartilage from control and UAC rats at different time points (2, 4, 8, 12, and 20 weeks) after the operation. (A–B) Immunohistochemical staining of Col-II (A, goat-anti-Col-II antibody) and Col-X (B, rabbit-anti-Col-X antibody) in control and UAC cartilage. (C–D) Determination of Col-II-positive areas (C) and Col-X-positive areas (D) in condylar cartilage from UAC and control rats. n = 4 rats per group. (E–G) Quantitative real-time PCR analyses for the expression of Col-II (E), Col-X (F) and Aggrecan (G). Analysis repeated for four times (n = 4). Values are represented as the mean with lower and upper limits of 95% CI. *P < 0.0001 or as specified.
Fig. 4
Fig. 4
TEM images of hypertrophic chondrocytes and surrounding matrix in mandibular condylar cartilage from control (A–J) and UAC (K–Y) rats. Bar: 2 mm in A–T; 200 nm in U–Y. n = 4 rats per group. Collagen fibers in the matrices are tightly packed at all time points in control cartilage. Only slight vestige of mineralization (arrowhead) is observed in control cartilage beyond the 12-week time point (D and E). Fragmented collagen fibers and expanded interfiber spaces are obvious in UAC cartilage at all time points (K–O). In the latter cartilage, vestige of mineralization (PeT, arrowheads) is observed beginning 2 weeks after operation and aggravated with time. Intense mineral vestige is found in matrices surrounding the cell (T) displaying small patches of condensed chromatin (arrow), discontinuous membrane, structural damaged organelles and numerous intracellular vesicles. (U–Y) Enlarged images show vesicle-like structures in pericellular matrices surrounding hypertrophic chondrocytes in UAC-treated cartilage at all time points (dotted lines: membrane; arrows: vesicular structures adjacent to the cell membrane).
Fig. 5
Fig. 5
Immunohistochemical staining and quantitative real-time PCR analyses of condylar cartilage from control and UAC rats at different time points (2, 4, 8, 12, and 20 weeks) after the operation. (A) Immunohistochemical staining of MGP (rabbit-anti-MGP antibody) in control and UAC cartilage. (B) Numbers of MGP-positive cells in condylar cartilage from UAC and control rats. n = 4 rats per group. (CeH) Quantitative real-time PCR analyses for the expression of Mgp (C), CD73 (D), Npp1 (E), Ank (F), Tnap (G) and Mmmp13 (H) in mandibular condyles of control and UAC rats. Analysis repeated for four times (n = 4). Values are represented as the mean with lower and upper limits of 95% CI. *P < 0.0001 or as specified.
Fig. 6
Fig. 6
Ca (A) and P (B) contents in TMJ cartilage between UAC rats and their controls. n = 4 rats per group. Values are represented as the mean with lower and upper limits of 95% CI. *P < 0.0001 or as specified. (C) The mineral nodules were visualized by SEM and their chemical compositions were quantified by EDS. Ca and P contents were enriched but C content was pinched in those nodules. White dots depict sites for EDS analyses; Ca, calcium; P, phosphorus; C, carbon; O, oxygen; S, sulphur. Bar = 5 μm. (D) Ratios of Ca to P in the four selected sites in the crystal nodules found in the cartilage of 12- and 20-week UAC groups.
Fig. 7
Fig. 7
The effects of CPPD (AeI) and BCP (JeR) on the expression of Tnf-α (A, J), Il-1β (B, K), Adamts5 (C, L), Mmp3 (D, M), Mmp9 (E, N), Mmp13 (F, O), Col-II (G, P), Col-X (H, Q), and Aggrecan (I, R) RNA in cultures of chondrogenic ATDC5 cells after 4, 8, and 24 h of treatments. Values are represented as the mean with lower and upper limits of 95% CI. n = 4 separate cultures; *P < 0.0001 or as specified.
Fig. 8
Fig. 8
Schema for the effects of UAC on the BCP crystals formation in osteoarthritic cartilage. ①Abnormal mechanical force induced by UAC led the fragmentation of collagen fibers, making the Ca2+ binding site of the collagen fibers exposed. ② UAC stimulated cell death to produce matrix vesicles and apoptotic bodies to serve as mineral nucleation sites. ③UAC down-regulated the expression of inhibitors of mineralization accompanied with the up-regulation of TNAP and MMP13. ④The above changes contributed to the mineral deposition, especially BCP crystals. ⑤Mineral crystals served as a feed-forward signal to reduce production of matrix protein and enhanced the secretion of matrix degrading enzymes, thus further accelerating the cartilage degeneration.

References

    1. Rosenthal AK. Calcium crystal deposition and osteoarthritis. Rheum Dis Clin North Am. 2006;32:401–12. - PubMed
    1. Ea HK, Lioté F. Advances in understanding calcium-containing crystal disease. Curr Opin Rheumatol. 2009;21:150–7. - PubMed
    1. MacMullan P, McMahon G, McCarthy G. Detection of basic calcium phosphate crystals in osteoarthritis. Joint Bone Spine. 2011;78:358–63. - PubMed
    1. Ferrone C, Andracco R, Cimmino MA. Calcium pyrophosphate deposition disease: clinical manifestations. Reumatismo. 2012;63:246–52. - PubMed
    1. Tsui FW. Genetics and mechanisms of crystal deposition in calcium pyrophosphate deposition disease. Curr Rheumatol Rep. 2012;14:155–60. - PubMed

Publication types

MeSH terms