

Trends in Short- and Long-Term Outcomes for Takotsubo Cardiomyopathy Among Medicare Fee-for-Service Beneficiaries, 2007 to 2012
- PMID: 26746377
- PMCID: PMC5323042
- DOI: 10.1016/j.jchf.2015.09.013
Trends in Short- and Long-Term Outcomes for Takotsubo Cardiomyopathy Among Medicare Fee-for-Service Beneficiaries, 2007 to 2012
Abstract
Objectives: The aim of this study was to assess trends in hospitalizations and outcomes for Takotsubo cardiomyopathy (TTC).
Background: There is a paucity of nationally representative data on trends in short- and long-term outcomes for patients with TTC.
Methods: The authors examined hospitalization rates; in-hospital, 30-day, and 1-year mortality; and all-cause 30-day readmission for Medicare fee-for-service beneficiaries with principal and secondary diagnoses of TTC from 2007 to 2012.
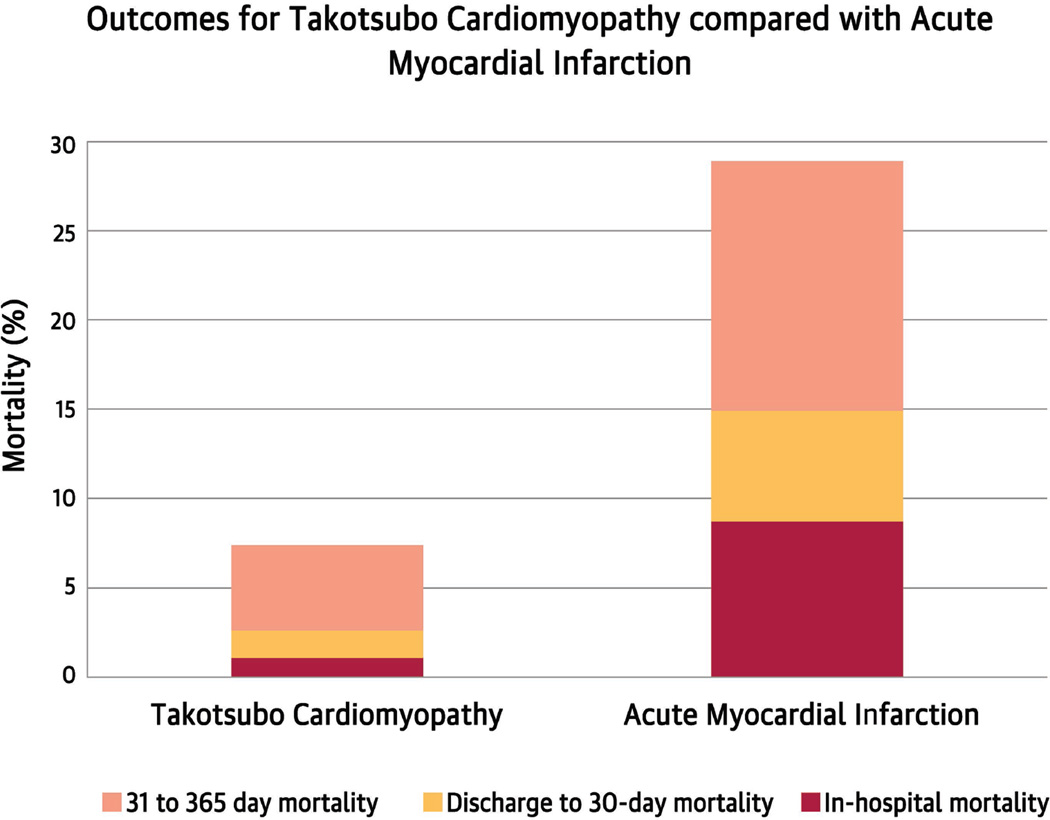
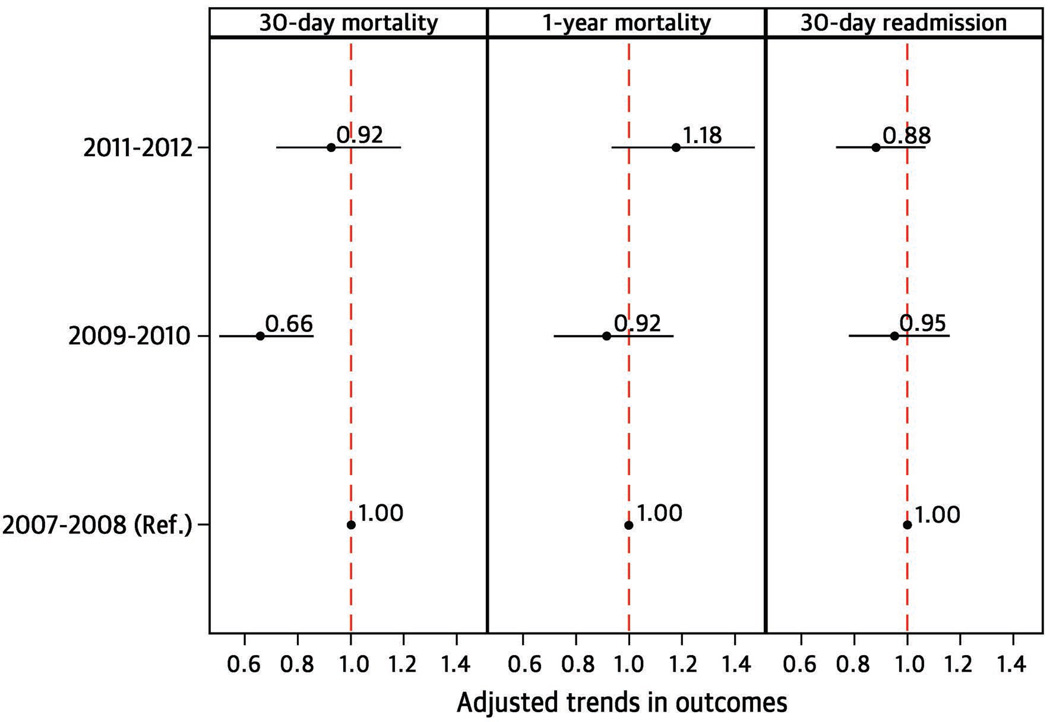
Results: Hospitalizations for principal or secondary diagnosis of TTC increased from 5.7 per 100,000 person-years in 2007 to 17.4 in 2012 (p for trend < 0.001). Patients were predominantly women and of white race. For principal TTC, in-hospital, 30-day, and 1-year mortality was 1.3% (95% confidence interval [CI]: 1.1% to 1.6%), 2.5% (95% CI: 2.2% to 2.8%), and 6.9% (95% CI: 6.4% to 7.5%), and the 30-day readmission rate was 11.6% (95% CI: 10.9% to 12.3%). For secondary TTC, in-hospital, 30-day, and 1-year mortality was 3% (95% CI: 2.7% to 3.3%), 4.7% (95% CI: 4.4% to 5.1%), and 11.4% (95% CI: 10.8% to 11.9%), and the 30-day readmission rate was 15.8% (95% CI: 15.1% to 16.4%). Over time, there was no change in mortality or readmission rate for both cohorts. Patients ≥85 years of age had higher in-hospital, 30-day, and 1-year mortality and 30-day readmission rates. Among patients with principal TTC, male and nonwhite patients had higher 1-year mortality than their counterparts, whereas in those with secondary TTC, mortality was worse at all 3 time points. Nonwhite patients had higher 30-day readmission rates for both cohorts.
Conclusions: Hospitalization rates for TTC are increasing, but short- and long-term outcomes have not changed. At 1 year, 14 in 15 patients with principal TTC and 8 in 9 with secondary TTC are alive. Older, male, and nonwhite patients have worse outcomes.
Keywords: apical ballooning syndrome; mortality; readmission; stress cardiomyopathy.
Copyright © 2016 American College of Cardiology Foundation. Published by Elsevier Inc. All rights reserved.
Figures
Comment in
-
What Medicare Knows About the Takotsubo Cardiomyopathy.JACC Heart Fail. 2016 Mar;4(3):206-7. doi: 10.1016/j.jchf.2015.10.011. Epub 2015 Dec 30. JACC Heart Fail. 2016. PMID: 26746374 No abstract available.
-
What Is the Prevalence of Diabetes Mellitus in Patients With Principal and Secondary Takotsubo Syndrome?JACC Heart Fail. 2016 May;4(5):417. doi: 10.1016/j.jchf.2016.01.001. JACC Heart Fail. 2016. PMID: 27126285 No abstract available.
-
Reply: What Is the Prevalence of Diabetes Mellitus in Patients With Principal and Secondary Takotsubo Syndrome?JACC Heart Fail. 2016 May;4(5):417-8. doi: 10.1016/j.jchf.2016.02.003. JACC Heart Fail. 2016. PMID: 27126286 No abstract available.
-
Prognosis in Patients With Takotsubo Cardiomyopathy.JACC Heart Fail. 2016 Jun;4(6):519-20. doi: 10.1016/j.jchf.2016.03.009. JACC Heart Fail. 2016. PMID: 27256761 No abstract available.
-
Medicare Trends of Takotsubo Cardiomyopathy Outcomes: Is it Just the Tip of an Iceberg?JACC Heart Fail. 2016 Jul;4(7):606. doi: 10.1016/j.jchf.2016.04.001. JACC Heart Fail. 2016. PMID: 27364972 No abstract available.
References
-
- Akashi YJ, Nef HM, Lyon AR. Epidemiology and pathophysiology of Takotsubo syndrome. Nat Rev Cardiol. 2015;12:387–397. - PubMed
-
- Prasad A, Lerman A, Rihal CS. Apical ballooning syndrome (Tako-Tsubo or stress cardiomyopathy): A mimic of acute myocardial infarction. Am Heart J. 2008;155:408–417. - PubMed
-
- Eitel I, von Knobelsdorff-Brenkenhoff F, Bernhardt P, et al. Clinical characteristics and cardiovascular magnetic resonance findings in stress (takotsubo) cardiomyopathy. JAMA. 2011;306:277–286. - PubMed
-
- Singh NK, Rumman S, Mikell FL, Nallamothu N, Rangaswamy C. Stress cardiomyopathy: Clinical and ventriculographic characteristics in 107 North American subjects. Int J Cardiol. 2010;141:297–303. - PubMed
-
- Sharkey SW, Windenburg DC, Lesser JR, et al. Natural history and expansive clinical profile of stress (tako-tsubo) cardiomyopathy. J Am Coll Cardiol. 2010;55:333–341. - PubMed
Publication types
MeSH terms
Grants and funding
LinkOut - more resources
Full Text Sources
Other Literature Sources
Medical
