. 2016 Jan 8;18(1):5.
doi: 10.1186/s13058-015-0664-2.

Increased peri-ductal collagen micro-organization may contribute to raised mammographic density

Affiliations

Increased peri-ductal collagen micro-organization may contribute to raised mammographic density

James C McConnell et al. Breast Cancer Res. .

Abstract

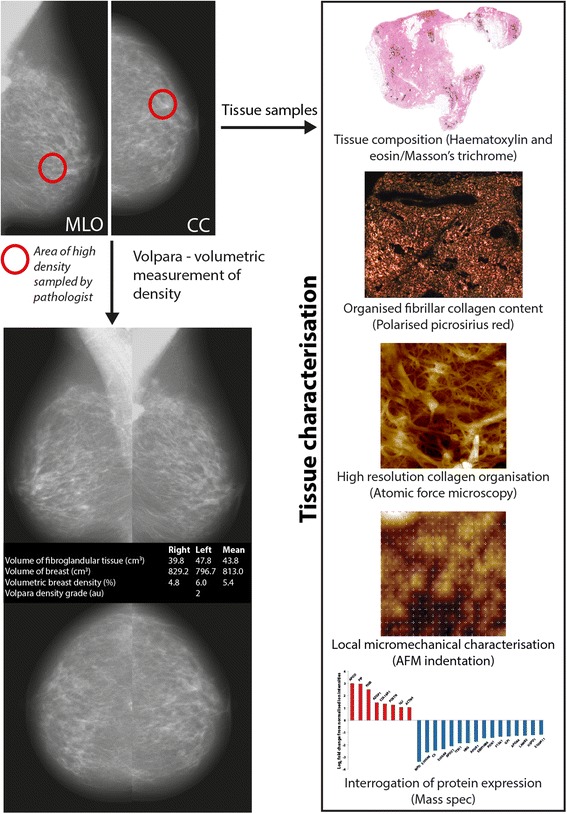
Background: High mammographic density is a therapeutically modifiable risk factor for breast cancer. Although mammographic density is correlated with the relative abundance of collagen-rich fibroglandular tissue, the causative mechanisms, associated structural remodelling and mechanical consequences remain poorly defined. In this study we have developed a new collaborative bedside-to-bench workflow to determine the relationship between mammographic density, collagen abundance and alignment, tissue stiffness and the expression of extracellular matrix organising proteins.

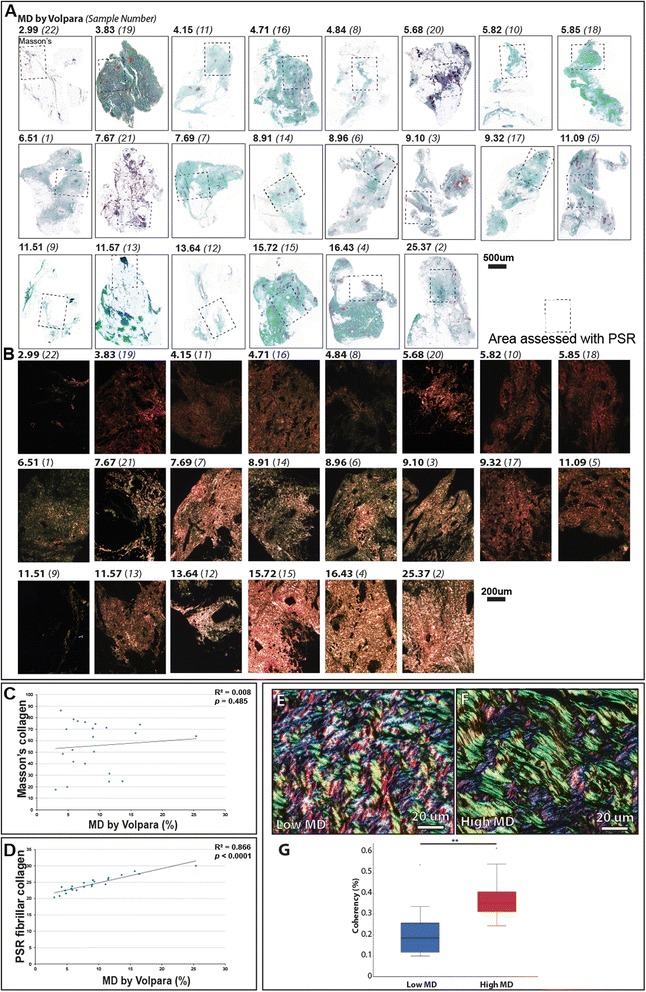
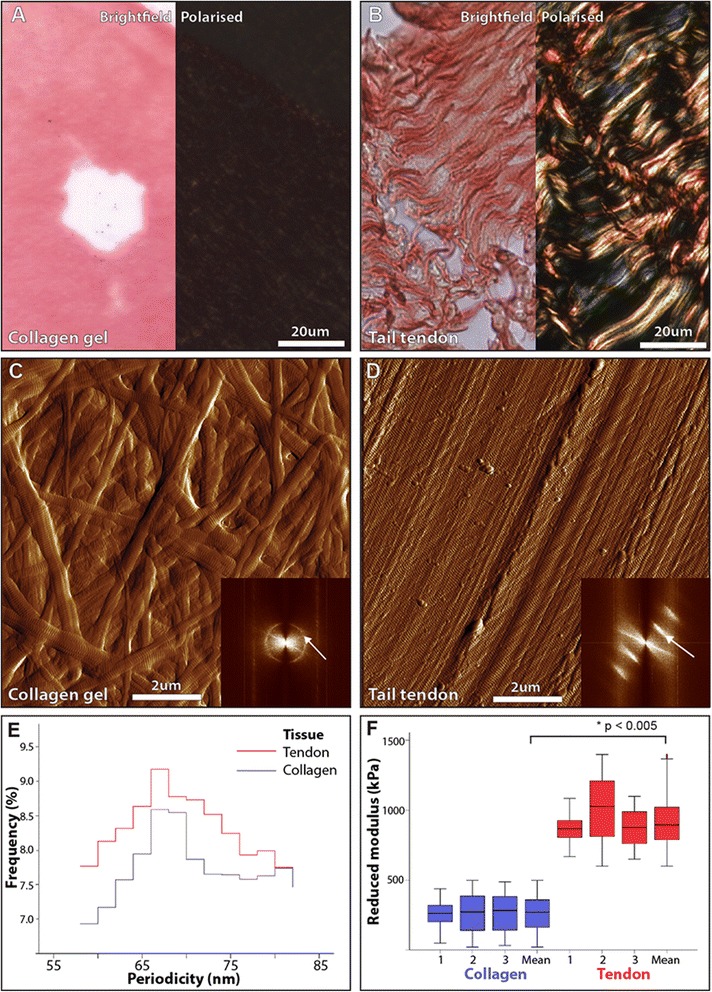
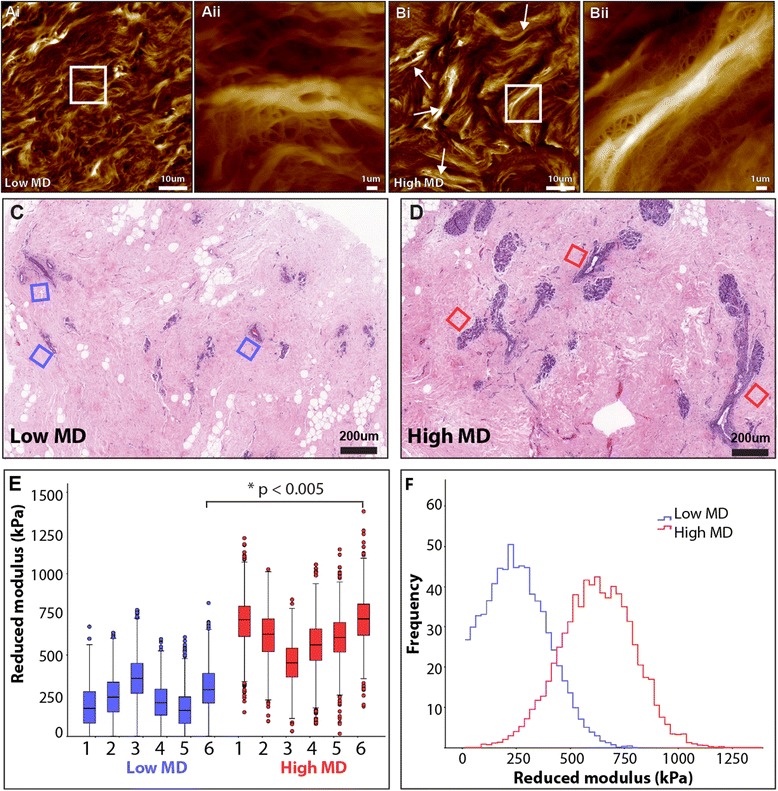
Methods: Mammographic density was assessed in 22 post-menopausal women (aged 54-66 y). A radiologist and a pathologist identified and excised regions of elevated non-cancerous X-ray density prior to laboratory characterization. Collagen abundance was determined by both Masson's trichrome and Picrosirius red staining (which enhances collagen birefringence when viewed under polarised light). The structural specificity of these collagen visualisation methods was determined by comparing the relative birefringence and ultrastructure (visualised by atomic force microscopy) of unaligned collagen I fibrils in reconstituted gels with the highly aligned collagen fibrils in rat tail tendon. Localised collagen fibril organisation and stiffness was also evaluated in tissue sections by atomic force microscopy/spectroscopy and the abundance of key extracellular proteins was assessed using mass spectrometry.

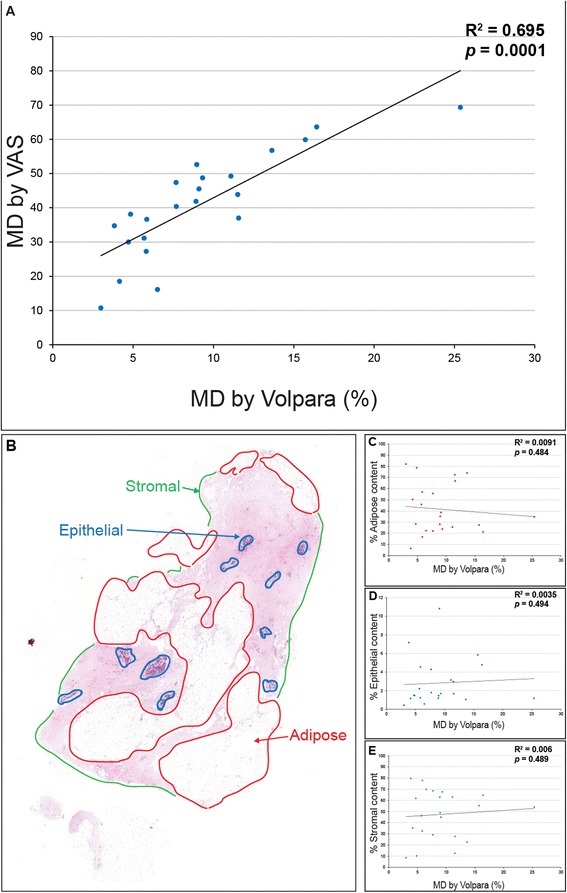
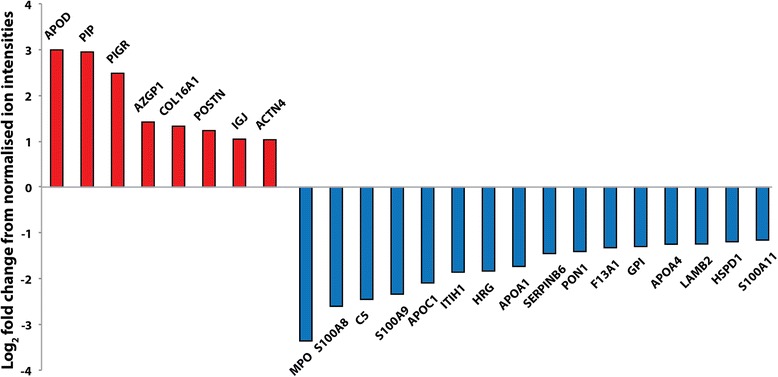
Results: Mammographic density was positively correlated with the abundance of aligned periductal fibrils rather than with the abundance of amorphous collagen. Compared with matched tissue resected from the breasts of low mammographic density patients, the highly birefringent tissue in mammographically dense breasts was both significantly stiffer and characterised by large (>80 μm long) fibrillar collagen bundles. Subsequent proteomic analyses not only confirmed the absence of collagen fibrosis in high mammographic density tissue, but additionally identified the up-regulation of periostin and collagen XVI (regulators of collagen fibril structure and architecture) as potential mediators of localised mechanical stiffness.

Conclusions: These preliminary data suggest that remodelling, and hence stiffening, of the existing stromal collagen microarchitecture promotes high mammographic density within the breast. In turn, this aberrant mechanical environment may trigger neoplasia-associated mechanotransduction pathways within the epithelial cell population.


Figures

Fig. 1
Fig. 1
A novel workflow for sampling radio-dense breast tissue. A radiologist identified regions of elevated radiographic density in digital mammograms which were then excised by a pathologist prior to histological characterization of collagen abundance and organization in all 22 patients. CC craniocaudal view, MLO mediolateral oblique view. Following stratification of patients into low and high mammographic density (MD) groups (by Volpara® score), in regions of the tissue at least 4 cm from any tumours the molecular, ultrastructural and micro-mechanical drivers of MD were characterized as individuals with low (n = 6) and high (n = 6) MD by atomic force microscopy (AFM). Three of each of the samples with low and high MD (low-MS, and high-MS) were also analysed by mass spectrometry (mass spec). AFM atomic force microscopy
Fig. 2
Fig. 2
Assessment of mammographic density and tissue architecture. a, b There was a significant correlation between two common methods of assessing mammographic density (MD), visual analogue scale (VAS) and Volpara® (a). b H&E-stained paraffin section of resected breast tissue (low MD). Adipose, epithelial and stromal tissues are highlighted in red, blue and green respectively. ce Tissue architecture (adipose, epithelial and stromal content) was not significantly correlated with MD
Fig. 3
Fig. 3
Relationship between mammographic density and amorphous and fibrillar collagen contents. a Masson’s trichrome staining (amorphous collagen: blue/green, epithelial tissue: blue/black). Bold numbers denote Volpara score®, anonymous patient identifiers are reported in parentheses. b, Serial paraffin sections stained with Picrosirius red (PSR) and visualised by polarised light microscopy. Note that the boxed regions (a) correspond to the areas corresponding to the enlarged PSR regions in b. For each patient, three regions of the tissue shown in a were analysed in more detail by PSR staining and by Masson’s trichrome staining. However for clarity, only one region is shown in a and b. c Amorphous collagen content as visualized by Masson’s trichrome staining was not correlated with mammographic density (MD). Note that for the quantitative data provided (c and d), we analysed (as above) three regions of tissue for each sample, though for clarity only one region is shown in a. d Fibrillar collagen content was significantly correlated with MD. e, f Polarised light microscopy of PSR-stained sections assessed using OrientationJ: e low MD, f high MD. Colour is indicative of fibre alignment. g Coherency of organised fibrillar collagen was significantly increased in high MD (0.38 % ± 0.11) compared to low MD (0.21 % ± 0.11, p <0.001, n =18)
Fig. 4
Fig. 4
Picrosirius red-enhanced collagen birefringence in non-aligned collagen gels and aligned tendon collagen. a, b Bright field (left) and polarised light microscopy (right) of PSR-stained cryosections cut from reconstituted collagen gels (a) and rat tail tendon (b). c, d Atomic force microscopy (AFM) height maps of collagen gels (c) and tendon (d). Collagen alignment and periodicity (white arrows) can be readily determined from fast fourier transform (FFT) of AFM amplitude images. Inset position of the fast fourier transform (FFT) signals corresponding to collagen periodicity (diffuse circles for the gel and discrete lines for the tendon) are indicated by arrows. e AFM-derived collagen periodicity. f Micro-mechanical stiffness (modulus (MPa)) of in vitro (gel) (255 kPa ± 0.91) and in vivo (tendon) assembled collagen (869 kPa ± 0.90, p <0.005)
Fig. 5
Fig. 5
Ultrastructure and micro-mechanical stiffness of peri-ductal tissue in patients with low and high mammographic density (MD). a, b Atomic force microscopy (AFM) height maps of tissue of low (a) and high (b) MD captured at 150 × 150 μm and a sampling frequency of 4992 × 4992. Arrows indicate collagen fibril bundles (fibres) in high MD breast tissue. aii, bii Magnified regions corresponding to the boxes in ai and bi. Low MD tissue, as depicted (ai and aii) was characterised by the presence of loose fibrillar collagen bundles. However (bi, bii), the central large fibrillar bundle is connected to surrounding tissue by a network of fine fibrils (150–450 nm diameter). c, d H&E-stained breast biopsies from patients with low and high MD. Mechanical data were measured by atomic force microscopy (AFM) indentation (20 × 20 points) in 25-μm2 peri-ductal regions, shown in blue (low MD) and red (high MD) boxes. e, f Peri-ductal regions were significantly stiffer in patients with high MD compared with low MD (n = 12 patients, p <0.005)
Fig. 6
Fig. 6
Proteomic analysis of low and high mammographic density (MD) tissue. Proteins exhibiting >2-fold difference in abundance between tissue samples derived from patients with low and high MD. Red bars indicate greater abundance in tissue from patients with high MD: apolipoprotein D (APOD), a breast cyst fluid component and potentially a progesterone transporter [65], which is expressed in ductal carcinoma [66]; prolactin-inducible protein (PIP), a fibronectin-degrading aspartyl proteinase [67], which is frequently expressed in androgen receptor-positive breast tumours [68]; polymeric immunoglobulin receptor (PIGR), an epithelial cell-surface-located [69] biomarker of metastatic breast cancer [70]; zinc-alpha-2-glycoprotein (AZGP1), which stimulates lipolysis in adipocytes and is expressed in up 50 % of human breast cancers [71]; collagen XVI alpha 1 chain and periostin (COL16A1 and PSTN), extracellular matrix (ECM)-regulating proteins, which control collagen fibril interactions [–52]; and two further proteins: immunoglobulin J (IGJ) and ACTN4, which have no known links to cancer or ECM remodelling [72, 73]. Proteins with a greater abundance in low MD tissue include: myeloperoxidase (MPO), serum markers of breast cancer including the neutrophil activity marker myeloperoxidase [74]; S100A8 and S100A9 (proinflammatory regulators [75, 76]), which play an as-yet poorly defined role in metastasis [77, 78]; C5 (a proteolytic degradation product of complement C5 [79], S100A11), which facilitates keratinocyte differentiation; apolipoprotein C-I (APOC1), an inhibitor of lipoprotein/LDL receptor binding [80], which may promote chronic low-grade inflammation and breast cancer [81]; inter-alpha-trypsin inhibitor heavy chain H1 (H1ITIH1), a hyaluronan binding protein [82], which is implicated in inflammation and downregulated in breast cancer [83]; HRG, histidine-rich glycoprotein, which inhibits tumour vascularisation [84, 85]; apolipoprotein A-I (APOA1), which is reported to be protective against breast cancer [86]; SERPINB6, an ECM protease inhibitor [54]; coagulation factor XIII A chain (F13A1), which inhibits degradation of collagen precursors [53]; glucose-6-phosphate isomerase (GPI), which modulates cancer cell phenotype [87]; apolipoprotein A-IV (APOA4) - blood plasma levels are significantly reduced in BRCA1 mutation carriers modulate [88]; laminin subunit beta-2 (LAMB2), a component of basement membranes, which is implicated in tumour angiogenesis [89]. Both serum paraoxonase/arylesterase 1 (PON1) and mitochondrial 60 kDa heat shock protein (HSPD1) appear to be unrelated to either matrix homeostasis or tumourigenesis

References

    1. Boyd NF, Martin LJ, Bronskill M, Yaffe MJ, Duric N, Minkin S. Breast tissue composition and susceptibility to breast cancer. J Natl Cancer Inst. 2010;102(16):1224–37. doi: 10.1093/jnci/djq239. - DOI - PMC - PubMed
    1. McCormack VA. Breast density and parenchymal patterns as markers of breast cancer risk: a meta-analysis. Cancer Epidemiol Biomark Prev. 2006;15(6):1159–69. doi: 10.1158/1055-9965.EPI-06-0034. - DOI - PubMed
    1. Boyd NF, Martin LJ, Yaffe MJ, Minkin S. Mammographic density and breast cancer risk: current understanding and future prospects. Breast Cancer Res. 2011;13(6):223. doi: 10.1186/bcr2942. - DOI - PMC - PubMed
    1. Vachon CM, van Gils CH, Sellers TA, Ghosh K, Pruthi S, Brandt KR, et al. Mammographic density, breast cancer risk and risk prediction. Breast Cancer Res. 2007;9(6):217. doi: 10.1186/bcr1829. - DOI - PMC - PubMed
    1. Cuzick J, Warwick J, Pinney E, Duffy SW, Cawthorn S, Howell A, et al. Tamoxifen-induced reduction in mammographic density and breast cancer risk reduction: a nested case–control study. J Natl Cancer Inst. 2011;103(9):744–52. doi: 10.1093/jnci/djr079. - DOI - PubMed

Publication types

MeSH terms