. 2016 Mar;170(3):1745-56.
doi: 10.1104/pp.15.01872. Epub 2016 Jan 8.

Chloroplast Activity and 3'phosphadenosine 5'phosphate Signaling Regulate Programmed Cell Death in Arabidopsis

Affiliations

Chloroplast Activity and 3'phosphadenosine 5'phosphate Signaling Regulate Programmed Cell Death in Arabidopsis

Quentin Bruggeman et al. Plant Physiol. 2016 Mar.

Abstract

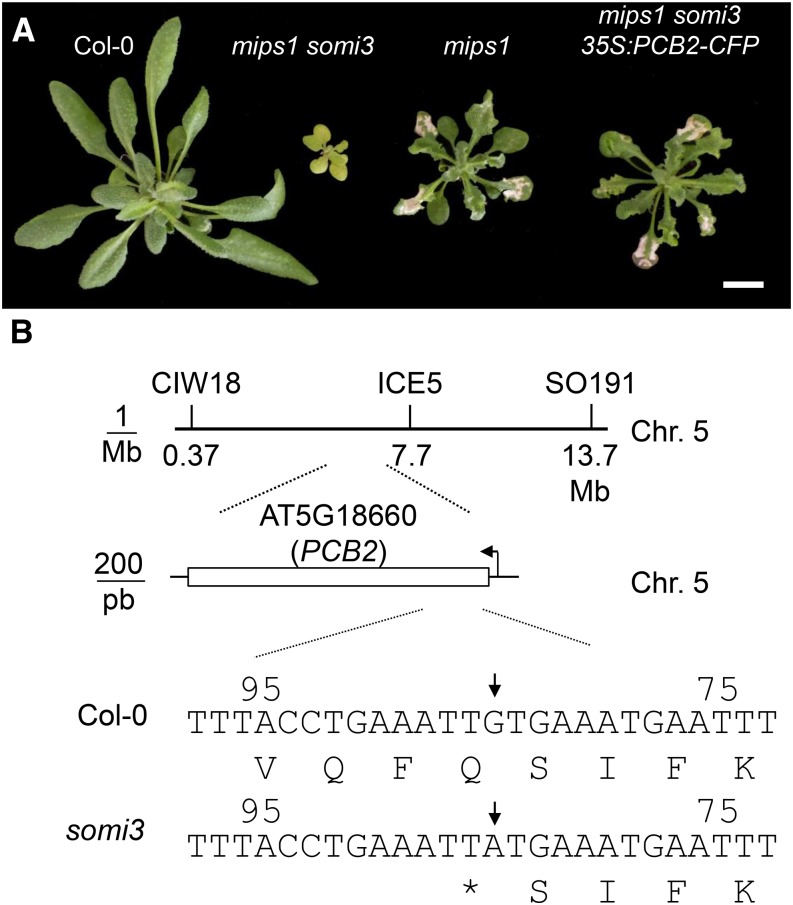
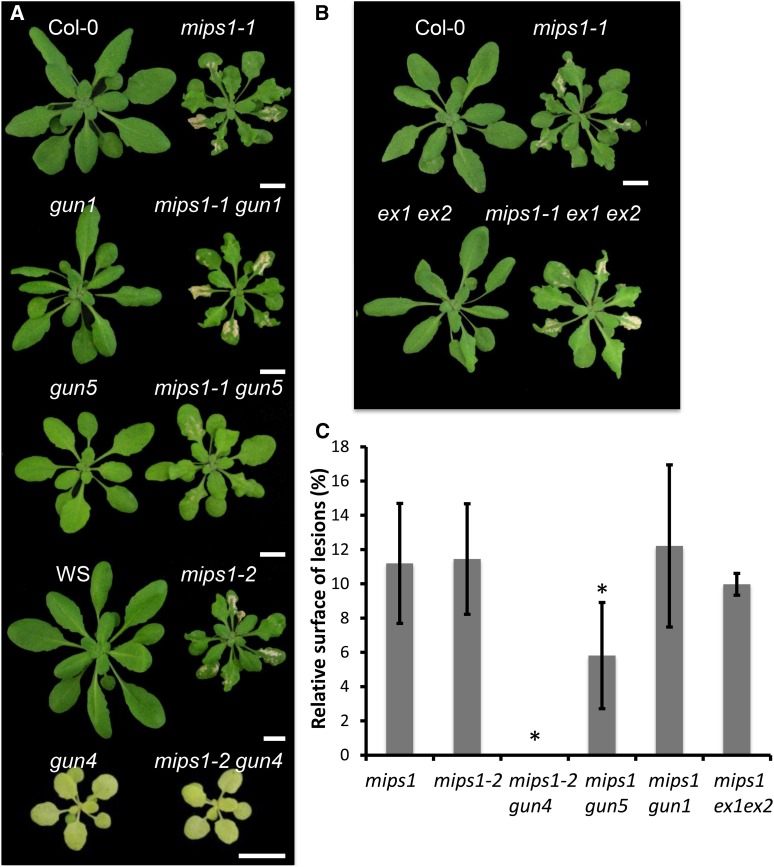
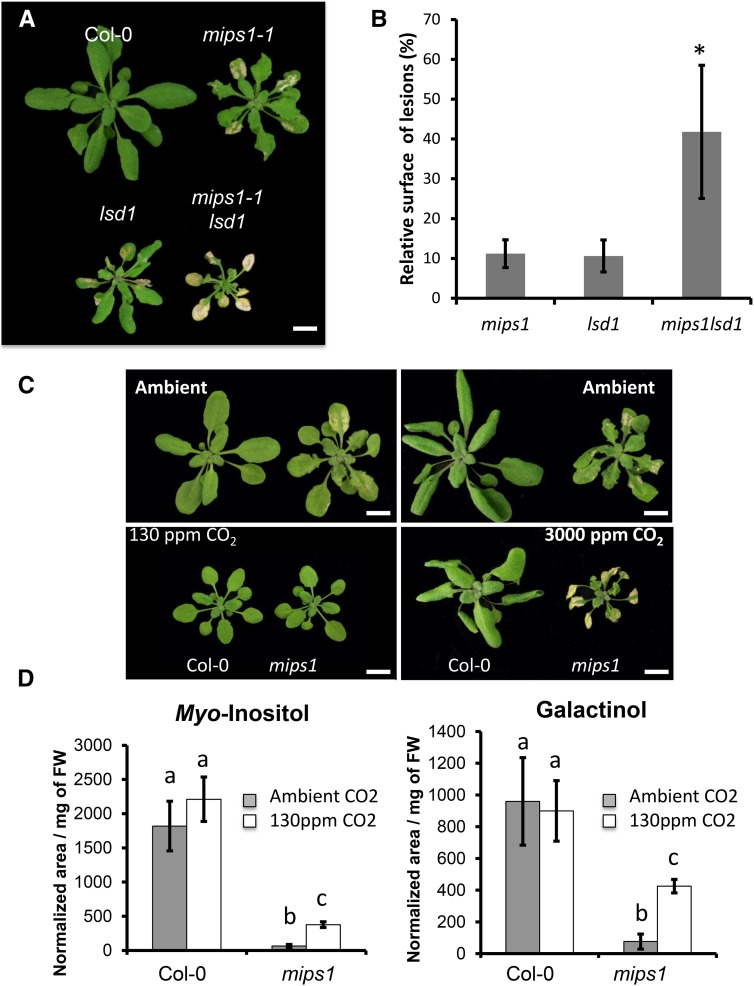
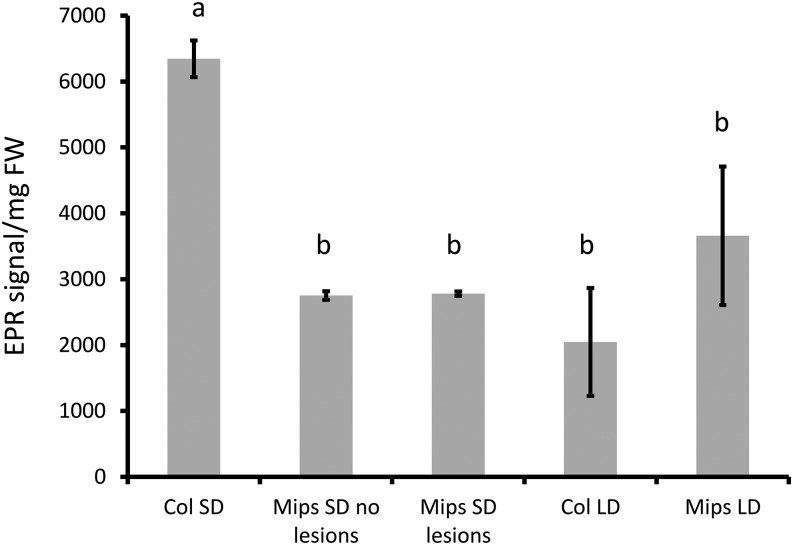
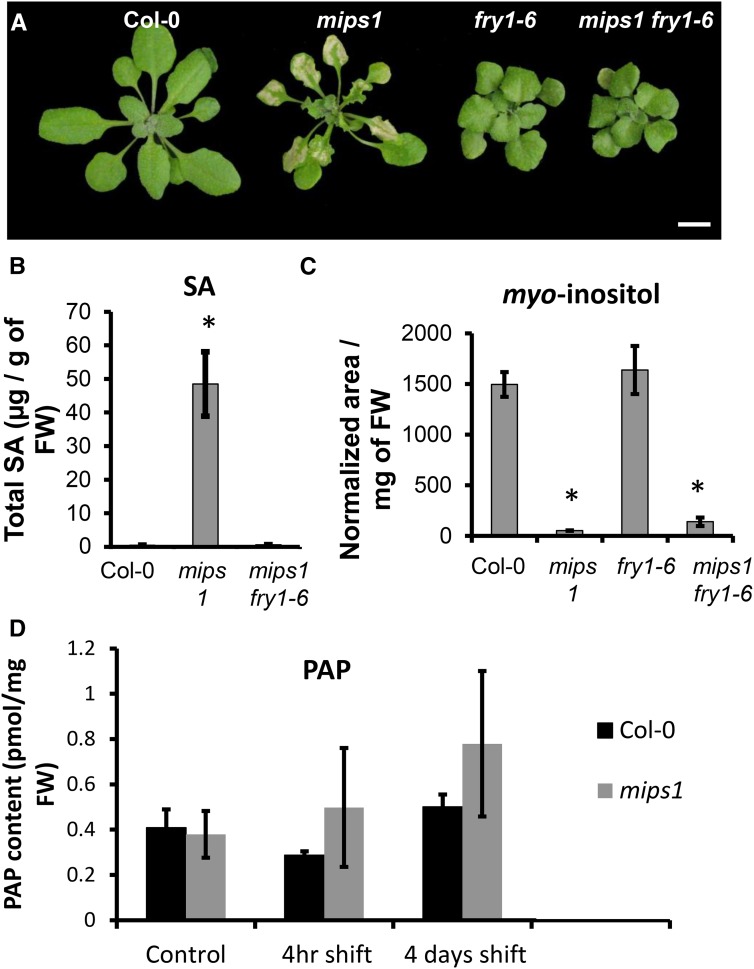
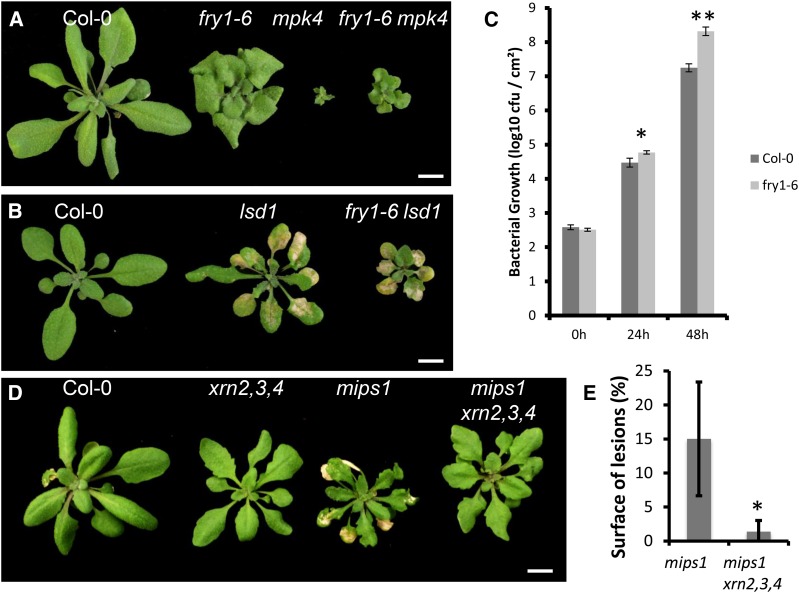
Programmed cell death (PCD) is a crucial process both for plant development and responses to biotic and abiotic stress. There is accumulating evidence that chloroplasts may play a central role during plant PCD as for mitochondria in animal cells, but it is still unclear whether they participate in PCD onset, execution, or both. To tackle this question, we have analyzed the contribution of chloroplast function to the cell death phenotype of the myoinositol phosphate synthase1 (mips1) mutant that forms spontaneous lesions in a light-dependent manner. We show that photosynthetically active chloroplasts are required for PCD to occur in mips1, but this process is independent of the redox state of the chloroplast. Systematic genetic analyses with retrograde signaling mutants reveal that 3'-phosphoadenosine 5'-phosphate, a chloroplast retrograde signal that modulates nuclear gene expression in response to stress, can inhibit cell death and compromises plant innate immunity via inhibition of the RNA-processing 5'-3' exoribonucleases. Our results provide evidence for the role of chloroplast-derived signal and RNA metabolism in the control of cell death and biotic stress response.


Figures

Figure 1.
Figure 1.
somi3 harbors a mutation in the PCB2 gene. A, Suppression of the cell death phenotype in the mips1 somi3 mutant obtained by ethyl methanesulfonate mutagenesis of the mips1 mutant. Plants were grown under SD for 2 weeks and transferred to LD for 6 d to induce lesion formation. Complementation of mips1 somi3 with a wild-type PCB2 cDNA restores lesion formation. B, Bulked segregants. Analysis allowed mapping of the somi3 mutation to the region between the CIW18 and ICE5 markers on chromosome 5. Shore map analysis revealed a single point mutation at position 84 of the PCB2 gene.
Figure 2.
Figure 2.
PCD in mips1 requires chlorophyll accumulation but is not mediated by EX-dependent singlet oxygen production. A, The cell death phenotype of mips1 is suppressed by the gun4 and gun5 mutations, which alter chlorophyll accumulation, but not by the gun1 mutation, which does not (Supplemental Fig. S1). The mips1-1 mutant in the Col-0 background was crossed to the gun1-1 and gun5-1 mutants, whereas the mips1-2 mutant, in the WS background, was crossed to the gun4-100 mutant. Double mutants were identified from the F2 generation. Bars = 1 cm. B, Lesion formation does not depend on EX-mediated singlet oxygen signaling: mips1 ex1 ex2 triple mutant forms lesions under LD like the mips1 mutant. Bars = 1 cm. C, Lesion quantification in mips1, mips1-2, and double mutants. Data are average ± sd from measurements performed on at least 12 plants using Image J software and are representative of two independent experiments. Asterisks indicate significantly different values (Student’s t test, P < 0.001).
Figure 3.
Figure 3.
Lesion formation depends on chloroplast metabolic activity rather than redox status. A, The phenotype of the mips1 mutant is enhanced in the lsd1 background. Bar = 1 cm. B, Lesion quantification in mips1, lsd1, and mips1 lsd1 mutants. We observed 4-fold increase in the relative surface of lesions in the double mutant compared with the parent lines. Data are average ± sd from measurements performed on at least 12 plants using Image J software and are representative of two independent experiments. Asterisks indicate significantly different values (Student’s t test, P < 0.001). C, The severity of the mips1 phenotype is enhanced by CO2 availability. Wild type (Col-0) and mips1 mutant were grown under ambient CO2 and SD conditions for 15 d, and then transferred to LD conditions under ambient, low (130 ppm), or high (3000 ppm) CO2 for 10 and 15 d, respectively. Bars = 1 cm. Under low CO2, lesion formation was completely suppressed, while it was more severe under high CO2. D, Growth under low CO2 partially restores MI and galactinol accumulation in mips1. Values are average ± sd of four biological replicates. Different letters indicate statistically significant differences (Student’s t test, P < 0.001).
Figure 4.
Figure 4.
ROI production is not enhanced in mips1. Wild-type and mutant plants were grown in SD for 15 d under SD conditions at low light intensity (60 µmol photons m−2 s−1), and then transferred to either SD with high light intensity (about 250 µmol photons m−2 s−1) to induce mild cell death or LD for 10 d. Global ROI production was measured in mature leaves with and without lesions by EPR as described in “Materials and Methods” on whole leaves, and EPR/leaf fresh weight ratios were calculated. Values are average ± sd obtained on three biological replicates. Different letters indicate statistically significant differences (Student t test, P < 0.05).
Figure 5.
Figure 5.
Lesion formation is suppressed by the fry1-6 mutation. A, The phenotype of the mips1 mutant is rescued by the fry1-6 mutation. Wild type (Col-0), mips1, fry1-6, and mips1 fry1-6 double mutants were grown under SD for 15 d and transferred to LD for 10 d. Bar = 1 cm. B, SA accumulation upon transfer to LD conditions is suppressed in the mips1 fry1-6 mutant. SA accumulation was measured 4 d after transfer to LD conditions. Values are average ± sd obtained on four biological replicates. Asterisks indicate statistically significant differences from the control (Student’s t test, P < 0.001). C, MI accumulation is not restored in the mips1 fry1-6 double mutant. Values are average ± sd from four biological replicates. Asterisks indicate statistically significant differences from the control (Student’s t test, P < 0.001). D, PAP content in the wild type (Col-0) and mips1 4 h and 4 d after transfer to LD conditions. Controls are plants kept under SD conditions. Values are average ± sd obtained from three biological replicates.
Figure 6.
Figure 6.
PAP signaling is not a general suppressor of cell death but a negative regulator of defense response. A, The phenotype of the mpk4 mutant is partially rescued by the fry1-6 mutation. Plants were grown under SD for 2 weeks and transferred to LD for 15 d. Bars = 1 cm. B, The phenotype of the lsd1 mutant is not modified in the fry1-6 background. Plants were grown under SD for 2 weeks and transferred to LD for 7 d. Bars = 1 cm. C, Twenty-eight-day-old Col-0 and fry1-6 plants were grown in SD and infiltrated with a suspension of P. syringae pv tomato DC3000, and bacterial growth was followed for 2 d. The number of colony forming units (cfu) was already significantly higher in fry1-6 than in the wild type (Col-0) 24 h after inoculation, and this difference became more obvious after 48 h. Asterisks indicate significantly different values (Wilcoxon signed-rank test, * P < 0.01, ** P < 0.001). Data are average ± sd from five biological replicates and are representative of two independent experiments. D, Suppression of cell death in mips1 fry1-6 can be reproduced in XRN-deficient mutants. The mips1 mutant was crossed with the xrn2-2 xrn3-3 xrn4-1 triple mutants, and quadruple mutants were selected from the F3 generation. Lesion formation in the quadruple mutant was drastically reduced, while plant growth was restored. Plants were grown under SD for 2 weeks and transferred to LD for 15 d. Bars = 1 cm. E, Lesion quantification in mips1 and mips1 xrn2-2 xrn3-3 xrn4-1 quadruple mutants. Values are average ± sd (n = 12) and are representative of two independent experiments. The relative surface of lesions was significantly reduced in mips1 xrn2 xrn3 xrn4 quadruple mutants (Student’s t test, P < 0.001).

References

    1. Alonso JM, Stepanova AN, Leisse TJ, Kim CJ, Chen H, Shinn P, Stevenson DK, Zimmerman J, Barajas P, Cheuk R, et al. (2003) Genome-wide insertional mutagenesis of Arabidopsis thaliana. Science 301: 653–657 - PubMed
    1. Aviv DH, Rustérucci C, Holt BF III, Dietrich RA, Parker JE, Dangl JL (2002) Runaway cell death, but not basal disease resistance, in lsd1 is SA- and NIM1/NPR1-dependent. Plant J 29: 381–391 - PubMed
    1. Bednarek P, Pislewska-Bednarek M, Svatos A, Schneider B, Doubsky J, Mansurova M, Humphry M, Consonni C, Panstruga R, Sanchez-Vallet A, et al. (2009) A glucosinolate metabolism pathway in living plant cells mediates broad-spectrum antifungal defense. Science 323: 101–106 - PubMed
    1. Bruggeman Q, Garmier M, de Bont L, Soubigou-Taconnat L, Mazubert C, Benhamed M, Raynaud C, Bergounioux C, Delarue M (2014) The polyadenylation factor subunit CLEAVAGE AND POLYADENYLATION SPECIFICITY FACTOR30: a key factor of programmed cell death and a regulator of immunity in Arabidopsis. Plant Physiol 165: 732–746 - PMC - PubMed
    1. Bruggeman Q, Prunier F, Mazubert C, de Bont L, Garmier M, Lugan R, Benhamed M, Bergounioux C, Raynaud C, Delarue M (2015a) Involvement of Arabidopsis Hexokinase1 in cell death mediated by myo-inositol accumulation. Plant Cell 27: 1801–1814 - PMC - PubMed

Publication types

MeSH terms

Substances

LinkOut - more resources