Meta-Analysis
. 2016 Mar;29(3):209-225.e6.
doi: 10.1016/j.echo.2015.11.016. Epub 2015 Dec 30.

Reference Ranges of Left Ventricular Strain Measures by Two-Dimensional Speckle-Tracking Echocardiography in Children: A Systematic Review and Meta-Analysis

Affiliations
Meta-Analysis

Reference Ranges of Left Ventricular Strain Measures by Two-Dimensional Speckle-Tracking Echocardiography in Children: A Systematic Review and Meta-Analysis

Philip T Levy et al. J Am Soc Echocardiogr. 2016 Mar.

Abstract

Background: Establishment of the range of reference values and associated variations of two-dimensional speckle-tracking echocardiography (2DSTE)-derived left ventricular (LV) strain is a prerequisite for its routine clinical adoption in pediatrics. The aims of this study were to perform a meta-analysis of normal ranges of LV global longitudinal strain (GLS), global circumferential strain (GCS), and global radial strain (GRS) measurements derived by 2DSTE in children and to identify confounding factors that may contribute to variance in reported measures.

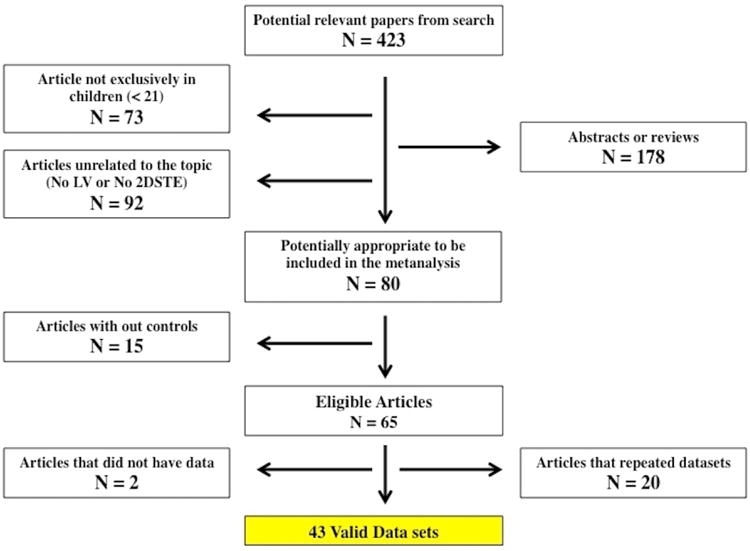
Methods: A systematic review was launched in MEDLINE, Embase, Scopus, the Cumulative Index to Nursing and Allied Health Literature, and the Cochrane Library. Search hedges were created to cover the concepts of pediatrics, STE, and left-heart ventricle. Two investigators independently identified and included studies if they reported 2DSTE-derived LV GLS, GCS, or GRS. The weighted mean was estimated by using random effects models with 95% CIs, heterogeneity was assessed using the Cochran Q statistic and the inconsistency index (I(2)), and publication bias was evaluated using the Egger test. Effects of demographic (age), clinical, and vendor variables were assessed in a metaregression.

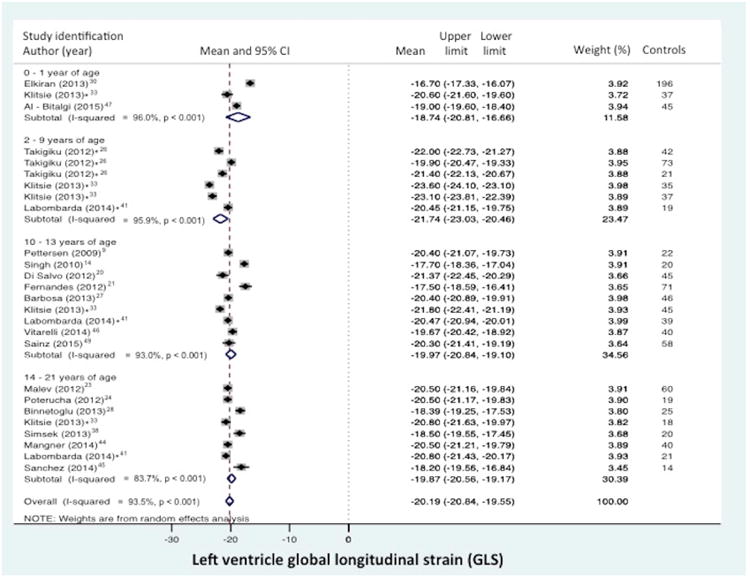
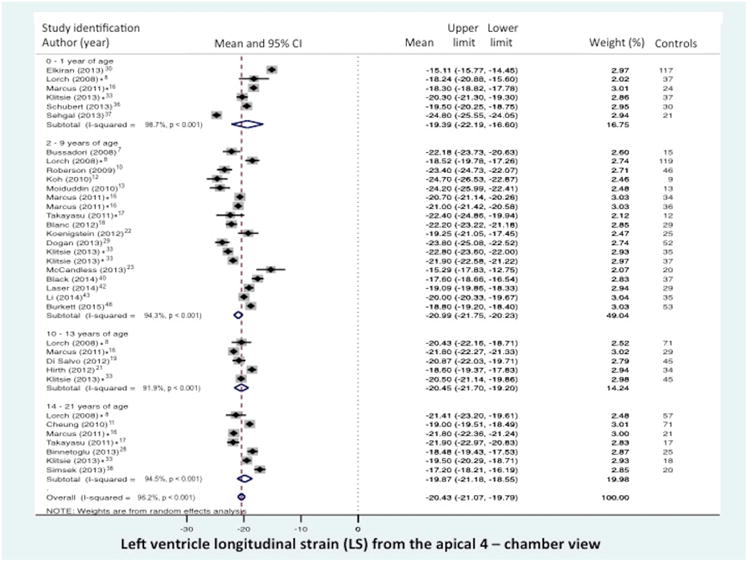
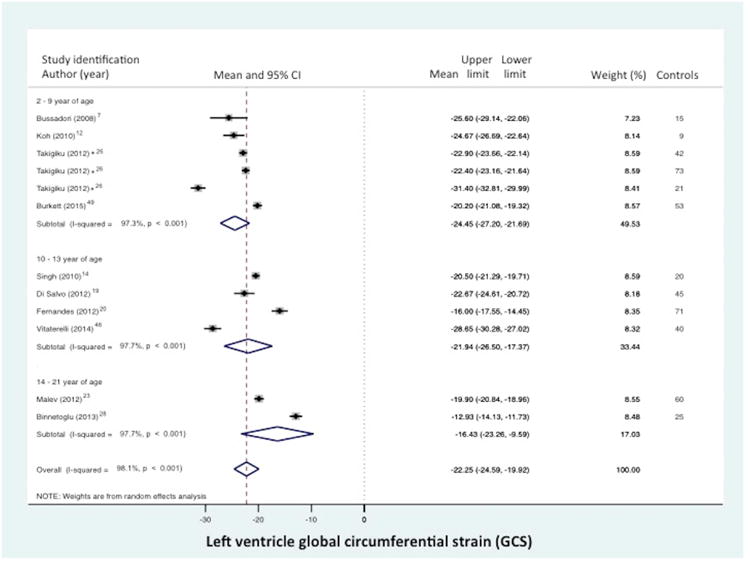
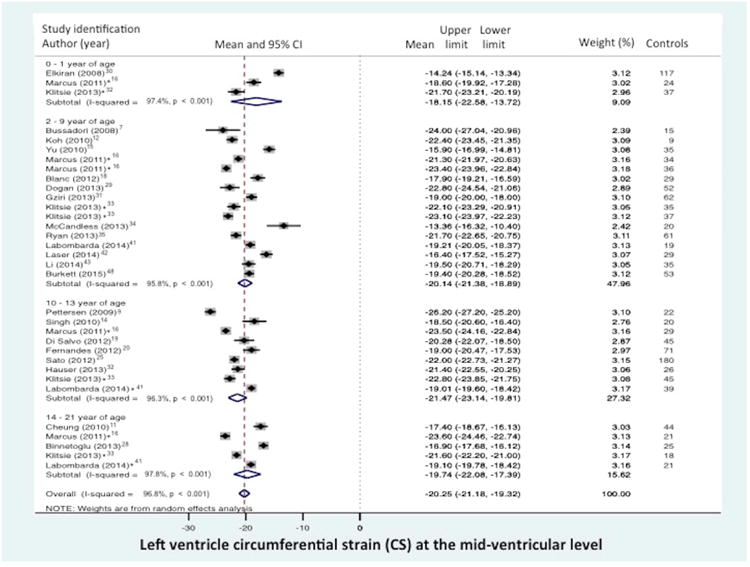
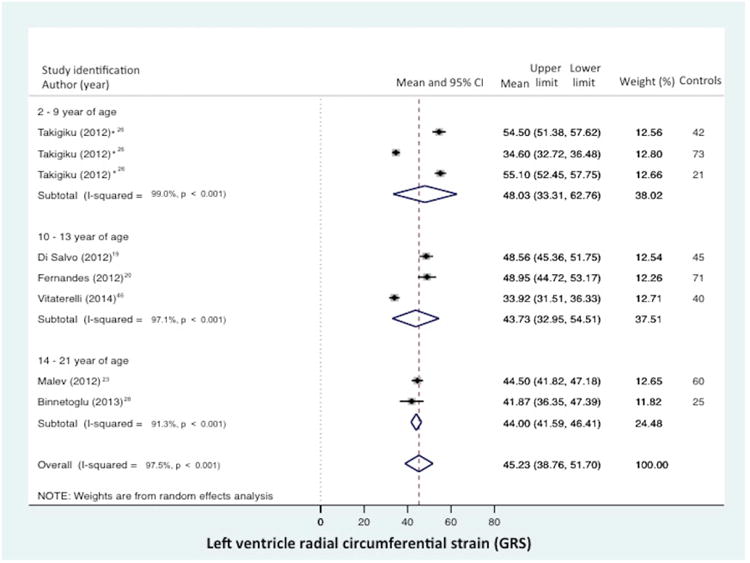
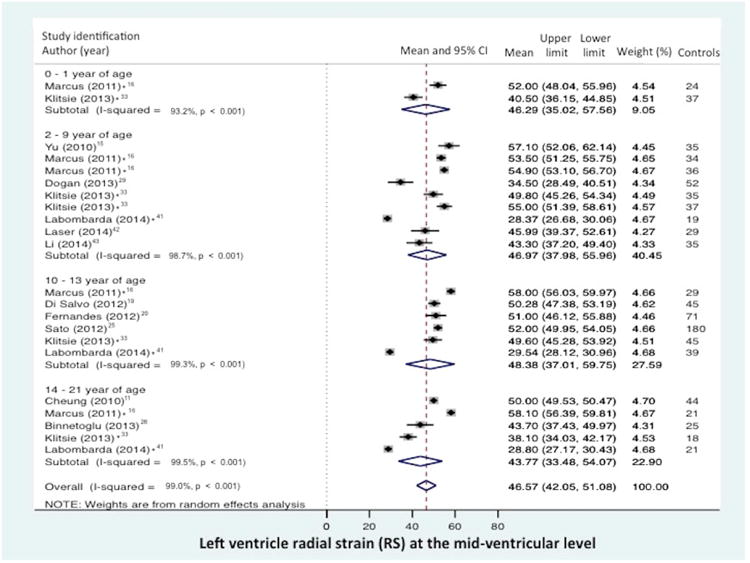
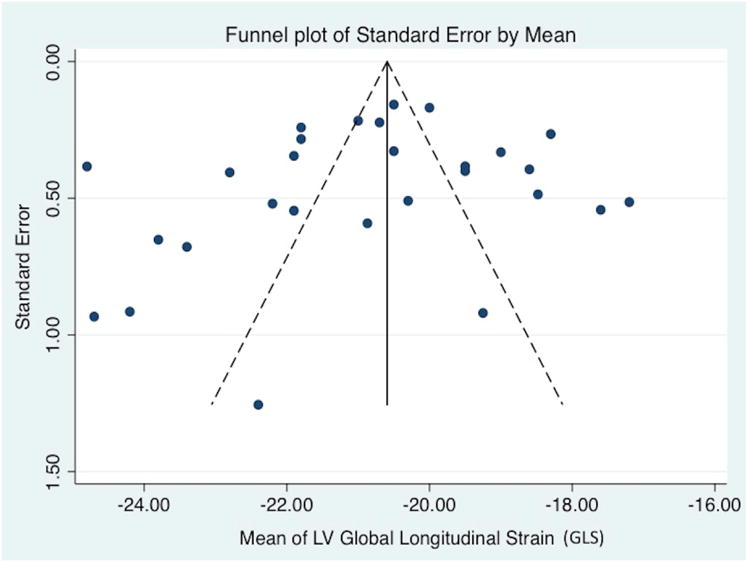
Results: The search identified 2,325 children from 43 data sets. The reported normal mean values of GLS among the studies varied from -16.7% to -23.6% (mean, -20.2%; 95% CI, -19.5% to -20.8%), GCS varied from -12.9% to -31.4% (mean, -22.3%; 95% CI, -19.9% to -24.6%), and GRS varied from 33.9% to 54.5% (mean, 45.2%; 95% CI, 38.3% to 51.7%). Twenty-six studies reported longitudinal strain only from the apical four-chamber view, with a mean of -20.4% (95% CI, -19.8% to -21.7%). Twenty-three studies reported circumferential strain (mean, -20.3%; 95% CI, -19.4% to -21.2%) and radial strain (mean, 46.7%; 95% CI, 42.3% to 51.1%) from the short-axis view at the midventricular level. A significant apex-to-base segmental longitudinal strain gradient (P < .01) was observed in the LV free wall. There was significant between-study heterogeneity and inconsistency (I(2) > 94% and P < .001 for each strain measure), which was not explained by age, gender, body surface area, blood pressure, heart rate, frame rate, frame rate/heart rate ratio, tissue-tracking methodology, location of reported strain value along the strain curve, ultrasound equipment, or software. The metaregression showed that these effects were not significant determinants of variations among normal ranges of strain values. There was no evidence of publication bias (P = .40).

Conclusions: This study defines reference values of 2DSTE-derived LV strain in children on the basis of a meta-analysis. In healthy children, mean LV GLS was -20.2% (95% CI, -19.5% to -20.8%), mean GCS was -22.3% (95% CI, -19.9% to -24.6%), and mean GRS was 45.2% (95% CI, 38.3% to 51.7%). LV segmental longitudinal strain has a stable apex-to-base gradient that is preserved throughout maturation. Although variations among different reference ranges in this meta-analysis were not dependent on differences in demographic, clinical, or vendor parameters, age- and vendor-specific referenced ranges were established as well.

Keywords: Cardiac function; Children; Global strain; Left ventricle; Speckle-tracking echocardiography.


Figures

Figure 1
Figure 1. Process of inclusion of studies in the meta-analysis
Figure 2
Figure 2
Normal value of LV global longitudinal strain (GLS) stratified by age distribution and view. (A) LV “global” LS derived from the segmental averaging of the three apical views and (B) LV LS from the apical 4-chamber view only. The forest plot lists the names of the included studies by age distribution and in chronological order, the mean and confidence intervals with the upper (95%) and lower (5%) limits. Each study is represented by a square that reflects the mean at the point estimate of effect and is proportional to the study's weight in the meta-analysis. A horizontal line extending from either side of the square reflects the 95% confidence interval. The overall meta-analysis measure of effect is plotted as a diamond with the lateral points of the diamond indicating confidence intervals for this mean estimate. *Klitsie et al., Labombarda et al., Lorch et al., Marcus et al., Takayasu et al., and Takigiku et al. all performed a cross-sectional study and reported strain values for multiple mean age groups from birth to 21 years of age.,,,,,
Figure 2
Figure 2
Normal value of LV global longitudinal strain (GLS) stratified by age distribution and view. (A) LV “global” LS derived from the segmental averaging of the three apical views and (B) LV LS from the apical 4-chamber view only. The forest plot lists the names of the included studies by age distribution and in chronological order, the mean and confidence intervals with the upper (95%) and lower (5%) limits. Each study is represented by a square that reflects the mean at the point estimate of effect and is proportional to the study's weight in the meta-analysis. A horizontal line extending from either side of the square reflects the 95% confidence interval. The overall meta-analysis measure of effect is plotted as a diamond with the lateral points of the diamond indicating confidence intervals for this mean estimate. *Klitsie et al., Labombarda et al., Lorch et al., Marcus et al., Takayasu et al., and Takigiku et al. all performed a cross-sectional study and reported strain values for multiple mean age groups from birth to 21 years of age.,,,,,
Figure 3
Figure 3
Normal value of LV global circumferential strain (GCS) stratified by age distribution and view. (A) LV “global” CS derived from the segmental averaging of the three short axis views at the base (mitral valve), mid-ventricular (papillary muscle), and apical levels views and (B) LV CS at the level of the papillary muscle only. The forest plot lists the names of the included studies by age distribution and in chronological order, the mean and confidence intervals with the upper (95%) and lower (5%) limits. Each study is represented by a square that reflects the mean at the point estimate of effect and is proportional to the study's weight in the meta-analysis. A horizontal line extending from either side of the square reflects the 95% confidence interval. The overall meta-analysis measure of effect is plotted as a diamond with the lateral points of the diamond indicating confidence intervals for this mean estimate. *Klitsie et al., Labombarda et al., Lorch et al., Marcus et al., Takayasu et al., and Takigiku et al. all performed a cross-sectional study and reported strain values for multiple mean age groups from birth to 21 years of age.,,,,,
Figure 3
Figure 3
Normal value of LV global circumferential strain (GCS) stratified by age distribution and view. (A) LV “global” CS derived from the segmental averaging of the three short axis views at the base (mitral valve), mid-ventricular (papillary muscle), and apical levels views and (B) LV CS at the level of the papillary muscle only. The forest plot lists the names of the included studies by age distribution and in chronological order, the mean and confidence intervals with the upper (95%) and lower (5%) limits. Each study is represented by a square that reflects the mean at the point estimate of effect and is proportional to the study's weight in the meta-analysis. A horizontal line extending from either side of the square reflects the 95% confidence interval. The overall meta-analysis measure of effect is plotted as a diamond with the lateral points of the diamond indicating confidence intervals for this mean estimate. *Klitsie et al., Labombarda et al., Lorch et al., Marcus et al., Takayasu et al., and Takigiku et al. all performed a cross-sectional study and reported strain values for multiple mean age groups from birth to 21 years of age.,,,,,
Figure 4
Figure 4
Normal value of LV global radial strain (GRS) stratified by age distribution and view. (A) LV “global” RS derived from the segmental averaging of the three short axis views at the base (mitral valve), mid-ventricular (papillary muscle), and apical levels views and (B) LV RSat the level of the papillary muscle only. The forest plot lists the names of the included studies by age distribution and in chronological order, the mean and confidence intervals with the upper (95%) and lower (5%) limits. Each study is represented by a square that reflects the mean at the point estimate of effect and is proportional to the study's weight in the meta-analysis. A horizontal line extending from either side of the square reflects the 95% confidence interval. The overall meta-analysis measure of effect is plotted as a diamond with the lateral points of the diamond indicating confidence intervals for this mean estimate. *Klitsie et al., Labombarda et al., Lorch et al., Marcus et al., Takayasu et al., and Takigiku et al. all performed a cross-sectional study and reported strain values for multiple mean age groups from birth to 21 years of age.,,,,,
Figure 4
Figure 4
Normal value of LV global radial strain (GRS) stratified by age distribution and view. (A) LV “global” RS derived from the segmental averaging of the three short axis views at the base (mitral valve), mid-ventricular (papillary muscle), and apical levels views and (B) LV RSat the level of the papillary muscle only. The forest plot lists the names of the included studies by age distribution and in chronological order, the mean and confidence intervals with the upper (95%) and lower (5%) limits. Each study is represented by a square that reflects the mean at the point estimate of effect and is proportional to the study's weight in the meta-analysis. A horizontal line extending from either side of the square reflects the 95% confidence interval. The overall meta-analysis measure of effect is plotted as a diamond with the lateral points of the diamond indicating confidence intervals for this mean estimate. *Klitsie et al., Labombarda et al., Lorch et al., Marcus et al., Takayasu et al., and Takigiku et al. all performed a cross-sectional study and reported strain values for multiple mean age groups from birth to 21 years of age.,,,,,
Figure 5
Figure 5
Publication bias. Funnel plot for studies of left ventricle global longitudinal strain. The standard error of the effect estimate is plotted on the vertical axis. The mean of the LV GLS is plotted on the horizontal axis. Visual inspection shows symmetry in the distribution of the studies that suggests the absence of publication bias (P=0.40 from the Egger test for statistical funnel plot symmetry.

Comment in

References

    1. Yingchoncharoen T, Agarwal S, Popovic ZB, Marwick TH. Normal ranges of left ventricular strain: a meta-analysis. J Am Soc Echocardiogr. 2013;26:185–91. - PubMed
    1. Geyer H, Caracciolo G, Abe H, Wilansky S, Carerj S, Gentile F, et al. Assessment of myocardial mechanics using speckle tracking echocardiography: fundamentals and clinical applications. J Am Soc Echocardiogr. 2010;23:351–69. - PubMed
    1. Farsalinos KE, Daraban AM, Ünlü S, Thomas JD, Badano LP, Voigt JU. Head-to-Head Comparison of Global Longitudinal Strain Measurements among Nine Different Vendors. J Am Soc Echocardiogr. 2015;28:1171–81. - PubMed
    1. Greenbaum RA, Ho SY, Gibson DG, Becker AE, Anderson RH. Left ventricular fibre architecture in man. Br Heart J. 1981;45:248–63. - PMC - PubMed
    1. Streeter DDJ, Spotnitz HM, Patel DP, Ross JJ, Sonnenblick EH. Fiber orientation in the canine left ventricle during diastole and systole. Circulation Research. 1969;24:339–47. - PubMed

Publication types

MeSH terms