. 2016 Mar;14(3):267-77.
doi: 10.1158/1541-7786.MCR-15-0456. Epub 2016 Jan 8.

Transcriptional Regulation of miR-31 by Oncogenic KRAS Mediates Metastatic Phenotypes by Repressing RASA1

Affiliations

Transcriptional Regulation of miR-31 by Oncogenic KRAS Mediates Metastatic Phenotypes by Repressing RASA1

Oliver A Kent et al. Mol Cancer Res. 2016 Mar.

Abstract

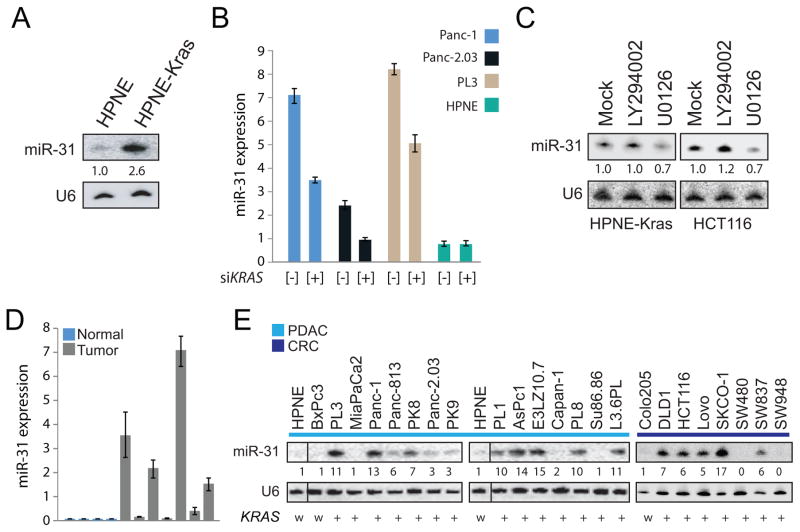
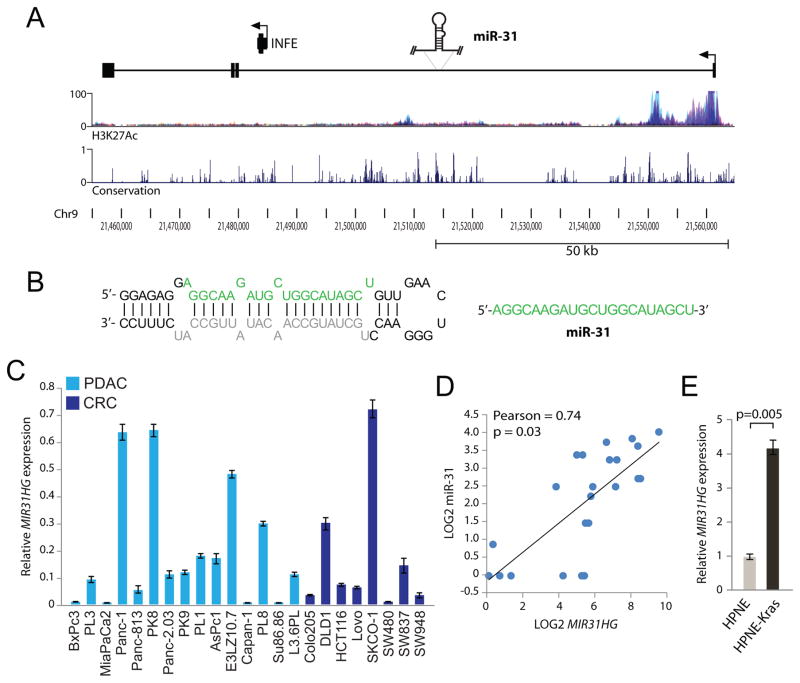
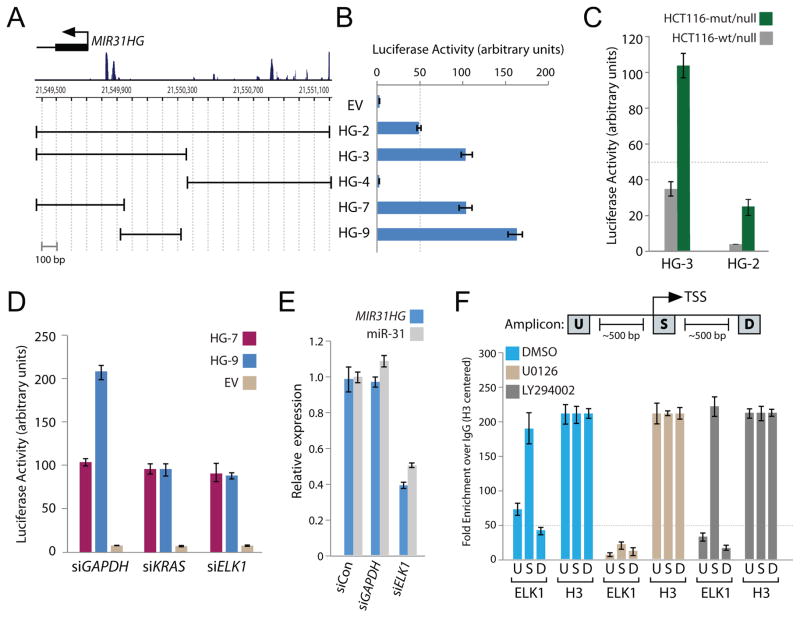
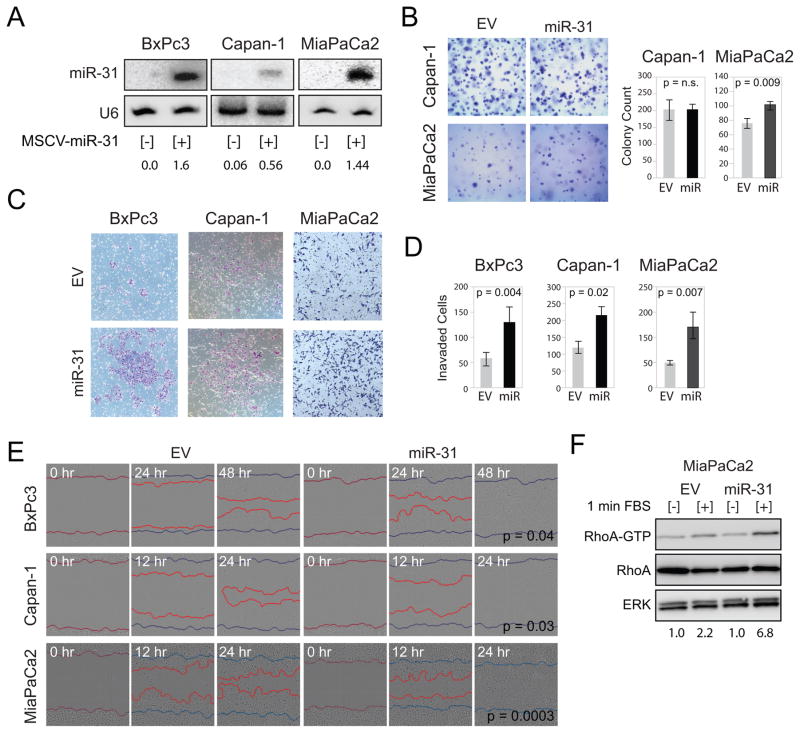
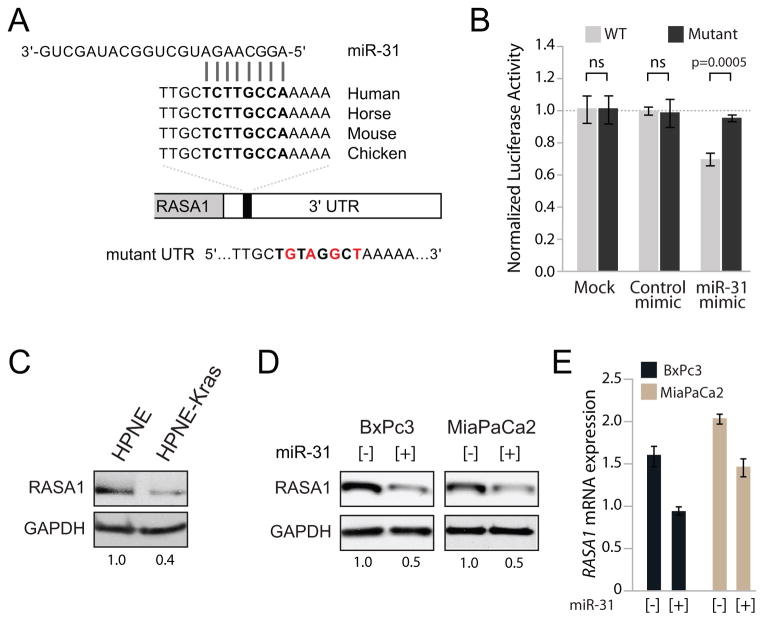
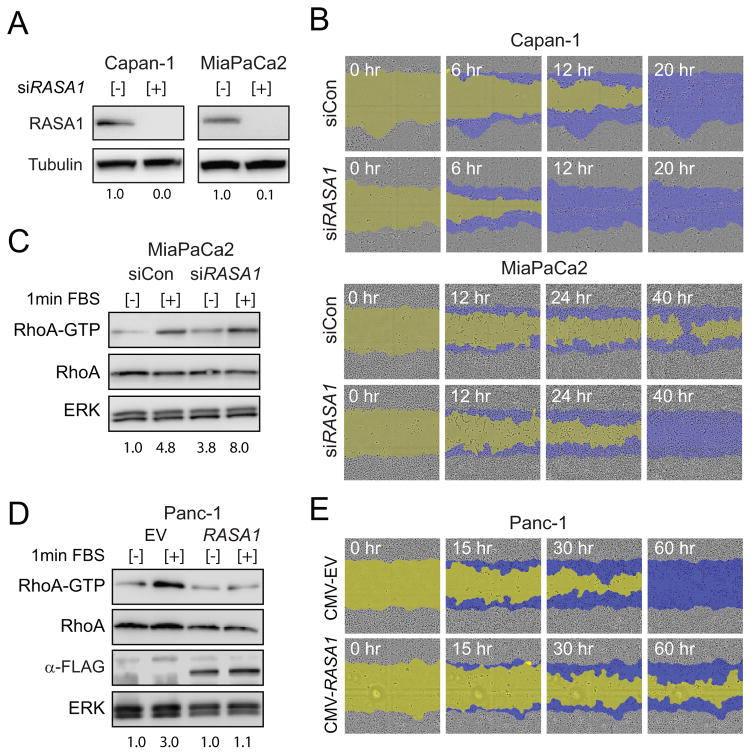
Activating KRAS mutations are nearly ubiquitous in pancreatic cancer occurring in more than 95% of clinical cases. miRNAs are small noncoding RNAs that regulate gene expression by binding sequences within the 3'UTRs of target mRNAs. An integral role for miRNAs in cancer pathogenesis is well established; however, the role of miRNAs in KRAS-mediated tumorigenesis is poorly characterized. Here it is demonstrated that expression of miR-31 is coupled to the expression of oncogenic KRAS and activity of the MAPK pathway. miR-31 is highly expressed in patient-derived xenografts and a panel of pancreatic and colorectal cancer cells harboring activating KRAS mutations. The miR-31 host gene is a large noncoding RNA that correlates with miR-31 expression and enabled identification of the putative miR-31 promoter. Using luciferase reporters, a minimal RAS-responsive miR-31 promoter was found to drive robust luciferase activity dependent on expression of mutant KRAS and the transcription factor ELK1. Furthermore, ELK1 interacts directly with the endogenous miR-31 promoter in a MAPK-dependent manner. Expression of enforced miR-31 significantly enhanced invasion and migration of multiple pancreatic cancer cells resulting from the activation of RhoA through regulation of the miR-31 target gene RASA1. Importantly, acute knockdown of RASA1 phenocopied enforced miR-31 expression on the migratory behavior of pancreatic cancer cells through increased RhoA activation.

Implications: Oncogenic KRAS can activate Rho through the miR-31-mediated regulation of RASA1 indicating miR-31 acts as a KRAS effector to modulate invasion and migration in pancreatic cancer.


Conflict of interest statement

Conflict of Interest: The authors declare no conflict of interest.

Figures

Figure 1
Figure 1
miR-31 is a target of oncogenic KRAS and the MAPK pathway and is highly expressed in many pancreatic and colorectal cancer cell lines. A, northern blot analysis of miR-31 expression in RNA isolated from HPNE and HPNE-KRAS(G12D) cells. U6 for this and subsequent northern blots served as a loading control. The fold change indicated. B, taqman qPCR analysis of miR-31 expression in the indicated cell lines transfected with siRNA control [−] or siRNA against KRAS [+]. Expression was normalized to U6 RNA. C, northern blot analysis of miR-31 expression in HPNE-KRAS and HCT116 cells treated with DMSO control (mock) or small molecule inhibitors against PI3K (LY294002) or MEK1/2 (U0126). D, taqman qPCR analysis of miR-31 expression normal pancreas and patient derived xenografts. Expression was normalized to U6 RNA. E, northern blot analysis of miR-31 expression in a panel of pancreatic (light blue bar, PDAC) and colorectal (dark blue bar, CRC) cancer cell lines. KRAS mutational status of each cell line is indicated as wild-type (w) or mutant (+).
Figure 2
Figure 2
miR-31 is an intronic miRNA contained in a large non-coding primary transcript. A, structure of the human miR-31 primary transcript (MIR31HG). The plots depicted below the transcript show the layered H3K27Ac marks and the evolutionary conservation (UCSC Genome Browser 28 species conservation track, NCBI36/hg18 assembly). The INFE (interferon epsilon) gene is also contained in this region under regulation of its own promoter. The transcription start site (TSS) is indicated with an arrow. B, the proposed secondary structure of the pre-miR-31 stem loop. The mature miRNA sequence green (miR-31) and the miRNA-star sequence grey. C, quantitative PCR analysis of MIR31HG expression in the panel of pancreatic (light blue bars, PDAC) and colorectal (dark blue bars, CRC) cancer cell lines described in Figure 1E. D, dot plot analysis of LOG2 transformed mature miR-31 expression (x-axis) and MIR31HG expression (y-axis) from the panel of PDAC and CRC cell lines. The Pearson correlation and p-value (two-tailed t-test) are indicated. E, quantitative PCR analysis of MIR31HG expression in HPNE and HPNE-KRAS(G12D) cells.
Figure 3
Figure 3
The miR-31 proximal promoter is transactivated by oncogenic KRAS through the ELK1 transcription factor. A, the genomic region around the transcription start site (TSS) of MIR31HG. Boundaries of the MIR31HG promoter constructs cloned into pGL3-basic luciferase reporter vector are shown relative to the TSS. B, normalized luciferase activity generated from the indicated MIR31HG promoter (HG) transfected in Panc-1 cells. Luciferase activity was normalized to renilla expression and data is represented as fold change over cells expressing pGL3-promoterless empty vector (EV). Error bars in this and subsequent experiments represent standard deviations from three independent transfections each measured in triplicate. C, normalized luciferase activity from HG-2 and HG-3 promoter constructs in the indicated isogenic HCT116 cell lines. D, empty vector (EV) normalized luciferase activity from the HG-7 and HG-9 promoter constructs in Panc-1 cells pretreated with control siRNA (siGAPDH) or siRNA targeting KRAS (siKRAS) or ELK1 (siELK1). E, quantitative PCR analysis of MIR31HG and mature miR-31 expression in Panc-1 cells transfected with control siRNAs (siCon or siGAPDH) or siRNA targeting ELK1 (siELK1). F, quantitative PCR amplicons for ChIP were designed within approximately 100-bp windows at the TSS (amplicon S), 500-bp upstream of amplicon S (amplicon U), or 500-bp downstream of amplicon S (amplicon D). Quantitative PCR analysis of chromatin immunoprecipitates from Panc-1 cells treated with DMSO, U0126 or LY294002 and immunoprecipitated with antibodies recognizing ELK1 or histone H3. Fold enrichment represents the signal obtained after immunoprecipitation with a non-specific IgG antibody. Fold enrichment for each amplicon was centered to the signal obtained for histone H3. The 50-fold enrichment threshold for positive transcription factor binding is indicated as a dashed line. Data are mean ± s.d. from three independent measurements.
Figure 4
Figure 4
Enforced expression of miR-31 in pancreatic cancer cell lines enhanced invasion and migration. A, northern blot analysis of miR-31 expression in pancreatic cancer cell lines stably infected with MSCV-empty vector [−] or MSCV-miR-31 [+]. Taqman quantified expression of enforced miR-31 is shown for each cell line relative to the expression of endogenous miR-31 measured in HPNE-KRAS cells (see Supplemental Fig 3). B, representative images of Capan-1 and MiaPaCa2 cells infected with MSCV-empty vector (EV) or MSCV-miR-31 (miR-31) grown for 7 days in 0.3% agar to form colonies. Bar graphs average colony counts from 8 representative images. P-values are indicated. C, invasion of the indicated cell lines with MSCV-empty vector (EV) or MSCV-miR-31 (miR-31) through matrigel coated transwells. D, bar graphs average the number of invaded cells from 5 independent experiments. P-values are indicated. E, scratch wound analysis of the indicated cell lines with MSCV-empty vector (EV) or MSCV-miR-31 (miR-31) monitored over the indicated time course. Images from Essen IncuCyte ZOOM. Blue lines mark the starting wound boundary and the red lines mark the cell front moving into the wound. P-values calculated from the difference in wound width between EV and miR-31 expressing cells 18 hours post scratch (n=8). F, lysates derived from MiaPaCa2 cells with MSCV-empty vector (EV) or MSCV-miR-31 (miR-31) were incubated with Rhotekin-Rho binding domain (RBD) protein beads with no stimulation [−] or following 1 minute stimulation with FBS [+]. Active RhoA-GTP and total cellular RhoA (total RhoA) were detected by immunoblotting with anti-RhoA antibody. Normalization of RhoA-GTP to total cellular RhoA for each experimental condition is indicated. ERK served as a protein loading control.
Figure 5
Figure 5
RASA1 is a target of miR-31 in PDAC cell lines. A, sequence and evolutionary conservation of the miR-31 binding site in the 3′-UTR of RASA1 transcript. Mutations introduced into the miR-31 binding site in the mutant luciferase reporter construct are shown in red. B, luciferase activity derived from the wild-type (WT) or mutant RASA1 3′-UTR reporter constructs transfected into MiaPaCa2 cells with transfection reagent alone (mock), control or miR-31 mimics. All values normalized to renilla produced from a co-transfected control plasmid. For each transfection condition, luciferase activity produced from the wild-type construct was normalized to the activity produced by the mutant construct. Error bars represent standard deviations from 3 independent transfections, each measured in triplicate. The p-value for significant experiment is indicated. C, western blot analysis of RASA1 expression in isogenic HPNE and HPNE-KRAS cells. GAPDH served as a protein loading control. D, western blot analysis and E, quantitative PCR analysis of RASA1 expression in BxPc3 and MiaPaCa2 cells with MSCV-empty vector [−] or MSCV-miR-31 [+]. GAPDH served as a protein loading control.
Figure 6
Figure 6
RASA1 negatively regulates migration in pancreatic cancer cells. A, western blot analysis of RASA1 expression in Capan-1 and MiaPaCa2 cells transfected with siRNA control [−] or siRNA targeting RASA1 [+]. Tubulin served as a protein loading control. B, scratch wound analysis of Capan-1 and MiaPaCa2 cell lines transfected with siRNA control (siCon) or siRNA targeting RASA1 (siRASA1) monitored at the indicated times. The initial scratch wound mask is colored yellow and the progression of cell migration is marked blue. C, lysates derived from indicated cells treated with siRNA control (siCon) or siRNA targeting RASA1 (siRASA1) were incubated with Rhotekin-Rho binding domain (RBD) protein beads with no stimulation [−] or following 1 minute stimulation with FBS [+]. Active RhoA-GTP and total cellular RhoA were detected by immunoblotting with anti-RhoA antibody. ERK served as a protein loading control. D, lysates derived from Panc-1 cells transfected with CMV-empty vector (EV) or CMV-flag-RASA1 (RASA1) were incubated with Rhotekin-Rho binding domain (RBD) protein beads with no stimulation [−] or following 1 minute stimulation with FBS [+] as described for panel C. Expression of flag-RASA1 confirmed with M2-anti-flag antibody. E, scratch wound analysis of Panc-1 cells transfected with CMV-empty vector (EV) or CMV-flag-RASA1 (CMV-RASA1) monitored at the indicated times. Color coding the same as panel B.

References

    1. Ambros V. The functions of animal microRNAs. Nature. 2004;431:350–355. - PubMed
    1. Bartel DP. MicroRNAs: genomics, biogenesis, mechanism, and function. Cell. 2004;116:281–297. - PubMed
    1. Mendell JT. miRiad roles for the miR-17-92 cluster in development and disease. Cell. 2008;133:217–222. - PMC - PubMed
    1. He L, He X, Lim LP, de Stanchina E, Xuan Z, Liang Y, et al. A microRNA component of the p53 tumour suppressor network. Nature. 2007;447:1130–1134. - PMC - PubMed
    1. Kent OA, Chivukula RR, Mullendore M, Wentzel EA, Feldmann G, Lee KH, et al. Repression of the miR-143/145 cluster by oncogenic RAS initiates a tumor-promoting feed-forward pathway. Genes & Dev. 2010;24:2754–2759. - PMC - PubMed

Publication types

MeSH terms