. 2016 Mar 15;473(6):743-55.
doi: 10.1042/BJ20150586. Epub 2016 Jan 8.

Loss of neutral ceramidase protects cells from nutrient- and energy -deprivation-induced cell death

Affiliations

Loss of neutral ceramidase protects cells from nutrient- and energy -deprivation-induced cell death

Kumaran Sundaram et al. Biochem J. .

Abstract

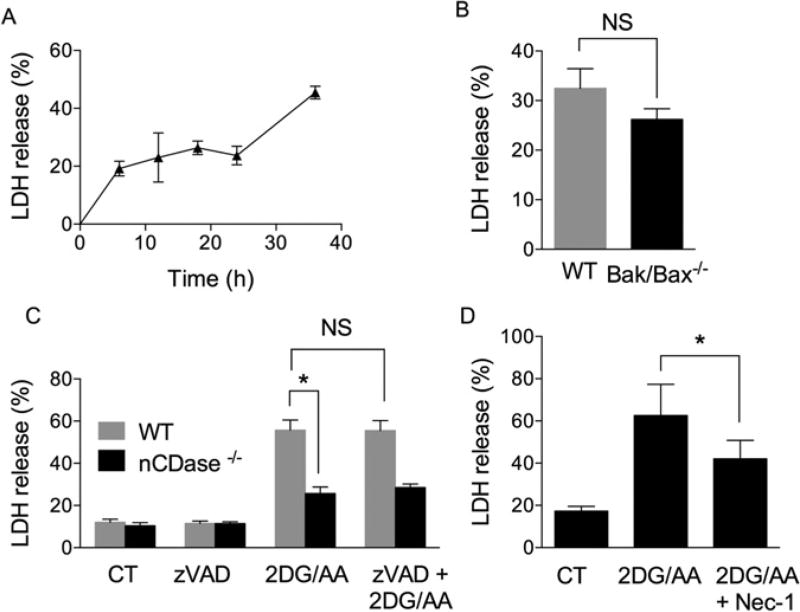
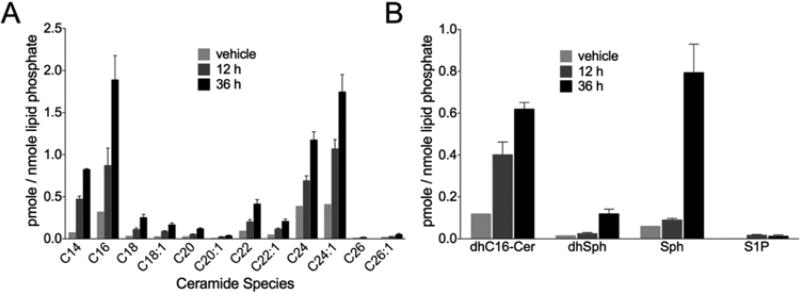
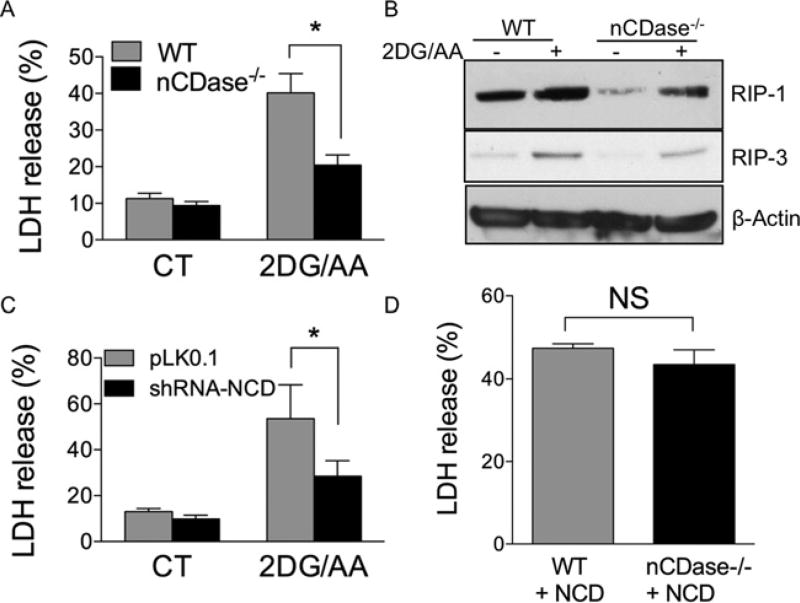
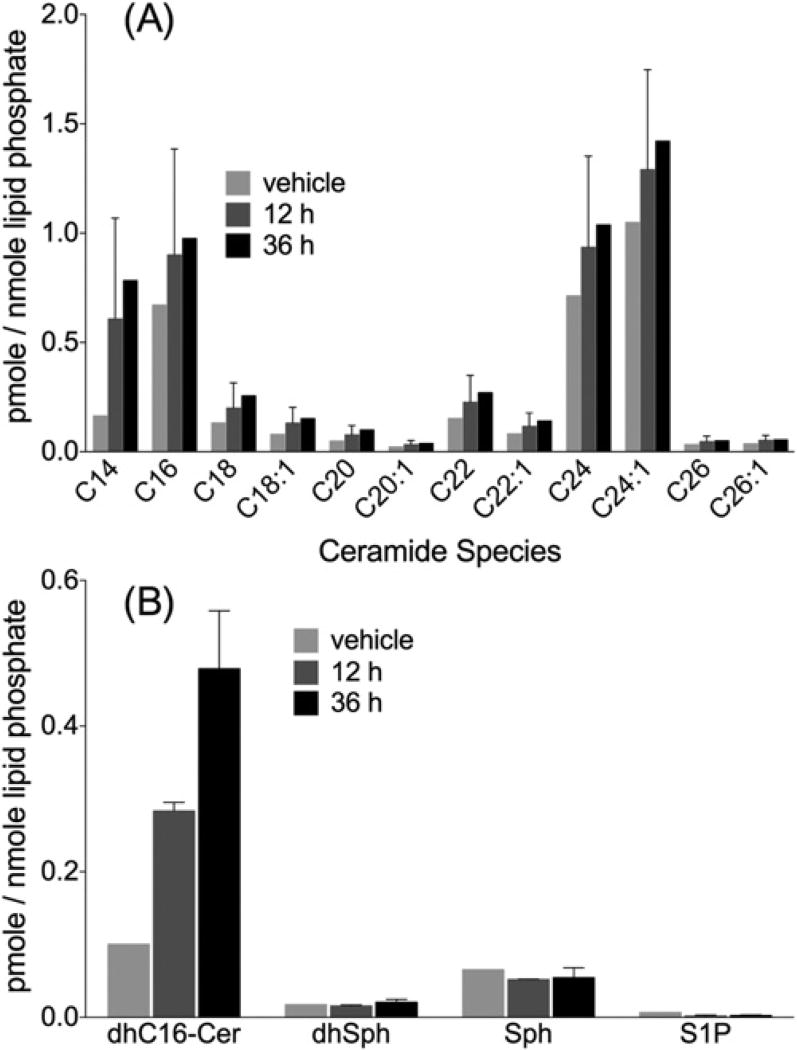
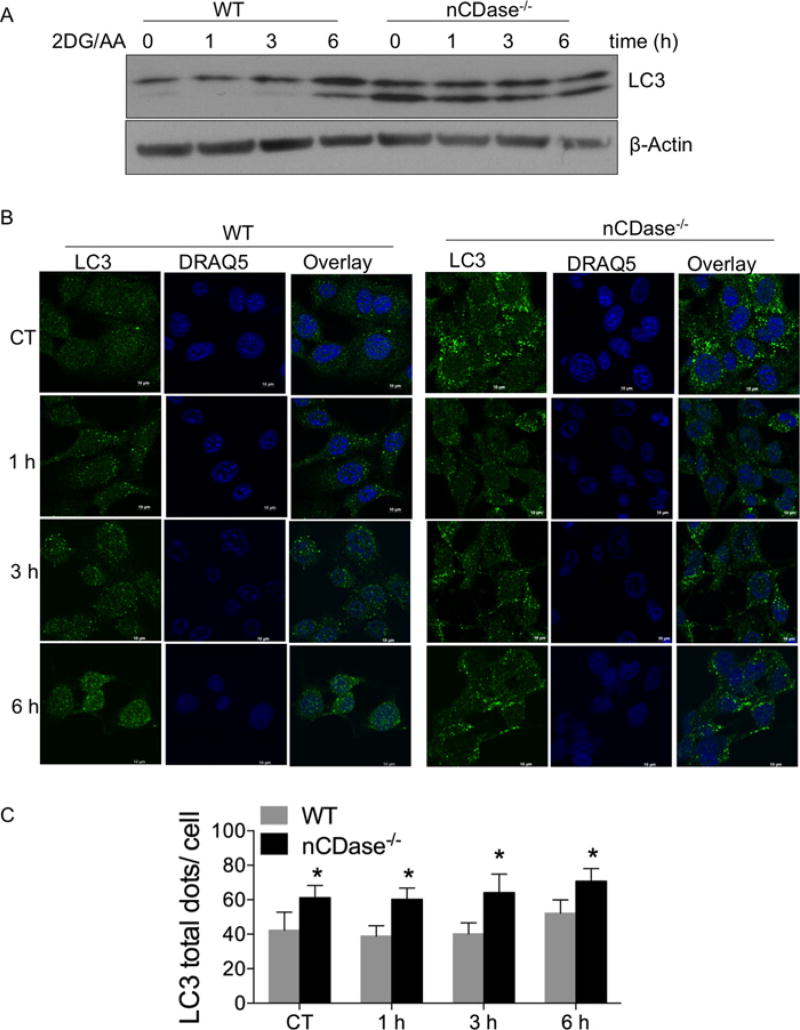
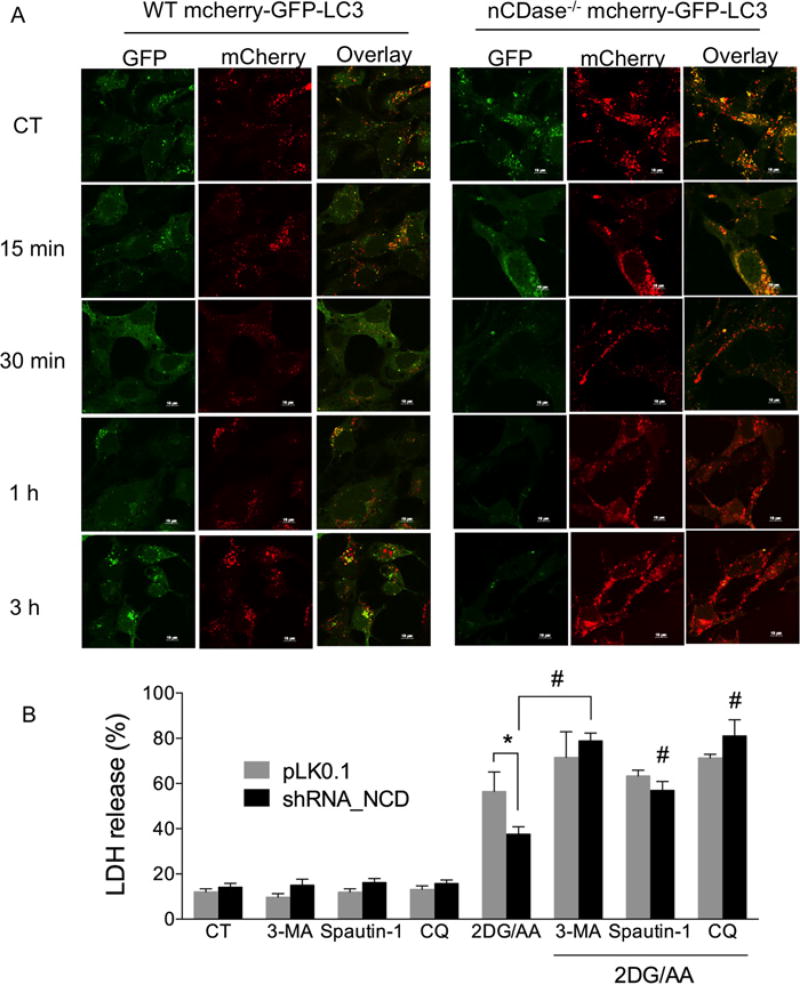
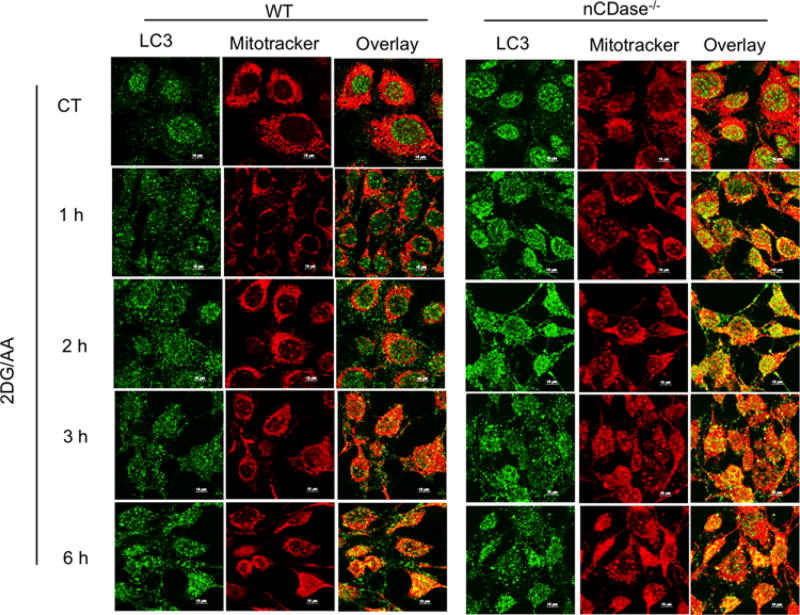
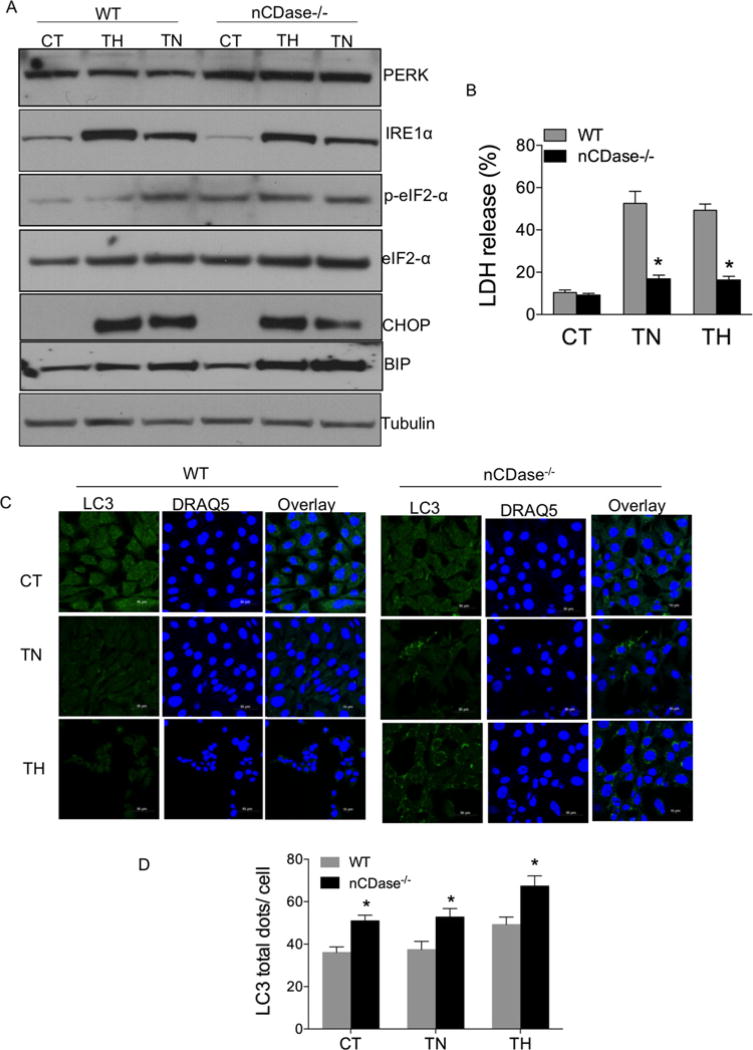
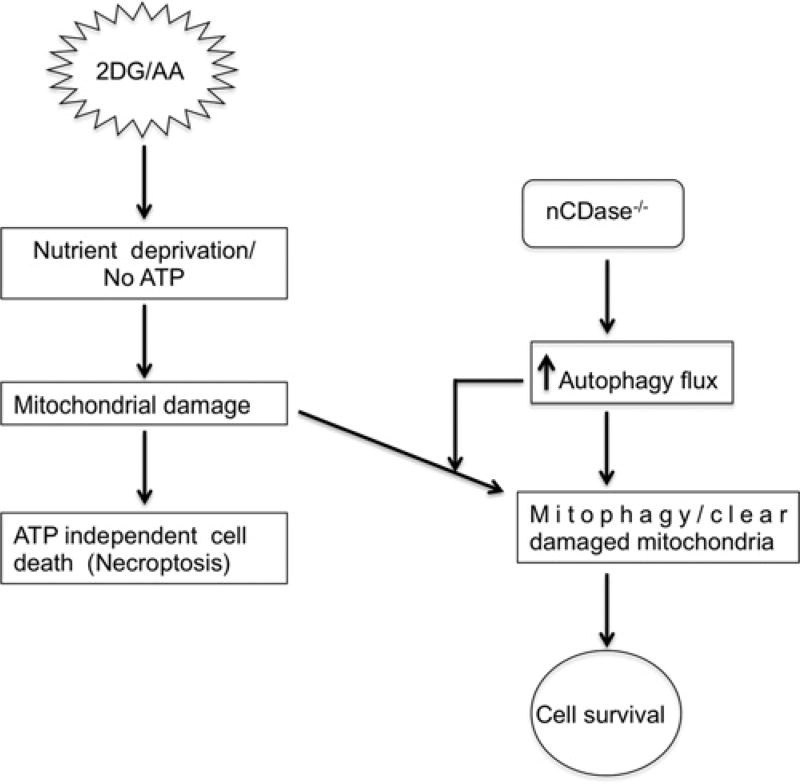
Sphingolipids are a family of lipids that regulate the cell cycle, differentiation and cell death. Sphingolipids are known to play a role in the induction of apoptosis, but a role for these lipids in necroptosis is largely unknown. Necroptosis is a programmed form of cell death that, unlike apoptosis, does not require ATP. Necroptosis can be induced under a variety of conditions, including nutrient deprivation and plays a major role in ischaemia/reperfusion injury to organs. Sphingolipids play a role in ischaemia/reperfusion injury in several organs. Thus, we hypothesized that sphingolipids mediate nutrient-deprivation-induced necroptosis. To address this, we utilized mouse embryonic fibroblast (MEFs) treated with 2-deoxyglucose (2DG) and antimycin A (AA) to inhibit glycolysis and mitochondrial electron transport. 2DG/AA treatment of MEFs induced necroptosis as it was receptor- interacting protein (RIP)-1/3 kinase-dependent and caspase-independent. Ceramides, sphingosine (Sph) and sphingosine 1-phosphate (S1P) were increased following 2DG/AA treatment. Cells lacking neutral ceramidase (nCDase(-/-)) were protected from 2DG/AA. Although nCDase(-/-) cells generated ceramides following 2DG/AA treatment, they did not generate Sph or S1P. This protection was stimulus-independent as nCDase(-/-) cells were also protected from endoplasmic reticulum (ER) stressors [tunicamycin (TN) or thapsigargin (TG)]. nCDase(-/-) MEFs had higher autophagic flux and mitophagy than wild-type (WT) MEFs and inhibition of autophagy sensitized them to necroptosis. These data indicate that loss of nCDase protects cells from nutrient- deprivation-induced necroptosis via autophagy, and clearance of damaged mitochondria. Results suggest that nCDase is a mediator of necroptosis and might be a novel therapeutic target for protection from ischaemic injury.

Keywords: autophagy flux; endoplasmic reticulum (ER) stress; mitophagy; necroptosis; neutral ceramidase; sphingolipids.


Figures

Figure 1
Figure 1. 2DG and AA treatment induces necroptotic cell death in MEFs
(A) MEFs were treated with vehicle (CT, control) or 2DG (20 mM) and AA (7.5 µM) for indicated times (0–36 h). The percentage of cell death was measured by LDH release. (B) WT and Bak/Bax−/− MEFs were treated with vehicle or 2DG/AA for 24 h followed by measurement of the percentage of LDH release. (C) WT MEFs were pre-treated with vehicle (CT) or the pan-caspase inhibitor zVAD-fmk (VAD) (10 µM) for 1 h followed by treatment with vehicle or 2DG/AA for 24 h. The percentage of LDH release was determined as described. (D) WT MEF cells were pre-treated with vehicle (CT) or Nec-1 for 3 h followed by treatment with either vehicle or 2DG/AA for 24 h. Cell death was evaluated by LDH release. The results are expressed as means ± S.D. for three independent experiments (*P < 0.05 as determined by Student’s t test or one-way ANOVA where appropriate). NS indicates not significant.
Figure 2
Figure 2. 2DG/AA increases ceramides, C16-dhCer and sphingoid bases in MEFs
WT MEFs were treated with vehicle or 2DG (20 mM) and AA (7.5 µM) for 12 or 36 h. Cells were harvested, lipids extracted and subjected to HPLC–MS/MS analysis for quantification. (A) Levels of the individual ceramide species (C14–C24). (B) Levels of C16-dhCer, dhSph, Sph and S1P. Results are normalized to lipid phosphate. Results are the means ± S.D., n = 3.
Figure 3
Figure 3. Cells lacking nCDase are resistant to 2DG/AA-induced necroptotic cell death
Percentage of LDH release from (A) WT or nCDase−/− MEFs treated with either vehicle (CT, control) or 2DG (20 mM) and AA (7.5 µM) for 24 h. (B) Western blot analysis of lysates from WT and nCDase−/− MEFs treated with vehicle (CT, control) or 2DG (20 mM) and AA (7.5µM) for 24 h. (C) Percentage of LDH release from non-targeting shRNA (pLK0.1) or shRNA-nCDase WT MEFs treated with vehicle (CT) or with 2DG (20 mM) and AA (7.5 µM) for 24 h. (D) WT and nCDase−/− MEFs stably overexpressing human nCDase treated with 2DG (20 mM) and AA (7.5µM) for 24 h. (A) Results are the means ± S.D. for three independent experiments each with technical duplicates. (B) A representative Western blot from an experiment performed on three independent occasions. (C and D) Results are expressed as means ± S.D. for two independent experiments each with technical triplicates. (*P < 0.05 as determined by Student’s t test or one-way ANOVA where appropriate). NS indicates not significant.
Figure 4
Figure 4. 2DG/AA treatment increases ceramides but not Sph or S1P in nCDase−/− MEFs
nCDase−/− MEFs were treated with vehicle or 2DG (20 mM) and AA (7.5 µm) for different times (0–36 h). Cells were harvested, lipids extracted and subjected to HPLC–MS/MS analysis for quantification of (A) the levels individual ceramide species (C14–C24) and (B) C16-dhCer, dhSph, Sph and S1P. Results were normalized to total lipid phosphate and are the means ± S.D., n = 3.
Figure 5
Figure 5. nCDase−/− cells have higher levels of autophagy following treatment with 2DG/AA
WT and nCDase−/− MEFs were treated with vehicle (CT, control) or 2DG (20 mM) and AA (7.5 µM) for different times. (A) Total cell lysates were subjected to Western blot analysis for LC3. β-Actin expression served as a loading control. (B) Cells were fixed and permeabilized. Cells were incubated with primary antibody directed against LC3 and appropriate fluorescently conjugated secondary antibody. DRAQ5 was utilized for nuclear staining. Cells were imaged via confocal microscopy. (C) Quantification of the total number of LC3 dots per cell is expressed as means ± S.D. for two independent experiments each with technical triplicates (*P < 0.05).
Figure 6
Figure 6. Autophagic flux is higher in nCDase−/− than in WT MEFs and inhibiting autophagy sensitizes cells to 2DG/AA-induced cell death
(A) WT and nCDase−/− cells were transduced with mCherry–GFP–LC3 plasmid and cells were treated with vehicle (CT, control) or 2DG (20 mM) and AA (7.5 µM) for the indicated times (0–3 h). Cells were fixed, permeabilized and imaged by confocal microscopy. Shown are example images taken from a minimum of ten fields of view per treatment and three independent experiments. (B) WT cells stably expressing non-targeting control shRNA (pLKO.1) or nCDase-specific shRNA (shRNA_NCD) were pre-treated where indicated with vehicle control or the indicated autophagy inhibitor such as 3-MA (2 mM), Spautin-1 (1 µM) or CQ (25 µM) for 3 h followed by treatment with vehicle or 2DG/AA (20 mM and 7.5 µM respectively) for 24 h. The percentage of LDH release was then determined. Results are the means ± S.D. for three independent experiments. * and # indicate P < 0.05 as determined by one-way ANOVA. For (B), * indicates a comparison between WT pLKO.1 and WT nCDase_shRNA values, whereas # denotes statistical significance between WT nCDase_shRNA cells treated with 2DG/AA with and without a given inhibitor of autophagy.
Figure 7
Figure 7. 2DG/AA treatment induces increased mitophagy in nCDase−/− cells
WT and nCDase−/− cells were pre-incubated with MitoTracker Red CMXRos (500 nM) at 37°C for 1 h in Opti-MEM to reduce MitoTracker oxidation. Cells were treated with 2DG (20 mM) and AA (7.5 µM) for the indicated times. CT denotes control vehicle-treated cells. Cells were fixed, permeabilized and imaged via confocal microscopy.
Figure 8
Figure 8. nCDase−/− cells are resistant to ER stress
WT and nCDase−/− cells were treated with vehicle (CT, control) or where indicated the ER stress inducers TG (0.5 µM) or TN (0.5 µg/ml) for 24 h. (A) Total cell lysates were subjected to Western blot analysis for PERK, IRE1α, p-eIF2α, eIF2α, CHOP and BiP expression. Tubulin expression served as loading control. (B) Percentage of LDH release was determined as described. Results are the means ± S.D. for three independent experiments; * denotes a P value < 0.05 as determined by ANOVA. (C) Cells were fixed, permeabilized with ice-cold methanol (100 %) and incubated for 10 min at − 20°C. Cells were stained with primary antibody directed against LC3 and Alexa Fluor 488- conjugated anti-rabbit IgG secondary antibody. DRAQ5 was utilized for nuclear staining. Cells were imaged via confocal microscopy. (D). Quantification of LC3 dots per cell are expressed as means ± S.D., for two independent experiments each with technical triplicates. (*P < 0.05 via ANOVA).
Figure 9
Figure 9. Schematic representation of how loss of nCDase protects cells from the 2DG/AA model of necroptosis
2DG and AA- induced ATP-independent form of cell death. nCDase−/− cells are protected from nutrient- and energy-deprivation-induced cell death via up-regulation of autophagy flux.

Similar articles

Cited by

References

    1. Orrenius S. Apoptosis: molecular mechanisms and implications for human disease. J. Intern. Med. 1995;237:529–536. - PubMed
    1. Leist M, Single B, Castoldi AF, Kuhnle S, Nicotera P. Intracellular adenosine triphosphate (ATP) concentration: a switch in the decision between apoptosis and necrosis. J. Exp. Med. 1997;185:1481–1486. - PMC - PubMed
    1. Patwardhan GA, Beverly LJ, Siskind LJ. Sphingolipids and mitochondrial apoptosis. J. Bioenerg. Biomembr 2015 - PMC - PubMed
    1. Elmore S. Apoptosis: a review of programmed cell death. Toxicol. Pathol. 2007;35:495–516. - PMC - PubMed
    1. Vanlangenakker N, Vanden Berghe T, Vandenabeele P. Many stimuli pull the necrotic trigger, an overview. Cell Death Differ. 2012;19:75–86. - PMC - PubMed

Publication types

LinkOut - more resources