. 2016 Mar;139(Pt 3):891-907.
doi: 10.1093/brain/awv379. Epub 2016 Jan 8.

Pharmacological targeting of CSF1R inhibits microglial proliferation and prevents the progression of Alzheimer's-like pathology

Affiliations

Pharmacological targeting of CSF1R inhibits microglial proliferation and prevents the progression of Alzheimer's-like pathology

Adrian Olmos-Alonso et al. Brain. 2016 Mar.

Abstract

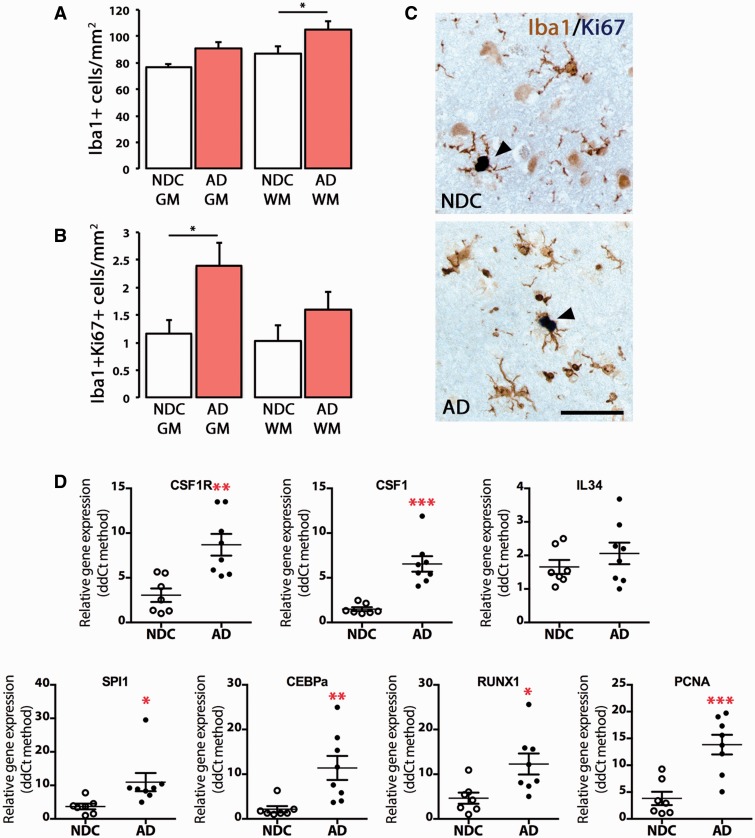
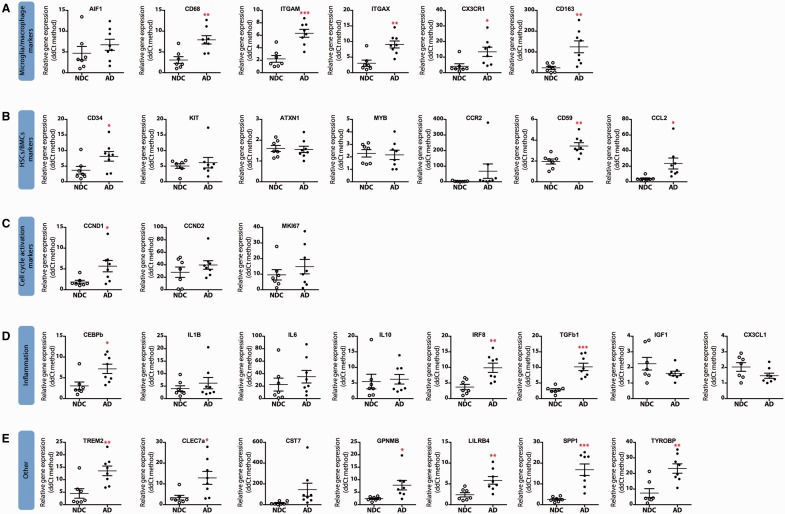
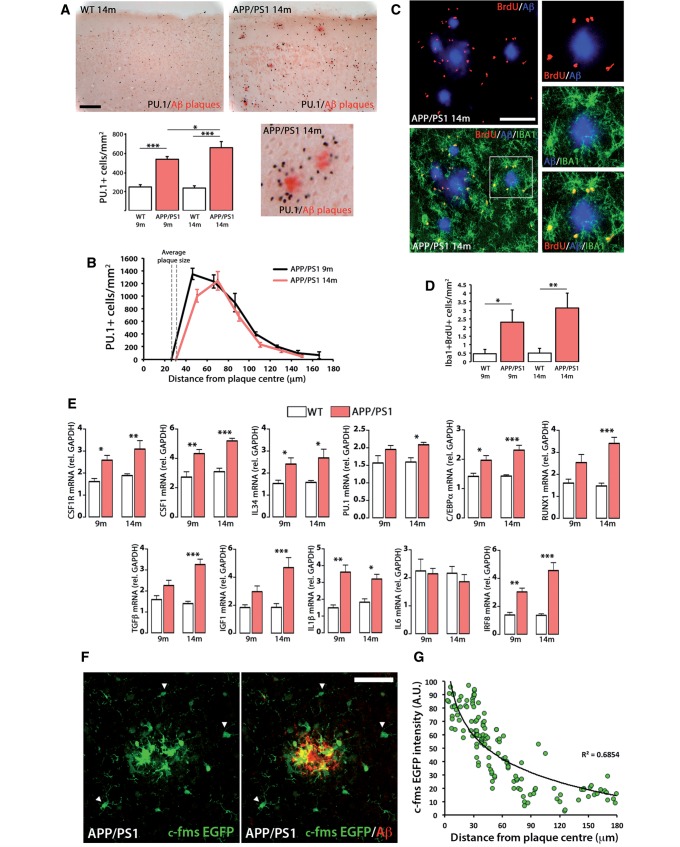
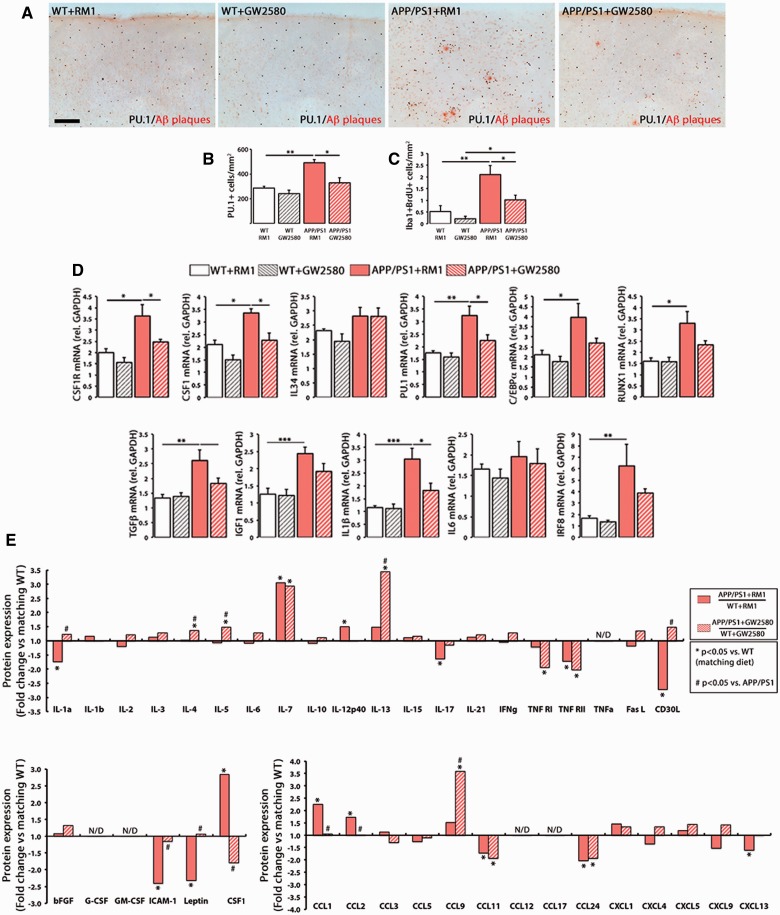
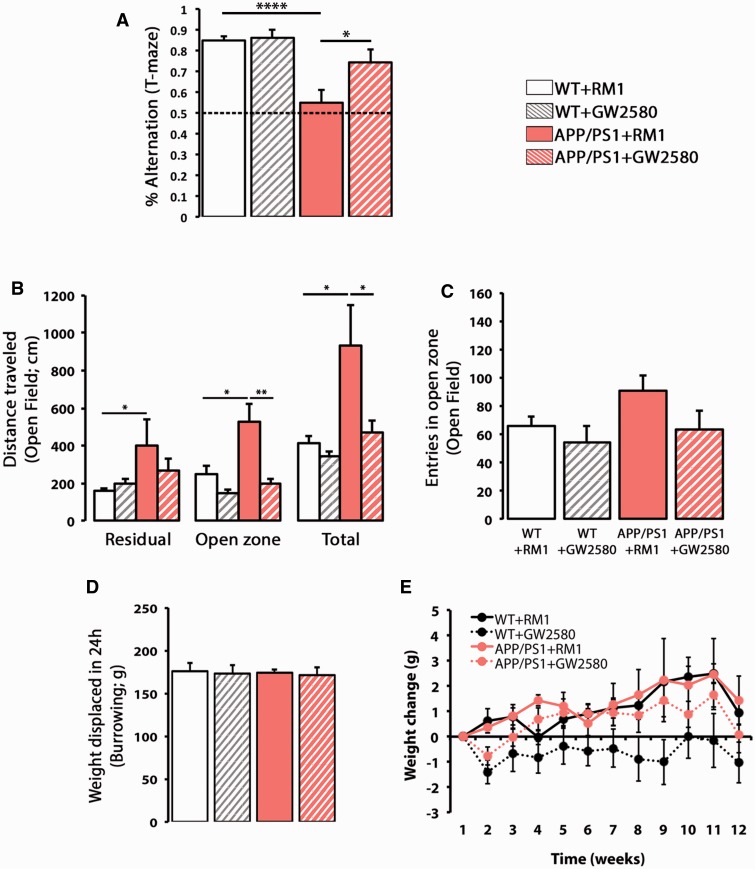
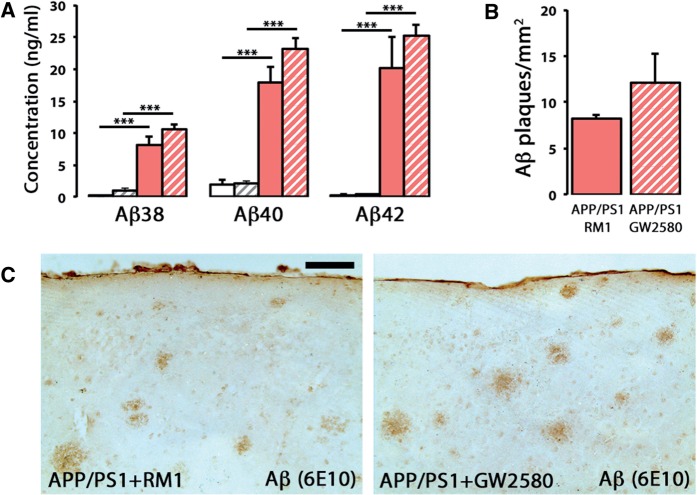
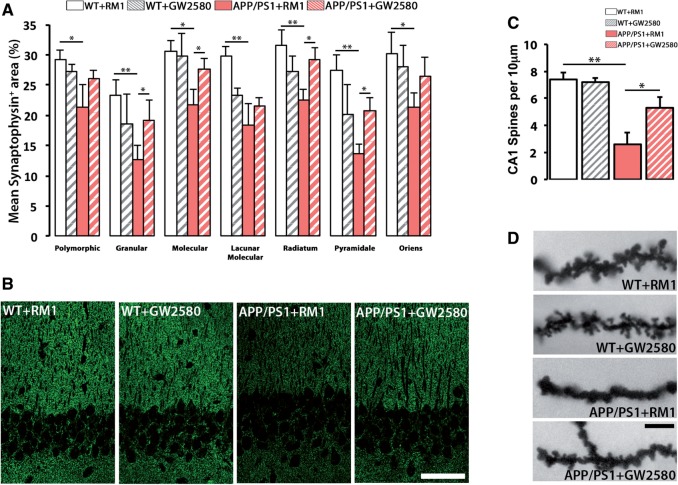
The proliferation and activation of microglial cells is a hallmark of several neurodegenerative conditions. This mechanism is regulated by the activation of the colony-stimulating factor 1 receptor (CSF1R), thus providing a target that may prevent the progression of conditions such as Alzheimer's disease. However, the study of microglial proliferation in Alzheimer's disease and validation of the efficacy of CSF1R-inhibiting strategies have not yet been reported. In this study we found increased proliferation of microglial cells in human Alzheimer's disease, in line with an increased upregulation of the CSF1R-dependent pro-mitogenic cascade, correlating with disease severity. Using a transgenic model of Alzheimer's-like pathology (APPswe, PSEN1dE9; APP/PS1 mice) we define a CSF1R-dependent progressive increase in microglial proliferation, in the proximity of amyloid-β plaques. Prolonged inhibition of CSF1R in APP/PS1 mice by an orally available tyrosine kinase inhibitor (GW2580) resulted in the blockade of microglial proliferation and the shifting of the microglial inflammatory profile to an anti-inflammatory phenotype. Pharmacological targeting of CSF1R in APP/PS1 mice resulted in an improved performance in memory and behavioural tasks and a prevention of synaptic degeneration, although these changes were not correlated with a change in the number of amyloid-β plaques. Our results provide the first proof of the efficacy of CSF1R inhibition in models of Alzheimer's disease, and validate the application of a therapeutic strategy aimed at modifying CSF1R activation as a promising approach to tackle microglial activation and the progression of Alzheimer's disease.

Keywords: Alzheimer’s disease; gliosis; inflammation; microglia; neurodegeneration.


Figures

None
Microglial proliferation and activation is a hallmark of Alzheimer’s disease. Olmos-Alonso et al. show that microglial proliferation in Alzheimer’s disease tissue correlates with overactivation of the colony-stimulating factor 1 receptor (CSF1R) pathway. CSF1R blockade arrests microglial proliferation and activation in a mouse model of Alzheimer-like pathology and slows disease progression.
Figure 1
Figure 1
Characterization of the microglial proliferative response in Alzheimer’s disease. ( A–C ) Immunohistochemical analysis and quantification of the number of total microglial cells (Iba1 + ; A ) or proliferating microglial cells (Iba1 + Ki67 + ; B ) in the grey (GM) and white matter (WM) of the temporal cortex of Alzheimer’s disease cases (AD) and age-matched non-demented controls (NDC). ( C ) Representative pictures of the localization of a marker of proliferation (Ki67, dark blue) in microglial cells (Iba1 + , brown) in the grey matter of the temporal cortex of non-demented controls or Alzheimer’s disease cases. ( D ) RT-PCR analysis of the mRNA expression of CSF1R , CSF1 , IL34 , SPI1 (PU.1), CEBPA , RUNX1 and PCNA in the temporal cortex of Alzheimer’s disease cases and age-matched non-demented controls. Expression of mRNA represented as mean ± SEM and indicated as relative expression to the normalization factor (geometric mean of four housekeeping genes; GAPDH , HPRT , 18S and GUSB ) using the 2-ΔΔCT method. Statistical differences: * P < 0.05, ** P < 0.01, *** P < 0.001. Data were analysed with a two-way ANOVA and a post hoc Tukey test ( A and B ) or with a two-tailed Fisher t -test ( D ). Scale bar in C = 50 µm.
Figure 2
Figure 2
Gene expression analysis in human post-mortem Alzheimer’s disease cases and age-matched controls. Samples from Alzheimer’s disease (filled circles) cases or age-matched controls (NDC, open circles) were analysed by quantitative PCR for the expression of microglia/macrophage markers ( A ), hematopoietic stem cell/bone marrow-derived cell (HSCs/BMCs) markers ( B ), cell cycle activation markers ( C ), inflammation markers ( D ) or other ( E ). Samples were analysed using custom-designed TaqMan ® array plates with the 7500 Real-Time PCR system (Applied Biosystems). Expression of mRNA represented as mean ± SEM and indicated as relative expression to the normalization factor (geometric mean of four housekeeping genes; GAPDH , HPRT , 18S and GUSB ) using the 2-ΔΔCT method. Statistical differences: * P < 0.05, ** P < 0.01, *** P < 0.001. Data were analysed with a two-tailed Fisher t -test.
Figure 3
Figure 3
Characterization of the microglial proliferative response in a mouse model of Alzheimer’s disease-like pathology (APP/PS1). ( A ) Immunohistochemical analysis and quantification of the number of total microglial cells (PU.1 + ; black) in the cortex of APP/PS1 and wild-type mice at 9 and 14 months of age. Amyloid-β plaques are shown in red (Congo Red). Number of microglia represented as mean ± SEM of PU.1 + cells/mm 2 . ( B ) Analysis of the spatial distribution of microglial cells (PU.1 + ) around amyloid-β plaques in the cortex of APP/PS1 mice at 9 and 14 months of age, using an adapted version of the Sholl analysis (see ‘Materials and methods’ section). Number of microglia represented as mean ± SEM of PU.1 + cells/mm 2 . ( C and D ) Analysis and quantification of microglial proliferation (Iba1 + BrdU + , green and red, respectively; C ) by triple immunofluorescence analysed by confocal microscopy. Amyloid-β plaques are shown in blue (6E10). ( D ) Microglial proliferation represented as mean ± SEM of Iba1 + BrdU + cells/mm 2 . ( E ) RT-PCR analysis of the mRNA expression of Csf1r , Csf1 , Il34 , Spi1 (PU.1), Cebpa , Runx1 , Tgfb , Igf1 , Il1b , Il6 and Irf8 in the cortex of APP/PS1 and wild-type (WT) mice at 9 and 14 months of age. Expression of mRNA represented as mean ± SEM and indicated as relative expression compared to the housekeeping gene ( Gapdh ) using the 2-ΔΔCT method. ( F ) Immunofluorescent analysis of the expression of EGFP (green) driven by the Csf1r promoter in APP/PS1/Macgreen mice, around amyloid-β plaques in the cortex of APP/PS1 mice at 14 months of age. Amyloid-β (6E10) is shown in red. Arrowheads indicate microglia with low CSF1R expression. ( G ) Correlation analysis of the expression of EGFP in individual cells in APP/PS1/Macgreen mice with the distance to amyloid-β plaques. Statistical differences: * P < 0.05, ** P < 0.01, *** P < 0.001. Data were analysed with a two-way ANOVA and a post hoc Tukey test ( A , D and E ). Scale bars: A = 100 μm, C and F = 50 μm.
Figure 4
Figure 4
Prolonged inhibition of CSF1R blocks microglial proliferation and rescues the inflammatory alterations of APP/PS1 mice. ( A–C ) Immunohistochemical analysis and quantification of the number of total microglial cells (PU.1 + ; black, A and B ) and proliferating microglial cells (Iba1 + BrdU + , C ) in the cortex of APP/PS1 and wild-type mice at 9 months of age, after treatment for 3 months with a control diet (RM1) or a diet containing GW2580. Amyloid-β plaques are shown in red (Congo Red). Number of microglia represented as mean ± SEM of PU.1 + or Iba1 + BrdU + cells/mm 2 . ( D ) RT-PCR analysis of the mRNA expression of Csf1r , Csf1 , Il34 , Spi1 (PU.1), Cebpa , Runx1 , Tgfb , Igf1 , Il1b , Il6 and Irf8 in the cortex of APP/PS1 and wild-type mice at 9 months of age, after treatment for 3 months with a control diet (RM1) or a diet containing GW2580. Expression of mRNA represented as mean ± SEM and indicated as relative expression compared to the housekeeping gene ( Gapdh ) using the 2-ΔΔCT method. ( E ) Quantification of protein concentration of 40 inflammatory mediators (grouped as cytokines, growth factors and chemokines) by Mouse Quantibody Cytokine Arrays (see ‘Materials and methods’ section), in samples from the cortex of APP/PS1 and wild-type mice at 9 months of age, after treatment for 3 months with a control diet (RM1) or a diet containing GW2580. Protein expression represented as fold change (+fold change = upregulation, −fold change = downregulation) of the corresponding APP/PS1 group (with RM1 or with GW2580) over its correspondent wild-type group. When protein concentration fell below the levels of detection of the assay for more than half of the samples, data are shown as N/D (not detectable). Statistical differences: * P < 0.05, ** P < 0.01. Data were analysed with a two-way ANOVA and a post hoc Tukey test. Scale bar: A = 100 μm.
Figure 5
Figure 5
CSF1R inhibition prevents behavioural deficits in APP/PS1 mice. ( A ) Spontaneous alternation in the T-maze of APP/PS1 and wild-type mice at 9 months of age, after treatment for 3 months with a control diet (RM1) or a diet containing GW2580. Alternation was measured as % election of the alternative arm in the second test (short-term memory). ( B and C ) Analysis of the behaviour in the open field, measured as total distanced travelled ( B ) or number of entries in the open zone ( C ) of APP/PS1 and wild-type (WT) mice at 9 months of age, after treatment for 3 months with a control diet (RM1) or a diet containing GW2580. Exploratory activity was measured as distance travelled (cm) in the open field test, analysing the locomotor activity on an open zone versus residual zone as a correlate of anxiety. ( D ) Burrowing behaviour, a measure of sickness behaviour, was measured as weight displaced (g) off the tube in 24 h. ( E ) Analysis of the effect of the influence of genotype (wild-type versus APP/PS1) or diet (RM1 versus GW2580) on the average weekly weight change (relative to t = 0) mice at 9 months of age, after treatment for 3 months with a control diet (RM1) or a diet containing GW2580. Statistical differences: * P < 0.05, ** P < 0.01. Data were analysed with a two-way ANOVA and a post hoc Tukey ( B–E ) or Bonferroni ( A ) test.
Figure 6
Figure 6
CSF1R inhibition does not alter the levels of amyloid-β. ( A ) Multiplexed analysis of the concentration of soluble amyloid-β 38 , amyloid-β 40 and amyloid-β 42 in cortex homogenates of APP/PS1 and wild-type mice at 9 months of age, after treatment for 3 months with a control diet (RM1) or a diet containing GW2580. Soluble amyloid-β levels represented as mean ± SEM of concentration (ng/ml). ( B and C ) Immunohistochemical analysis and quantification of the number of amyloid-β plaques (6E10 + ; brown) in the cortex of APP/PS1 mice at 9 months of age, after treatment for 3 months with a control diet (RM1) or a diet containing GW2580. Number of amyloid-β plaques represented as mean ± SEM of 6E10 + plaques/mm 2 . Statistical differences: *** P < 0.001. Data were analysed with a two-way ANOVA and a post hoc Tukey test. Scale bar in C = 100 μm.
Figure 7
Figure 7
CSF1R inhibition prevents synaptic degeneration in APP/PS1 mice. ( A and B ) Immunohistochemical analysis and quantification of protein levels of synaptophysin in the hippocampus of APP/PS1 and wild-type (WT) mice at 9 months of age, after treatment for 3 months with a control diet (RM1) or a diet containing GW2580. Synaptophysin levels represented as mean ± SEM of %Synaptophysin + area ( A ). Representative confocal images are shown in B . ( C and D ) Analysis of spine density in the apical segment of hippocampal CA1 neurons of APP/PS1 and wild-type mice at 9 months of age, after treatment for 3 months with a control diet (RM1) or a diet containing GW2580. Representative images are shown in D . Statistical differences: * P < 0.05, ** P < 0.01. Data were analysed with a two-way ANOVA and a post hoc Tukey test. Scale bars: B = 50 μm, D = 10 μm.

Comment in

References

    1. Akiyama H, Barger S, Barnum S, Bradt B, Bauer J, Cole GM, et al. . Inflammation and Alzheimer's disease . Neurobiol Aging 2000. ; 21 : 383 – 421 . - PMC - PubMed
    1. Akiyama H, Nishimura T, Kondo H, Ikeda K, Hayashi Y, McGeer PL . Expression of the receptor for macrophage colony stimulating factor by brain microglia and its upregulation in brains of patients with Alzheimer's disease and amyotrophic lateral sclerosis . Brain Res 1994. ; 639 : 171 – 4 . - PubMed
    1. Bell RD, Winkler EA, Sagare AP, Singh I, LaRue B, Deane R, et al. . Pericytes control key neurovascular functions and neuronal phenotype in the adult brain and during brain aging . Neuron 2010. ; 68 : 409 – 27 . - PMC - PubMed
    1. Blalock EM, Geddes JW, Chen KC, Porter NM, Markesbery WR, Landfield PW . Incipient Alzheimer's disease: microarray correlation analyses reveal major transcriptional and tumor suppressor responses . Proc Natl Acad Sci USA 2004. ; 101 : 2173 – 8 . - PMC - PubMed
    1. Boche D, Zotova E, Weller RO, Love S, Neal JW, Pickering RM, et al. . Consequence of Abeta immunization on the vasculature of human Alzheimer's disease brain . Brain 2008. ; 131 ( Pt 12 ): 3299 – 310 . - PubMed

Publication types

MeSH terms

Substances