. 2016 Jan 7;98(1):5-21.
doi: 10.1016/j.ajhg.2015.11.014.

Genomic Signatures of Selective Pressures and Introgression from Archaic Hominins at Human Innate Immunity Genes

Affiliations

Genomic Signatures of Selective Pressures and Introgression from Archaic Hominins at Human Innate Immunity Genes

Matthieu Deschamps et al. Am J Hum Genet. .

Abstract

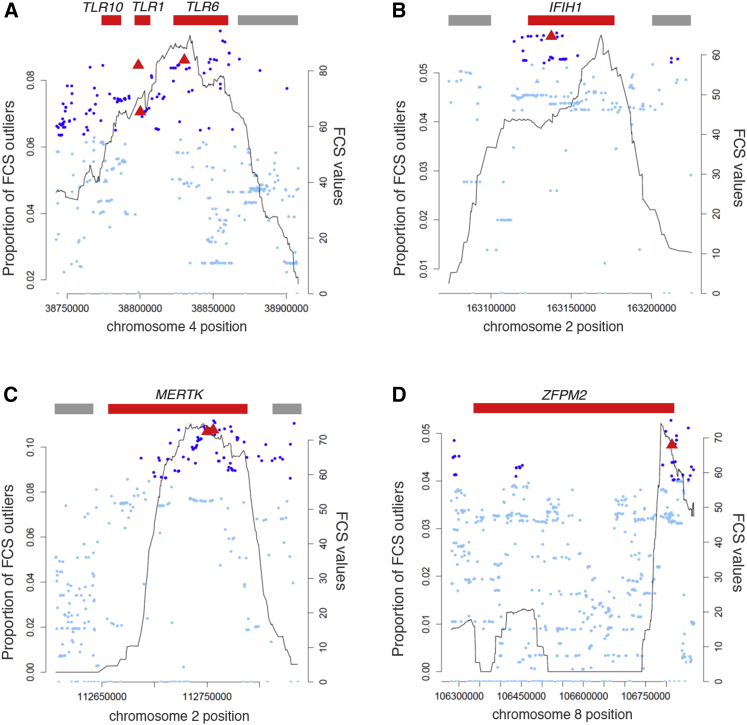
Human genes governing innate immunity provide a valuable tool for the study of the selective pressure imposed by microorganisms on host genomes. A comprehensive, genome-wide study of how selective constraints and adaptations have driven the evolution of innate immunity genes is missing. Using full-genome sequence variation from the 1000 Genomes Project, we first show that innate immunity genes have globally evolved under stronger purifying selection than the remainder of protein-coding genes. We identify a gene set under the strongest selective constraints, mutations in which are likely to predispose individuals to life-threatening disease, as illustrated by STAT1 and TRAF3. We then evaluate the occurrence of local adaptation and detect 57 high-scoring signals of positive selection at innate immunity genes, variation in which has been associated with susceptibility to common infectious or autoimmune diseases. Furthermore, we show that most adaptations targeting coding variation have occurred in the last 6,000-13,000 years, the period at which populations shifted from hunting and gathering to farming. Finally, we show that innate immunity genes present higher Neandertal introgression than the remainder of the coding genome. Notably, among the genes presenting the highest Neandertal ancestry, we find the TLR6-TLR1-TLR10 cluster, which also contains functional adaptive variation in Europeans. This study identifies highly constrained genes that fulfill essential, non-redundant functions in host survival and reveals others that are more permissive to change-containing variation acquired from archaic hominins or adaptive variants in specific populations-improving our understanding of the relative biological importance of innate immunity pathways in natural conditions.


Figures

Figure 1
Figure 1
Varying Degrees of Selective Constraints Targeting Innate Immunity Genes (A) Strength of purifying selection acting on innate immunity genes and the remainder of protein-coding genes, as measured by the f value. We tested the significance of the observed difference by means of 105 resamplings taking into account gene length and number of SNPs per gene in the two tested gene sets (∗∗∗p < 4.7 × 10−3). (B) Enrichment of innate immunity genes among the most constrained genes at the genome-wide level, as assessed by odds ratios (ORs). We calculated ORs for increasing percentiles of the f distribution, with a pace of 1%. The 95% confidence intervals of ORs were calculated via the Fisher’s exact test. (C) Strength of purifying selection acting on the different functional categories of innate immunity genes, as measured by the f value (UC stands for unclassified). (D) Innate immunity protein interaction network. Only innate immunity proteins interacting with a molecular partner also involved in this cellular process are represented. Node sizes are negatively correlated to f values, i.e., large nodes represent low f values, indicating stronger action of purifying selection. Color codes are the same as those used in (C).
Figure 2
Figure 2
Power of the Fisher’s Combined Score to Detect Positive Selection We simulated 200-kb DNA regions according to accepted scenarios of human demography for West African (YRI), European (CEU), and East Asian (CHB) samples (see Material and Methods and Grossman et al.5). We simulated positive selection models, in each population separately, using various ages (t) of the selected allele (5 kya, 10 kya, 20 kya, and 30 kya) and current frequencies (psel) of the selected allele (0.2, 0.4, 0.6, 0.8, and 1.0), and setting the selection coefficient s to be equal to 0.01 (100 datasets for each parameter combination, see Material and Methods). For each population, we plot the power (i.e., the proportion of simulated regions under positive selection effectively detected) obtained with the FCS as well as, for comparison, FCS_DIND (i.e., FCS removing the DIND statistics), iHS, and XP-EHH (see Material and Methods, FPR of 1%). For a detailed comparison of the differences in power of the FCS with respect to different combinations of neutrality statistics, see Figure S7. Left panels show, for each population, the power obtained with ages of selection t uniformly distributed from 5 kya to 30 kya. Smaller right panels display, for each population, the power obtained with ages of positive selection of 5 kya, 10 kya, 20 kya, and 30 kya, respectively. The x axis represents the current frequency of the selected allele psel.
Figure 3
Figure 3
Innate Immunity Genes Presenting High-Confidence Signals of Geographic Adaptation Four examples of innate immunity genes presenting strong signals of positive selection, including (A) the TLR6-1-10 gene cluster in CEU, (B) IFIH1 in YRI, (C) MERTK in CHB, and (D) ZFPM2 in YRI. The black curves delineate the proportions of outlier SNPs (i.e., SNPs with the 1% highest FCS values of the genome), within 100-kb regions, at the genome-wide level, using the low-coverage 1000 Genomes Project dataset (see Material and Methods for details). Blue dots represent the FCS value of each SNP, calculated using the merged dataset (both high- and low-coverage) for the fine mapping of putative adaptive mutations. Dark blue dots indicate SNPs with the 1% highest FCS values of the genome, within which non-synonymous variants are represented by red triangles. The remaining variants are plotted in light blue, where triangles represent non-synonymous mutations.
Figure 4
Figure 4
Neandertal Ancestry of Innate Immunity Genes (A) Comparison of the average introgression scores of innate immunity genes (IIGs) with respect to the remainder of protein-coding genes (non-IIGs) in European (EUR) and East Asian (ASN) populations. ∗∗∗p < 0.001 (see Material and Methods). (B and C) Haplotypes of Neandertal ancestry in (B) CEU individuals at the TLR6-TLR1-TLR10 gene cluster and (C) CHB individuals at the SIRT1 locus. Confidently inferred haplotypes of Neandertal ancestry, defined as long runs of SNPs that present a probability of Neandertal ancestry > 0.9, are indicated in blue in each diploid individual from the 1000 Genomes Project. Red shadows highlight genomic regions containing innate immunity genes.

Comment in

  • TLRs of Our Fathers.
    Netea MG, Joosten LA. Netea MG, et al. Immunity. 2016 Feb 16;44(2):218-20. doi: 10.1016/j.immuni.2016.02.003. Immunity. 2016. PMID: 26885854

References

    1. Casanova J.L., Abel L. Inborn errors of immunity to infection: the rule rather than the exception. J. Exp. Med. 2005;202:197–201. - PMC - PubMed
    1. Casanova J.L., Abel L., Quintana-Murci L. Immunology taught by human genetics. Cold Spring Harb. Symp. Quant. Biol. 2013;78:157–172. - PubMed
    1. Chapman S.J., Hill A.V. Human genetic susceptibility to infectious disease. Nat. Rev. Genet. 2012;13:175–188. - PubMed
    1. Barreiro L.B., Quintana-Murci L. From evolutionary genetics to human immunology: how selection shapes host defence genes. Nat. Rev. Genet. 2010;11:17–30. - PubMed
    1. Grossman S.R., Andersen K.G., Shlyakhter I., Tabrizi S., Winnicki S., Yen A., Park D.J., Griesemer D., Karlsson E.K., Wong S.H., 1000 Genomes Project Identifying recent adaptations in large-scale genomic data. Cell. 2013;152:703–713. - PMC - PubMed

Publication types