. 2016 Jan 7;98(1):116-26.
doi: 10.1016/j.ajhg.2015.11.020.

Genotype Imputation with Millions of Reference Samples

Affiliations

Genotype Imputation with Millions of Reference Samples

Brian L Browning et al. Am J Hum Genet. .

Abstract

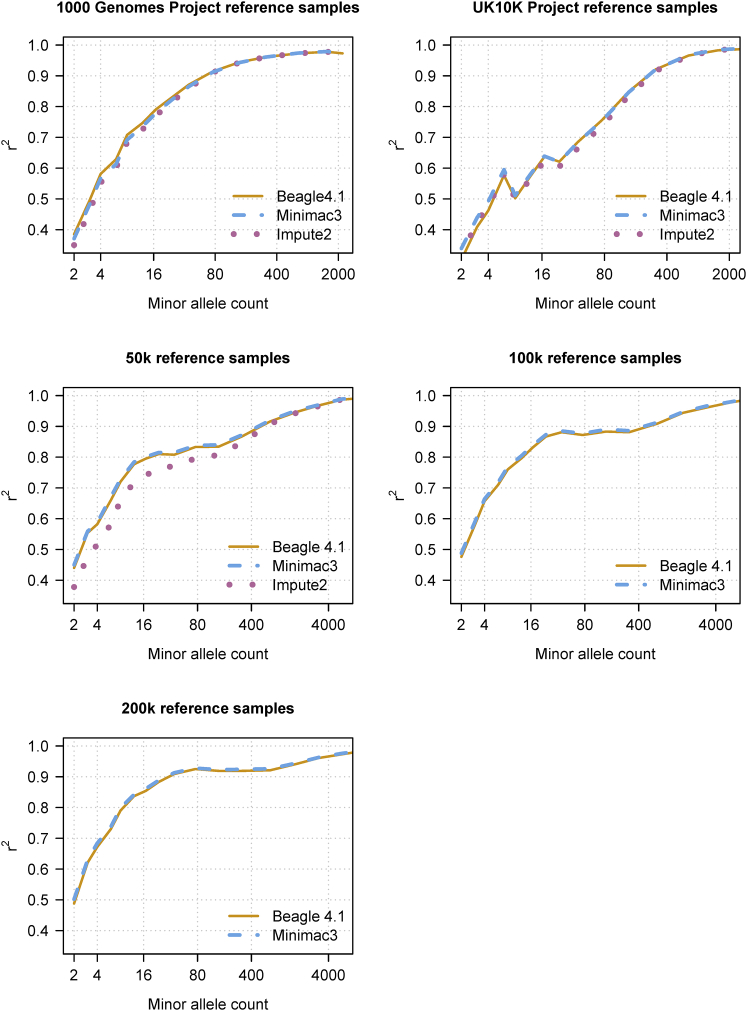
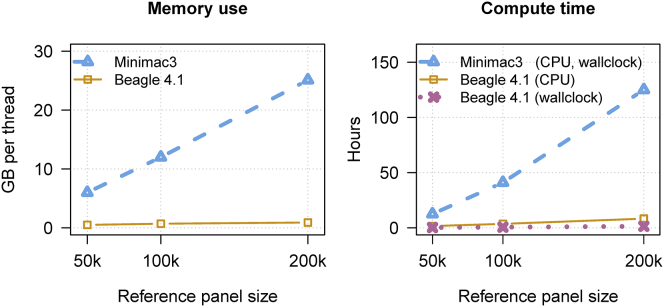
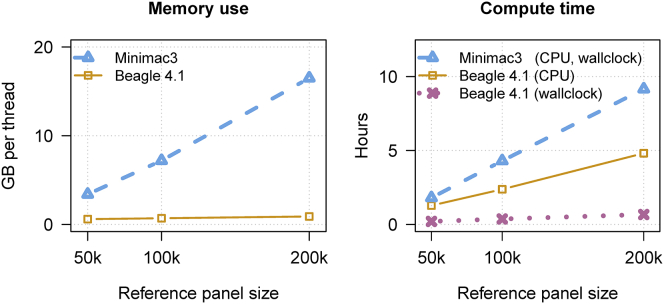
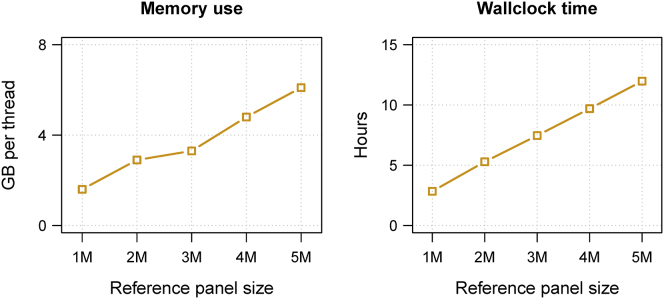
We present a genotype imputation method that scales to millions of reference samples. The imputation method, based on the Li and Stephens model and implemented in Beagle v.4.1, is parallelized and memory efficient, making it well suited to multi-core computer processors. It achieves fast, accurate, and memory-efficient genotype imputation by restricting the probability model to markers that are genotyped in the target samples and by performing linear interpolation to impute ungenotyped variants. We compare Beagle v.4.1 with Impute2 and Minimac3 by using 1000 Genomes Project data, UK10K Project data, and simulated data. All three methods have similar accuracy but different memory requirements and different computation times. When imputing 10 Mb of sequence data from 50,000 reference samples, Beagle's throughput was more than 100× greater than Impute2's throughput on our computer servers. When imputing 10 Mb of sequence data from 200,000 reference samples in VCF format, Minimac3 consumed 26× more memory per computational thread and 15× more CPU time than Beagle. We demonstrate that Beagle v.4.1 scales to much larger reference panels by performing imputation from a simulated reference panel having 5 million samples and a mean marker density of one marker per four base pairs.


Figures

Figure 1
Figure 1
Genotype Imputation Accuracy for Beagle v.4.1, Minimac3, and Impute2 Genotype imputation accuracy when imputing genotypes from reference panels of increasing size. The 1000 Genomes Project data for chromosome 20 were divided into a reference panel with 2,452 sequenced individuals and an imputation target with 52 individuals genotyped on the Illumina Omni2.5 array and having all other sequenced variants masked. The UK10K Project data for chromosome 20 was used to impute the 503 designated European samples from the 1000 Genomes Project. The target samples were genotyped on the Illumina Omni2.5 array and had all other sequenced variants masked. The three largest reference panels have 10 Mb of simulated sequence data for 50,000, 100,000, and 200,000 individuals. For each simulated reference panel, the imputation target was 1,000 simulated individuals genotyped for 3,333 markers in the 10 Mb region, corresponding to a genome-wide array with 1M SNPs. Imputed genotypes were binned according to the minor allele count of the marker in the reference panel. The squared correlation between the imputed minor-allele dose and the true minor-allele dosage is reported for the genotypes in each minor allele count bin. The horizontal axis in each panel is on a log scale. Impute2 was not run with the 100,000 and 200,000 member reference panels because of memory constraints. When running Impute2 with 50,000 reference samples, the 10 Mb region was broken into six 1.67 Mb windows with a 250 kb buffer appended to the end of each window in order to avoid exceeding the available computer memory.
Figure 2
Figure 2
Memory Use and Computation Time for Beagle v.4.1 and Minimac3 for VCF Reference Data Three reference panels in VCF format with 50,000, 100,000, and 200,000 individuals and 10 Mb of simulated sequence data were used to impute genotypes in 1,000 individuals genotyped on a SNP array with 3,333 markers in the 10 Mb region, corresponding to a genome-wide array with 1M SNPs. Beagle v.4.1 was run with 12 computational threads, and Minimac3 was run with one computational thread. CPU time includes the sum of the computation time consumed by each computational thread.
Figure 3
Figure 3
Memory Use and Computation Time for Beagle v.4.1 and Minimac3 for Pre-processed Reference Data Three reference panels with 50,000, 100,000, and 200,000 individuals and 10 Mb of simulated sequence data were used to impute genotypes in 1,000 individuals genotyped on a SNP array with 3,333 markers in the 10 Mb region, corresponding to a genome-wide array with 1M SNPs. Reference data are in bref format (Beagle) and m3vcf format (Minimac3). Beagle v.4.1 was run with 12 computational threads, and Minimac3 was run with 1 computational thread. CPU time includes the sum of the computation time consumed by each computational thread.
Figure 4
Figure 4
Memory Use and Computation Time for Beagle v.4.1 for Millions of Reference Samples Beagle’s memory requirements and computation time for imputing 10 Mb of simulated sequence data from binary reference files having one million to five million reference samples, each with 1,294,053 markers. The simulated imputation target was 1,000 individuals genotyped on a 1M SNP array (3,333 markers in the 10 Mb region). CPU time includes the sum of the computation time consumed by each computational thread. All Beagle analyses used 12 computational threads. The wall clock computation time required to prepare each binary reference file was approximately four to five times greater than the wall clock imputation time reported in this figure.

References

    1. Marchini J., Howie B. Genotype imputation for genome-wide association studies. Nat. Rev. Genet. 2010;11:499–511. - PubMed
    1. Marchini J., Howie B., Myers S., McVean G., Donnelly P. A new multipoint method for genome-wide association studies by imputation of genotypes. Nat. Genet. 2007;39:906–913. - PubMed
    1. Wood A.R., Esko T., Yang J., Vedantam S., Pers T.H., Gustafsson S., Chu A.Y., Estrada K., Luan J., Kutalik Z., Electronic Medical Records and Genomics (eMERGE) Consortium. MIGen Consortium. PAGE Consortium. LifeLines Cohort Study Defining the role of common variation in the genomic and biological architecture of adult human height. Nat. Genet. 2014;46:1173–1186. - PMC - PubMed
    1. Speliotes E.K., Willer C.J., Berndt S.I., Monda K.L., Thorleifsson G., Jackson A.U., Lango Allen H., Lindgren C.M., Luan J., Mägi R., MAGIC. Procardis Consortium Association analyses of 249,796 individuals reveal 18 new loci associated with body mass index. Nat. Genet. 2010;42:937–948. - PMC - PubMed
    1. Willer C.J., Schmidt E.M., Sengupta S., Peloso G.M., Gustafsson S., Kanoni S., Ganna A., Chen J., Buchkovich M.L., Mora S., Global Lipids Genetics Consortium Discovery and refinement of loci associated with lipid levels. Nat. Genet. 2013;45:1274–1283. - PMC - PubMed

Publication types