. 2016 Jan 7;98(1):127-48.
doi: 10.1016/j.ajhg.2015.11.022.

Model-free Estimation of Recent Genetic Relatedness

Affiliations

Model-free Estimation of Recent Genetic Relatedness

Matthew P Conomos et al. Am J Hum Genet. .

Abstract

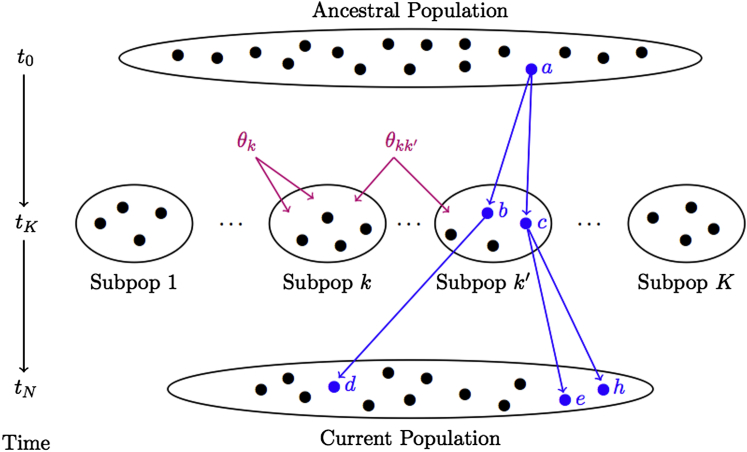
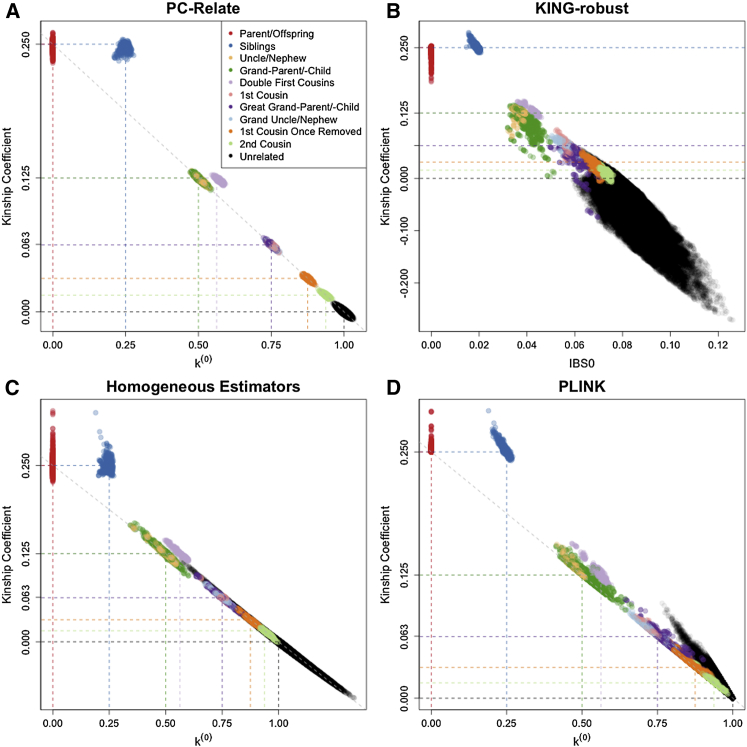
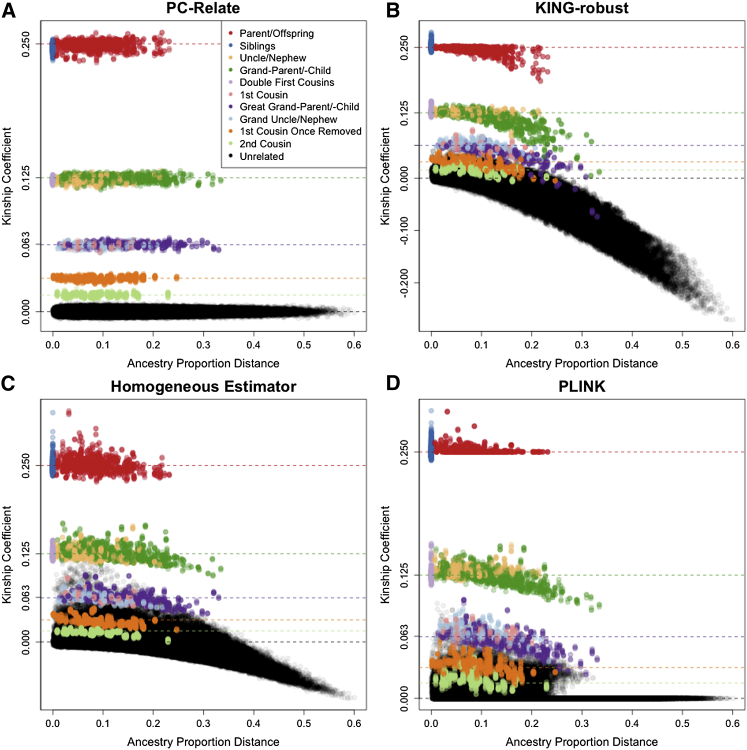
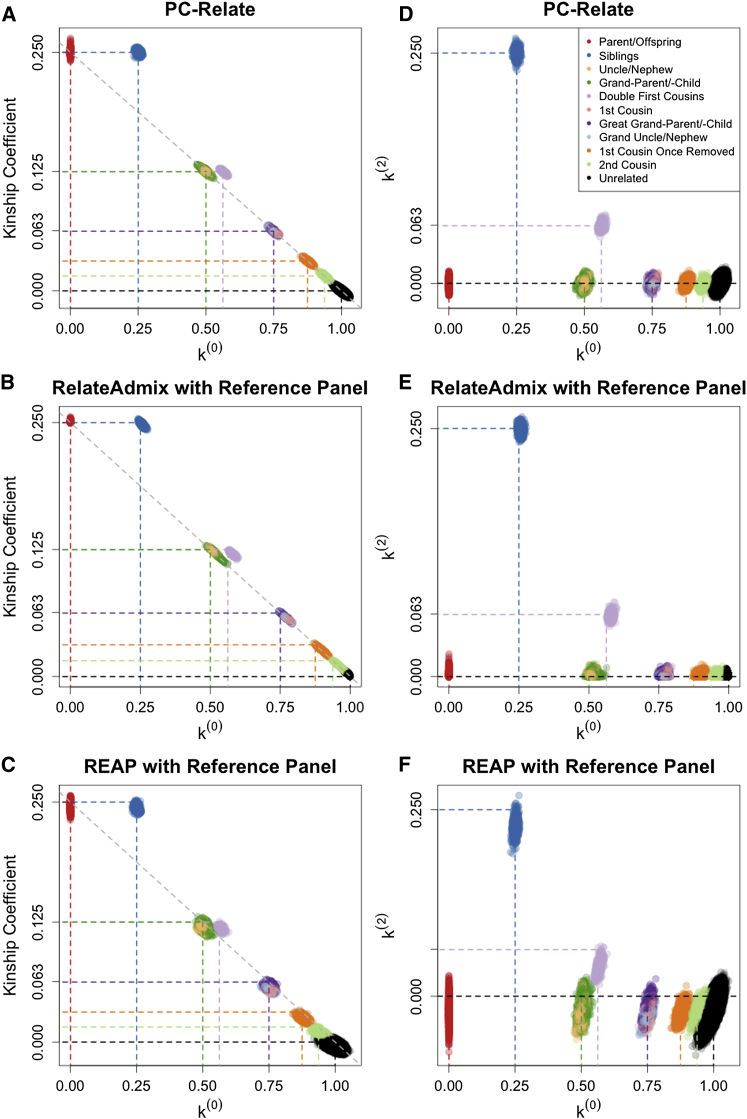
Genealogical inference from genetic data is essential for a variety of applications in human genetics. In genome-wide and sequencing association studies, for example, accurate inference on both recent genetic relatedness, such as family structure, and more distant genetic relatedness, such as population structure, is necessary for protection against spurious associations. Distinguishing familial relatedness from population structure with genotype data, however, is difficult because both manifest as genetic similarity through the sharing of alleles. Existing approaches for inference on recent genetic relatedness have limitations in the presence of population structure, where they either (1) make strong and simplifying assumptions about population structure, which are often untenable, or (2) require correct specification of and appropriate reference population panels for the ancestries in the sample, which might be unknown or not well defined. Here, we propose PC-Relate, a model-free approach for estimating commonly used measures of recent genetic relatedness, such as kinship coefficients and IBD sharing probabilities, in the presence of unspecified structure. PC-Relate uses principal components calculated from genome-screen data to partition genetic correlations among sampled individuals due to the sharing of recent ancestors and more distant common ancestry into two separate components, without requiring specification of the ancestral populations or reference population panels. In simulation studies with population structure, including admixture, we demonstrate that PC-Relate provides accurate estimates of genetic relatedness and improved relationship classification over widely used approaches. We further demonstrate the utility of PC-Relate in applications to three ancestrally diverse samples that vary in both size and genealogical complexity.


Figures

Figure 1
Figure 1
Illustration of Identity by Descent in Relation to Choice of Reference Population Each solid dot in the figure represents an allele. The K distinct subpopulations at time tK descended from one common ancestral population at time t0. The parameter θk is the correlation of a random pair of alleles from subpopulation k relative to the total population, and the parameter θkk′ is the correlation of a random allele from subpopulation k and a random allele from subpopulation k′ relative to the total population. The current population of alleles at time tN includes alleles descended from all K subpopulations. A sample individual drawn from this current population might have alleles descended from multiple subpopulations, resulting in admixed ancestry. When the ancestral population at time t0 is treated as the reference population, alleles d, e, and h are IBD, because all three descended from the same allele, a. Therefore, the parameters ψij and Fi treat alleles d, e, and h as IBD when measuring relatedness. On the other hand, when the ancestral history prior to time tK is ignored and the set of K subpopulations are treated as the reference population, only alleles e and h are IBD, because both descended from the same allele, c. Allele d is not IBD to e and h, because allele d descended from allele b, which is distinct from allele c at time tK. Therefore, the parameters ϕij and fi treat only alleles e and h as IBD when measuring relatedness, because more distant sharing prior to time tK is ignored.
Figure 2
Figure 2
Relatedness Estimation in the Presence of Ancestry Admixture Scatter plots of estimated kinship coefficients against estimated probabilities of sharing zero alleles IBD, k(0), for each pair of individuals from (A) PC-Relate, (C) the Homogeneous Estimators, and (D) PLINK. KING-robust (B) does not provide IBD sharing probability estimates for structured populations, so estimated kinship coefficients are plotted against the proportion of SNPs where the pair of individuals are opposite homozygotes; i.e., share zero alleles identical by state (IBS). Each point is color coded by the true relationship type of the pair of individuals, and the colored dashed lines show the theoretical expected values for the corresponding relationship type.
Figure 3
Figure 3
Kinship Coefficient Estimation as a Function of Ancestry Difference Scatter plots of estimated kinship coefficients against ancestry proportion distances, defined as k=1Kθk(aikajk)2, for each pair of individuals for (A) PC-Relate, (B) KING-robust, (C) the Homogeneous Estimators, and (D) PLINK. Each point is color coded by the true relationship type of the pair of individuals, and the colored dashed lines show the theoretical expected value for the corresponding relationship type.
Figure 4
Figure 4
Comparison of PC-Relate to Model-Based Estimators Scatter plots of estimated kinship coefficients against estimated probabilities of sharing zero alleles IBD, k(0), for each pair of individuals from (A) PC-Relate, (B) RelateAdmix, and (C) REAP. Scatter plots of the estimated probabilities of sharing two alleles IBD, k(2), against k(0) for each pair of individuals from (D) PC-Relate, (E) RelateAdmix, and (F) REAP. Each point is color coded by the true relationship type of the pair of individuals, and the colored dashed lines show the theoretical expected value for the corresponding relationship type.
Figure 5
Figure 5
Comparison of Kinship Coefficient Estimates in the WHI-SHARe Hispanic Cohort from Estimators without Reference Panels Scatter plots of estimated kinship coefficients from PC-Relate versus (A) KING-robust and (B) PLINK for each pair of individuals. The shaded gray box indicates estimates where both methods infer pairs to be more distant than third-degree relatives or unrelated (both classified as “unrelated” here). Each point is color coded by the relationship type of the pair of individuals, as inferred from PC-Relate, and the colored dashed lines show the theoretical kinship values for the corresponding relationship type. The relationship type abbreviations in the legend are as follows: MZ, monozygotic twins; FS, full siblings; PO, parent/offspring; 2nd Deg., second-degree relatives; 3rd Deg., third-degree relatives; Unrelated, more distant than third-degree relatives or unrelated.
Figure 6
Figure 6
Relatedness Estimation in the WHI-SHARe Hispanic Cohort with PC-Relate and Model-Based Estimators Scatter plots of the estimated kinship coefficients against the estimated probabilities of sharing zero alleles IBD, k(0), from (A) PC-Relate, (B) RelateAdmix, and (C) REAP. Each point is color coded by the relationship type of the pair of individuals, as inferred from the respective method, and the colored dashed lines show the theoretical expected values of each measure for the corresponding relationship type. The relationship type abbreviations in the legend are as in Figure 5.
Figure 7
Figure 7
PC-Relate Kinship Coefficient Estimates by Reported Degree of Relationship in T2D-GENES Pedigrees Histograms showing the distribution of the PC-Relate kinship coefficient estimates calculated from the odd-numbered autosomes for pairs of individuals reported to be first- through fifth-degree relatives, as well as pairs reported to be unrelated. The values printed in the top right corner of each panel give the observed mean and standard deviation of the estimates for pairs reported to have the specified degree of relatedness. The colored vertical line in each panel indicates the theoretical pedigree-based kinship coefficient for the specified relationship type, which is also printed in the panel title. The colored bars beneath each histogram show the range of estimated kinship coefficient values for which we classify a pair of individuals to have a particular degree of relatedness (blue for first, green for second, purple for third, orange for fourth, lime for fifth, and black for unrelated).

Comment in

References

    1. Price A.L., Patterson N.J., Plenge R.M., Weinblatt M.E., Shadick N.A., Reich D. Principal components analysis corrects for stratification in genome-wide association studies. Nat. Genet. 2006;38:904–909. - PubMed
    1. Thornton T., McPeek M.S. ROADTRIPS: case-control association testing with partially or completely unknown population and pedigree structure. Am. J. Hum. Genet. 2010;86:172–184. - PMC - PubMed
    1. Kang H.M., Sul J.H., Service S.K., Zaitlen N.A., Kong S.Y., Freimer N.B., Sabatti C., Eskin E. Variance component model to account for sample structure in genome-wide association studies. Nat. Genet. 2010;42:348–354. - PMC - PubMed
    1. Conomos M.P., Miller M.B., Thornton T.A. Robust inference of population structure for ancestry prediction and correction of stratification in the presence of relatedness. Genet. Epidemiol. 2015;39:276–293. - PMC - PubMed
    1. Thompson E.A. The estimation of pairwise relationships. Ann. Hum. Genet. 1975;39:173–188. - PubMed

Publication types