. 2016 Jan 7;98(1):185-201.
doi: 10.1016/j.ajhg.2015.12.002.

Invariant TAD Boundaries Constrain Cell-Type-Specific Looping Interactions between Promoters and Distal Elements around the CFTR Locus

Affiliations

Invariant TAD Boundaries Constrain Cell-Type-Specific Looping Interactions between Promoters and Distal Elements around the CFTR Locus

Emily M Smith et al. Am J Hum Genet. .

Abstract

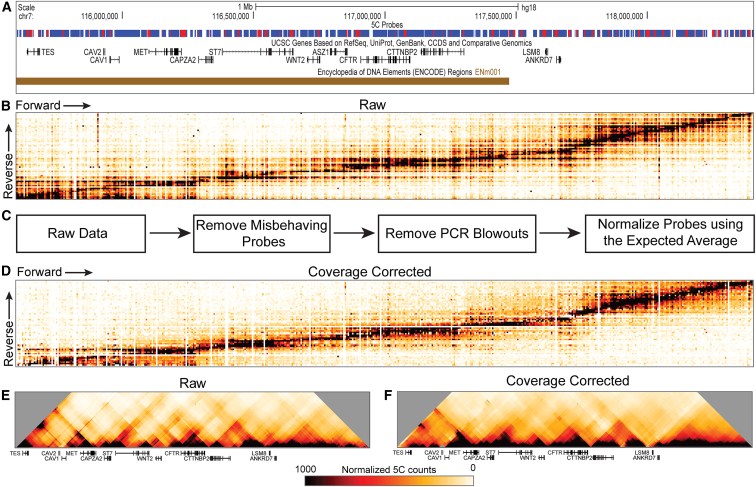
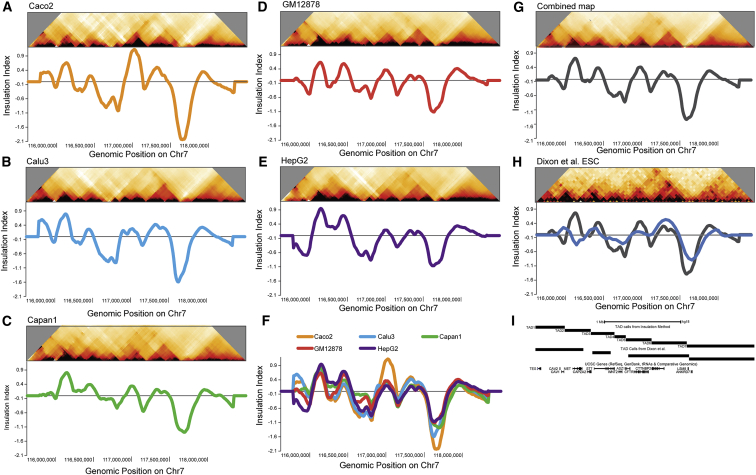
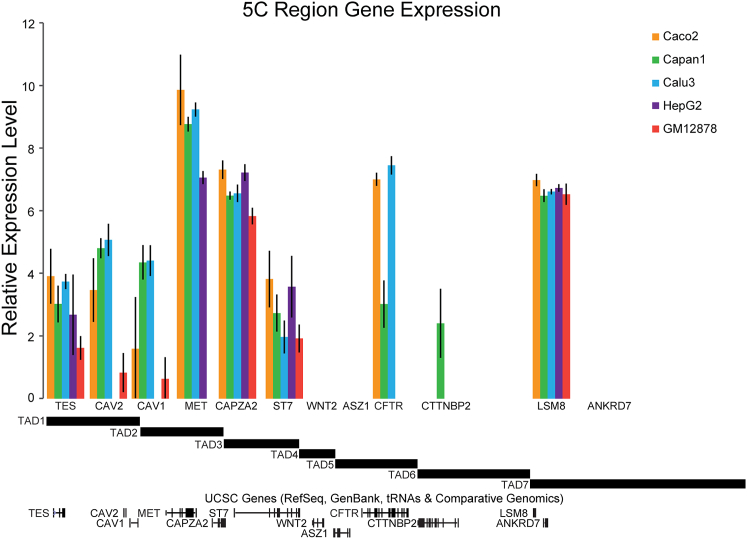
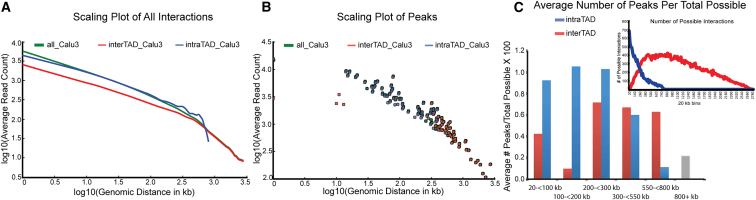
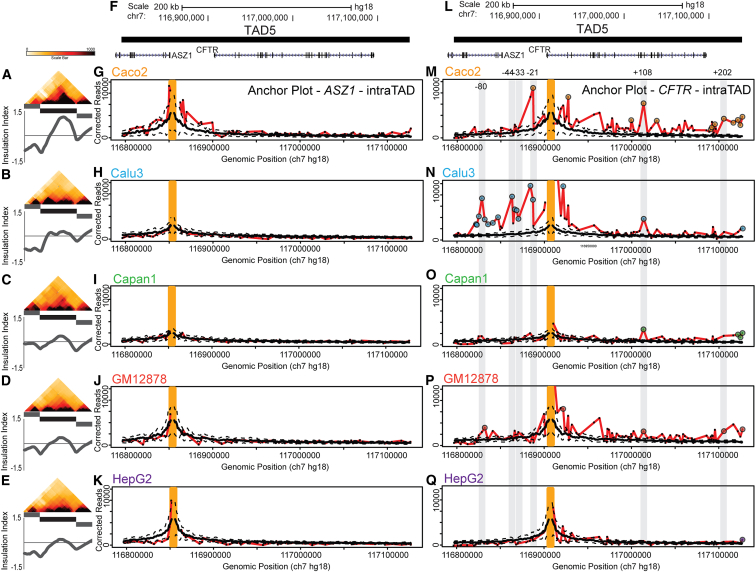
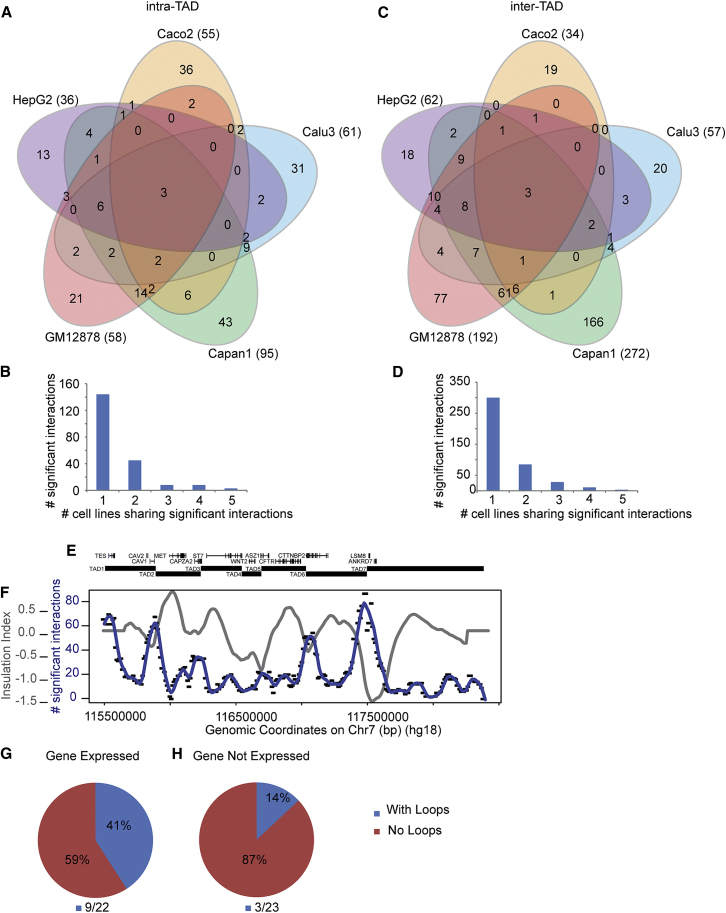
Three-dimensional genome structure plays an important role in gene regulation. Globally, chromosomes are organized into active and inactive compartments while, at the gene level, looping interactions connect promoters to regulatory elements. Topologically associating domains (TADs), typically several hundred kilobases in size, form an intermediate level of organization. Major questions include how TADs are formed and how they are related to looping interactions between genes and regulatory elements. Here we performed a focused 5C analysis of a 2.8 Mb chromosome 7 region surrounding CFTR in a panel of cell types. We find that the same TAD boundaries are present in all cell types, indicating that TADs represent a universal chromosome architecture. Furthermore, we find that these TAD boundaries are present irrespective of the expression and looping of genes located between them. In contrast, looping interactions between promoters and regulatory elements are cell-type specific and occur mostly within TADs. This is exemplified by the CFTR promoter that in different cell types interacts with distinct sets of distal cell-type-specific regulatory elements that are all located within the same TAD. Finally, we find that long-range associations between loci located in different TADs are also detected, but these display much lower interaction frequencies than looping interactions within TADs. Interestingly, interactions between TADs are also highly cell-type-specific and often involve loci clustered around TAD boundaries. These data point to key roles of invariant TAD boundaries in constraining as well as mediating cell-type-specific long-range interactions and gene regulation.

Keywords: CFTR; chromatin looping; gene regulation; topologically associating domain.


Figures

Figure 1
Figure 1
Generation of 5C Chromatin Interaction Maps (A) 5C region showing probe design. Red fragments represent reverse probes. Blue fragments represent forward probes. (B) Raw 5C data plotted as all reverse primers versus all forward primers. Color scale: white to orange to red to black, where white represents no detected interaction frequency and black represents the highest interaction frequency. (C) Steps in our data-correction pipeline. Misbehaving probes are removed first, then PCR blowouts are removed. The final step normalizes all probes to each other (coverage correction). For full details, see Material and Methods. (D) 5C data after coverage correction. White stripes running through the heatmap indicate misbehaving primers that were removed in the correction steps. (E) Binned heatmap of raw data, before they were run through the correction pipeline. (F) Binned final 5C data after data correction. Data are binned in 100 kb windows with a 10x step. All heatmaps are plotted on the same scale throughout the paper, unless indicated.
Figure 2
Figure 2
Detection of TADs via Insulation Profiles (A–E) Heatmaps and corresponding insulation profiles for each cell line: Caco2, Calu3, Capan1, GM12878, and HepG2. Minima in the profiles represent boundaries between two TADs. (F) The insulation profiles for all five cell lines are plotted in one graph. (G) The heatmap is a combined map of all our data. Below is the average insulation profile of all the data. (H) Our insulation index method run on human embryonic stem cell Hi-C data from Dixon et al., 2012. This heatmap is binned as in the Dixon et al. paper with 40 kb bins. Its color scale is from 0 to 35. (I) The 5C region TAD calls based on our insulation profile are compared with the TAD calls made with the method in Dixon et al.
Figure 3
Figure 3
Gene Expression within the 5C Region Is Not Related to TAD Structure Relative gene expression is plotted for the five cell types studied. The TAD structure of the locus is shown below the graph for reference.
Figure 4
Figure 4
Significant and Strong Long-Range Interactions Occur Mostly within TADs (A) Scaling plot showing the average read count versus genomic distance in Calu3 cells. Interactions from the whole dataset are green, interactions from the intra-TAD space are blue, and interactions from the inter-TAD space are red. (B) Scaling plot showing only significant long-range interactions in the three different spaces in Calu3 cells. Coloring is the same as in (C). Scaling plots for all cell lines are shown in Figure S12. (C) The number of significant interactions (across all cell types) is plotted for different genomic distances; only the intra-TAD and inter-TAD data are used. Significant long-range inter-TAD interactions between loci separated by less than 20 kb are not included because these represent regions around TAD boundaries that are particularly frequently involved in interactions (see Figure 6F). Inset: The total number of interrogated interactions for intra-TAD (blue) and inter-TAD (red) datasets is plotted versus genomic distance.
Figure 5
Figure 5
CFTR Regulatory Elements Are Contained within One TAD (A–E) Zoomed-in view of the 5C chromatin interaction map. TAD5 is highlighted by the black bar. Insulation profiles for each heatmap section are displayed below each heatmap. (F and L) Genome browser snapshot of TAD5, showing the two genes ASZ1 and CFTR located in the TAD. (G–K) 3C-style chromatin interaction profile anchored on the ASZ1 promoter (probe REV_404). This gene is not expressed in any of the five cell lines. (M–Q) 3C-style chromatin-interaction profile anchored on the CFTR promoter (REV_421). This gene is expressed in Caco2, Calu3, and Capan1 cell lines. For (G–K) and (M–Q), the orange bar represents the location of the anchoring interaction. The dotted black lines represent the Loess standard deviation, and the thick black line represents the Loess average. The red line represents the interactions of the genomic fragment indicated by the orange line with all other interrogated fragments in the region. Significant interactions are indicated by large circles. Grey lines and genomic coordinates indicate locations (kb from the promoter) of known CFTR enhancer elements.
Figure 6
Figure 6
Most Interactions Are Cell-Type Specific (A) Venn diagram showing all significant interactions detected in the five cell types in the intra-TAD space. (B) Bar graph displaying how many significant intra-TAD interactions are shared between cell types. (C) Venn diagram showing all significant interactions detected in the five cell types in inter-TAD space. (D) Bar graph displaying how many significant inter-TAD interactions are shared between cell types. (E) Diagram of the region under study; genes and TADs are indicated, and the diagram is aligned with the plot in (F). (F) Plot displaying the average insulation profile (gray) and the average number of significant inter-TAD interactions for loci along the region (blue line, 100 kb window, step size 10 kb). TAD boundaries (minima in insulation profile) display high levels of inter-TAD interactions. (G) Pie chart showing the number of expressed genes that show significant looping interactions in our datasets. (H) Pie chart showing the number of non-expressed genes that show significant looping in our datasets.

References

    1. Bickmore W.A., van Steensel B. Genome architecture: Domain organization of interphase chromosomes. Cell. 2013;152:1270–1284. - PubMed
    1. Fraser P., Bickmore W. Nuclear organization of the genome and the potential for gene regulation. Nature. 2007;447:413–417. - PubMed
    1. Bolzer A., Kreth G., Solovei I., Koehler D., Saracoglu K., Fauth C., Müller S., Eils R., Cremer C., Speicher M.R., Cremer T. Three-dimensional maps of all chromosomes in human male fibroblast nuclei and prometaphase rosettes. PLoS Biol. 2005;3:e157. - PMC - PubMed
    1. Cremer T., Cremer C. Chromosome territories, nuclear architecture and gene regulation in mammalian cells. Nat. Rev. Genet. 2001;2:292–301. - PubMed
    1. Branco M.R., Pombo A. Intermingling of chromosome territories in interphase suggests role in translocations and transcription-dependent associations. PLoS Biol. 2006;4:e138. - PMC - PubMed

Publication types

MeSH terms

Substances