. 2016 Jan 12;14(2):255-68.
doi: 10.1016/j.celrep.2015.12.028. Epub 2015 Dec 31.

p75 Neurotrophin Receptor Regulates Energy Balance in Obesity

Affiliations

p75 Neurotrophin Receptor Regulates Energy Balance in Obesity

Bernat Baeza-Raja et al. Cell Rep. .

Abstract

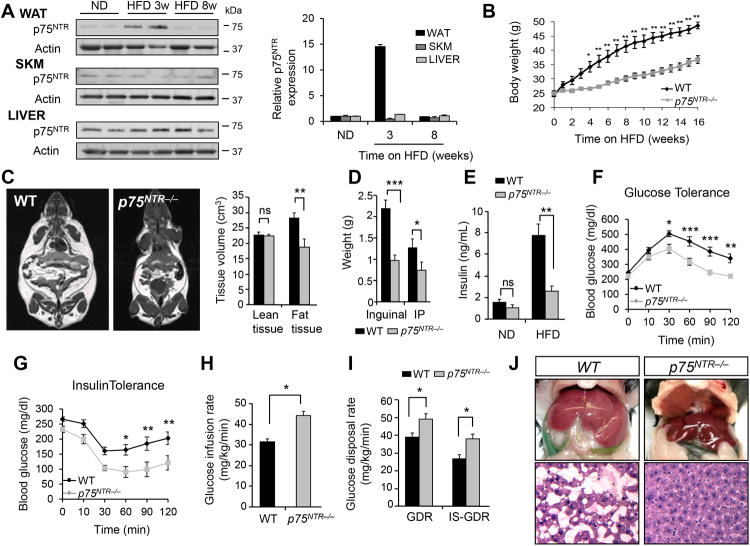
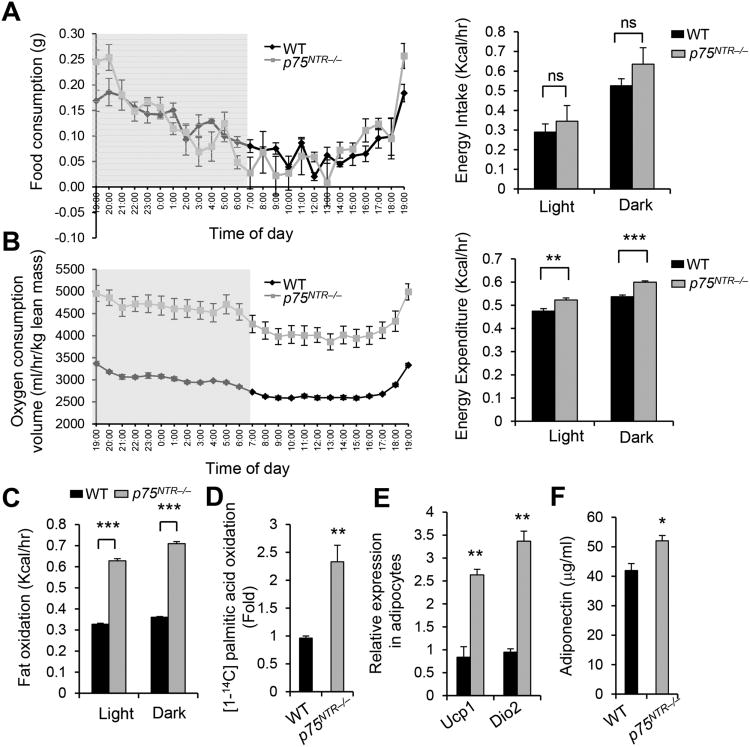
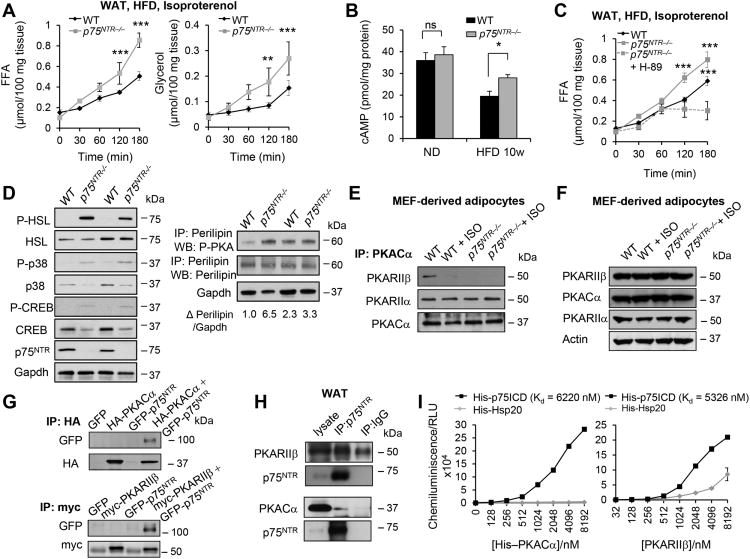
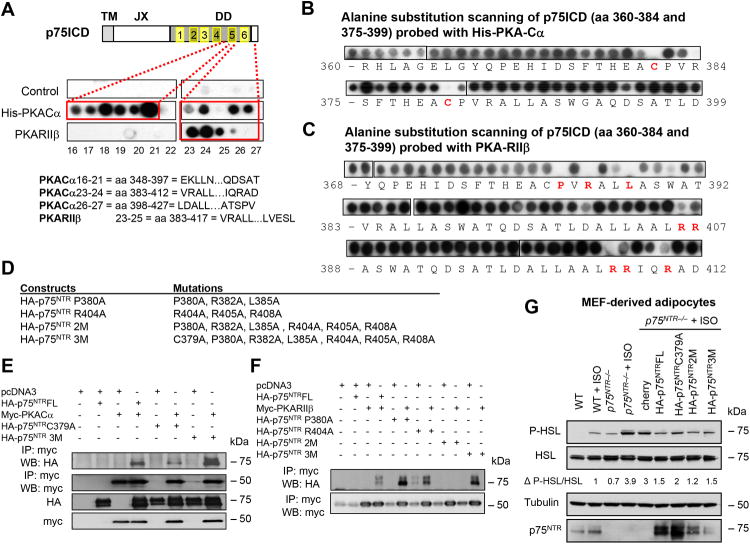
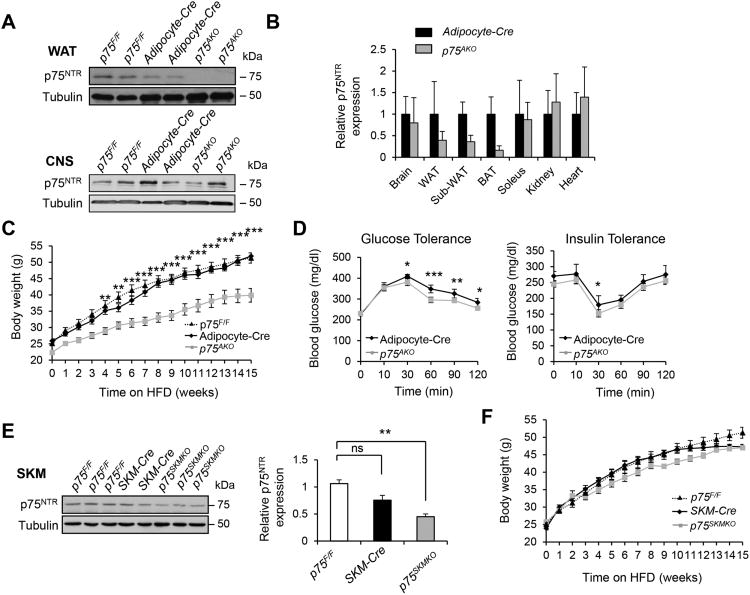
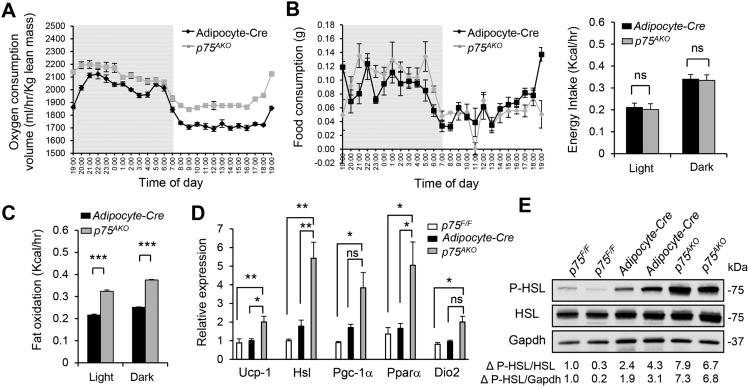
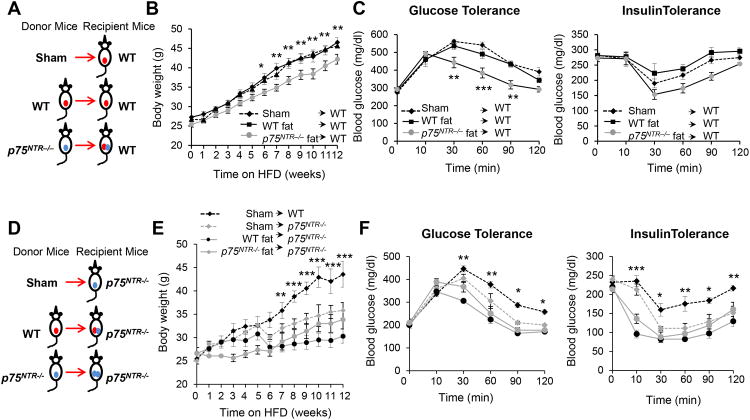
Obesity and metabolic syndrome reflect the dysregulation of molecular pathways that control energy homeostasis. Here, we show that the p75 neurotrophin receptor (p75(NTR)) controls energy expenditure in obese mice on a high-fat diet (HFD). Despite no changes in food intake, p75(NTR)-null mice were protected from HFD-induced obesity and remained lean as a result of increased energy expenditure without developing insulin resistance or liver steatosis. p75(NTR) directly interacts with the catalytic subunit of protein kinase A (PKA) and regulates cAMP signaling in adipocytes, leading to decreased lipolysis and thermogenesis. Adipocyte-specific depletion of p75(NTR) or transplantation of p75(NTR)-null white adipose tissue (WAT) into wild-type mice fed a HFD protected against weight gain and insulin resistance. Our results reveal that signaling from p75(NTR) to cAMP/PKA regulates energy balance and suggest that non-CNS neurotrophin receptor signaling could be a target for treating obesity and the metabolic syndrome.


Figures

Figure 1
Figure 1. p75NTR Deficiency Protects Mice from HFD-Induced Obesity and Metabolic Syndrome
(A) p75NTR protein (left) and RNA (right) expression in WAT, skeletal muscle (SKM), and liver from WT and p75NTR−/− mice on ND (normal diet) and, 3 and 8 weeks on HFD. Representative immunoblot is shown from three independent experiments. (B) Body weight of WT and p75NTR−/− mice on HFD (*P < 0.01, **P < 0.001, two-way ANOVA; n = 7 mice per group). (C) Representative MRI images of WT and p75NTR−/− mice on HFD (left) and tissue volumes of WT and p75NTR-/- mice on HFD (right) (**P < 0.01, ns: not significant, unpaired Student's t-test; n = 7 mice per group). (D) Weights of WT and p75NTR−/− inguinal and intraperitoneal (IP) fat on HFD (*P < 0.05, ***P < 0.001, unpaired Student's t-test; n = 7 mice per group). (E) Basal insulin levels from WT and p75NTR−/− mice (**P < 0.01, ns, unpaired Student's t-test; n= 4 mice per group). (F) Glucose and (G) insulin tolerance test in WT (n = 13) and p75NTR−/− (n = 8) mice after 20weeks on HFD (*P < 0.05, **P < 0.01, ***P < 0.001, two-way ANOVA). (H) Glucose infusion rates from WT (n = 5) and p75NTR−/− (n = 7) mice on HFD (*P < 0.05, unpaired Student's t-test). (I) Total and insulin-stimulated glucose disposal rate (GDR) of WT (n = 5) and p75NTR-/- (n = 7) mice on HFD (*P < 0.05, unpaired Student's t-test). (J) Representatives photographs (top) and histological images (bottom) of livers from WT and p75NTR−/− mice on HFD (n = 3 mice per group). See also Figures S1 and S2.
Figure 2
Figure 2. p75NTR Deficiency Increases Energy Expenditure, Fat Oxidation, and Lipolysis
(A) Food consumption (left) and energy intake (right) of WT (n = 7) and p75NTR−/− (n = 8) mice on HFD (ns: not significant, unpaired Student's t-test). (B) Oxygen consumption (left) and energy expenditure (right) normalized to lean body mass in WT (n = 7) and p75NTR−/− (n = 8) mice on HFD (**P < 0.01, ***P < 0.001, Student's t-test). (C) Fat oxidation normalized to lean body mass in WT and p75NTR−/− mice on HFD (***P < 0.001, unpaired Student's t-test; n = 6 mice per group). (D) Oxidation of [1-14C]-palmitate to 14CO2 by adipocytes isolated from WT and p75NTR-/- mice (**P < 0.01, unpaired Student's t-test). Results are from three independent experiments. (E) Ucp1 and Dio2 RNA expression in primary adipocytes from WT and p75NTR−/− mice (**P <0.01, unpaired Student's t-test; n = 6 mice per group). (F) Serum levels of adiponectin in WT and p75NTR−/− mice on HFD (*P < 0.05, unpairedStudent's t-test; n = 3 mice per group). See also Figures S3 and S4.
Figure 3
Figure 3. p75NTR Regulates Lipolysis via cAMP/PKA Signaling
(A) Isoproterenol-stimulated FFA and glycerol levels in WAT from WT and p75NTR−/− mice on HFD (**P < 0.01, ***P < 0.001, two-way ANOVA; n = 8 mice per group). (B) cAMP accumulation in WAT from WT and p75NTR−/− mice on normal chow (ND) or 10 weeks on HFD (*P < 0.05, ns: not significant, unpaired Student's t-test; n = 4 mice per group). (C) FFA levels in WAT treated with the PKA inhibitor, H-89 from WT, and p75NTR−/− mice on HFD (WT or p75NTR−/− vs p75NTR−/− treated with H-89, ***P < 0.001, two-way ANOVA; n = 5 mice per group). (D) P-HSL, HSL, P-p38, p38, P-CREB, CREB, and p75NTR protein expression (left) and immunoprecipitation of lysates with anti-perilipin followed by Western blotting with anti-phospho-PKA(p-PKA) to detect all PKA-phosphorylation sites on perilipin and total perilipin expression (n = 2 mice per group) (right) in WAT from WT and p75NTR−/− mice on HFD. Phospho-perilipin levels normalized to GAPDH were quantified by densitometry (Δ represents fold changes). Representative immunoblots are shown from n = 12 mice per group. (E) Immunoprecipitation of PKA-Cα protein followed by Western blotting to detect PKA RIIβ and RIIα from WT and p75NTR−/− MEF-derived adipocytes treated or not with isoproterenol (ISO). Representative immunoblot from three independent experiments. (F) PKA-Cα, PKA-RIIβ, and PKA-RIIα protein expression in WT and p75NTR−/− MEF-derivedadipocytes. Representative immunoblots from three independent experiments. (G) Immunoprecipitation of HA-PKA-Cα protein (top) and myc-PKA-RIIβ (bottom) followed by Western blotting to detect GFP-p75NTR in 293T cells overexpressing indicated constructs. Representative immunoblots from three independent experiments. (H) Immunoprecipitation of PKA-RIIβ (top) and PKA-Cα (bottom) protein followed by Western blotting to detect p75NTR in WAT from WT mice. Representative immunoblots from three independent experiments. (I) ELISA binding assays between recombinant His-p75ICD and increasing concentrations of His-PKA-Cα (left) and PKA-RIIβ (right). His-Hsp20 was used as a control. Results are from 3 independent experiments performed with duplicates. Kd values were estimated using a one-site binding model. See also Figure S5.
Figure 4
Figure 4. p75NTR Interacts with the PKA Catalytic (Cα) Subunit to Regulate Lipolysis
(A) Peptide array mapping of the p75ICD sites required for the interaction with PKA-Cα and PKA-RIIβ. Schematic diagram of p75ICD shows the domain organization and peptide location, length, and sequences. (B) Alanine scanning substitution arrays of the identified interacting p75NTR peptides 360–384 and 375–399 probed with PKA-Cα. Red amino acids indicate substitutions that block the interaction. (C) Alanine scanning substitution arrays of interacting p75NTR peptides 368–392, 383–407, and 388–412 probed with PKA-RIIβ. Highlighted in red are the amino acids whose substitution blocks the interaction. (D) p75NTR mutant constructs generated. (E) Immunoprecipitation of myc-PKA-Cα protein followed by Western blotting to detect HA-p75NTR wild-type and HA-p75NTRC379A or HA-p75NTR 3M in 293T cells overexpressing indicated constructs. Representative immunoblots are shown from three independent experiments. (F) Immunoprecipitation of myc-PKA-RIIβ protein followed by Western blotting to detect HA-p75NTR wild-type and HA-p75NTR P380A, HA-p75NTR R404A, HA-p75NTR 2M, or HA-p75NTR 3M in 293T cells overexpressing indicated constructs. Representative immunoblots from three independent experiments. (G) P-HSL, HSL, and p75NTR protein expression in WT and p75NTR−/− MEF-derived adipocytes infected with lentiviral vectors overexpressing the indicated constructs and treated or not with isoproterenol (ISO). Representative immunoblots from three independent experiments. See also Figure S6.
Figure 5
Figure 5. p75NTR Deficiency in WAT Protects Mice from HFD-induced Obesity and Insulin Resistance
(A) p75NTR protein expression in WAT and the central nervous system (CNS) from p75F/F, Adipocyte-cre, and p75AKO mice. Representative blot is shown from two independent experiments (n = 5 mice per group). (B) p75NTR expression in brain, WAT (epididymal fat), SUBC (subcutaneous inguinal fat), BAT (brown adipose tissue), Soleus (skeletal muscle), kidney, and heart from Adipocyte-cre and p75AKO mice (n = 5 mice per group). (C) Body weight of p75F/F (n = 18), Adipocyte-cre (n = 7), and p75AKO (n = 10) mice on HFD (**P < 0.01, *** P < 0.001, two-way ANOVA). (D) Glucose (left) and insulin tolerance (right) tests in Adipocyte-cre (n = 7) and p75AKO (n = 10) mice after 8 weeks on HFD (*P < 0.05, **P < 0.01, ***P < 0.001, two-way ANOVA). (E) p75NTR protein expression in skeletal muscle from p75F/F (n = 3), SKM-cre (n = 2), andp75SKMKO mice (left) (n = 3). Quantifications of Western blot analysis for p75NTR in skeletal muscle from p75F/F, MCK-cre, and p75 SKMKO mice (ns, not significant; *P < 0.05, Tukey'smultiple comparisons test one-way ANOVA analysis) (right). (F) Body weight of p75F/F (n = 18), SKM-cre (n = 10), and p75 SKMKO (n = 15) mice on HFD (notsignificant, two-way ANOVA). See also Figure S7.
Figure 6
Figure 6. p75NTR Deficiency in WAT Increases Thermogenesis and Lipolysis
(A) Oxygen consumption normalized to lean body mass in Adipocyte-cre and p75AKO mice on HFD (n = 6 mice per group). (B) Food consumption (left) and energy intake (right) of Adipocyte-cre (n = 10) and p75AKO (n = 12) mice over 4 days after 10 weeks of HFD (ns: not significant, unpaired Student's t-test). (C) Fat oxidation normalized to lean body mass in Adipocyte-cre and p75AKO mice on HFD (***P < 0.001, unpaired Student's t test; n = 6 mice per group). (D) Ucp1, Hsl, Pgc-1α, Pparα, and Dio2 RNA expression in WAT from p75F/F, Adipocyte-cre, and p75AKO mice on HFD (ns: not significant, *P < 0.05, **P < 0.01, Tukey's multiple comparisons test one-way ANOVA analysis; n = 4 mice per group). (E) P-HSL and HSL protein expression in WAT from p75F/F (n = 2), Adipocyte-cre (n = 3), andp75AKO (n = 2) mice on HFD. See also Figure S7.
Figure 7
Figure 7. p75NTR-deficient WAT Transplantation Reduces Body Weight and Insulin Resistance
(A) Schematic of fat transplantation for WT mice. Epididymal fat from p75NTR−/−, WT, and no fat (sham) was transplanted in WT mice. All animals after surgery were fed a HFD. (B) Body weight of WT mice transplanted with p75NTR−/− fat (n = 9), WT fat (n = 9) and sham (n = 5). (WT→WT vs p75NTR−/−→WT, *P < 0.05, **P < 0.01 by two-way ANOVA). (C) Glucose (left) and insulin tolerance (right) tests in WT-transplanted mice after 8 weeks on HFD. (p75NTR−/− →WT vs WT→WT, **P < 0.01, ***P < 0.001 by two-way ANOVA; n = 4). (D) Schematic of fat transplantation. Epididymal fat from p75NTR−/−, WT, and no fat (sham) was transplanted in p75NTR−/− mice. All animals after surgery were fed a HFD. (E) Body weight of WT and p75NTR−/− mice transplanted with p75NTR−/− (n = 9) or WT fat (n = 9)and sham-operated (n = 4). (WT sham vs WT→ p75NTR−/− **P < 0.01, ***P < 0.001, two-way ANOVA). (F) Glucose (left) and insulin tolerance (right) tests in recipient mice after 10 weeks of HFD (WT sham vs WT→ p75NTR−/−, *p < 005, **P < 0.01, ***P < 0001, two-way ANOVA; n = 4 mice per group).

References

    1. Ahmadian M, Abbott MJ, Tang T, Hudak CS, Kim Y, Bruss M, Hellerstein MK, Lee HY, Samuel VT, Shulman GI, Wang Y, Duncan RE, Kang C, Sul HS. Desnutrin/ATGL is regulated by AMPK and is required for a brown adipose phenotype. Cell Metab. 2011;13:739–748. - PMC - PubMed
    1. Ahmadian M, Duncan RE, Sul HS. The skinny on fat: lipolysis and fatty acid utilization in adipocytes. Trends Endocrinol Metab. 2009;20:424–428. - PMC - PubMed
    1. Baeza-Raja B, Eckel-Mahan K, Zhang L, Vagena E, Tsigelny IF, Sassone-Corsi P, Ptacek LJ, Akassoglou K. p75 neurotrophin receptor is a clock gene that regulates oscillatory components of circadian and metabolic networks. J Neurosci. 2013;33:10221–10234. - PMC - PubMed
    1. Baeza-Raja B, Li P, Le Moan N, Sachs BD, Schachtrup C, Davalos D, Vagena E, Bridges D, Kim C, Saltiel AR, Olefsky JM, Akassoglou K. p75 neurotrophin receptor regulates glucose homeostasis and insulin sensitivity. Proc Natl Acad Sci U S A. 2012;109:5838–5843. - PMC - PubMed
    1. Baillie GS, Scott JD, Houslay MD. Compartmentalisation of phosphodiesterases and protein kinase A: opposites attract. FEBS Lett. 2005;579:3264–3270. - PubMed

Publication types

Substances