. 2016 Jan 12;14(2):310-9.
doi: 10.1016/j.celrep.2015.12.031. Epub 2015 Dec 31.

Elucidating MicroRNA Regulatory Networks Using Transcriptional, Post-transcriptional, and Histone Modification Measurements

Affiliations

Elucidating MicroRNA Regulatory Networks Using Transcriptional, Post-transcriptional, and Histone Modification Measurements

Sara J C Gosline et al. Cell Rep. .

Abstract

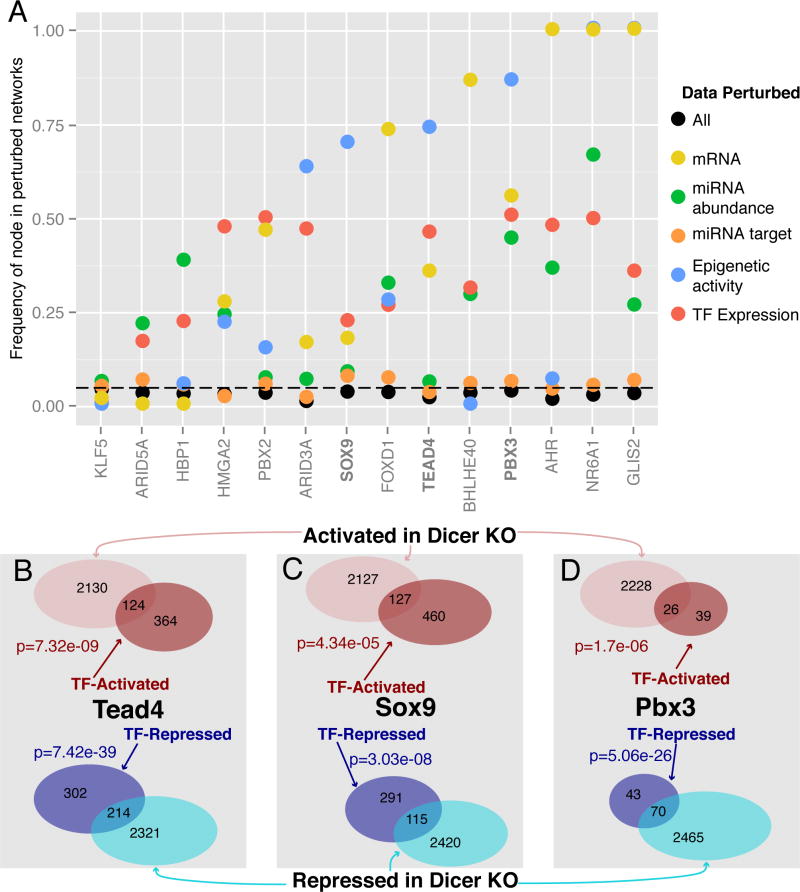
MicroRNAs (miRNAs) regulate diverse biological processes by repressing mRNAs, but their modest effects on direct targets, together with their participation in larger regulatory networks, make it challenging to delineate miRNA-mediated effects. Here, we describe an approach to characterizing miRNA-regulatory networks by systematically profiling transcriptional, post-transcriptional and epigenetic activity in a pair of isogenic murine fibroblast cell lines with and without Dicer expression. By RNA sequencing (RNA-seq) and CLIP (crosslinking followed by immunoprecipitation) sequencing (CLIP-seq), we found that most of the changes induced by global miRNA loss occur at the level of transcription. We then introduced a network modeling approach that integrated these data with epigenetic data to identify specific miRNA-regulated transcription factors that explain the impact of miRNA perturbation on gene expression. In total, we demonstrate that combining multiple genome-wide datasets spanning diverse regulatory modes enables accurate delineation of the downstream miRNA-regulated transcriptional network and establishes a model for studying similar networks in other systems.


Figures

Fig 1
Fig 1
Transcription drives gene expression changes following miRNA loss. (A) Log2 fold change of genes that exhibit significant (q<0.05) change in ribo-depleted exon-aligned reads from WT vs. KO cells (x-axis) compared to fold change of intronic reads aligned to same genes (y-axis); regression line drawn in blue. (B) Log2 fold change of polyA-collected reads from WT vs. KO cells (x-axis) from significantly (q<0.05) changing genes compared to changes in reads aligned to introns from the ribo-depleted libraries (y-axis).
Fig. 2
Fig. 2
CDFs of miRNA targets upon global miRNA loss. (A) Mature mRNA expression changes according to exonic reads of total RNA of direct miRNA targets (blue) compared to non-targets (grey) upon Dicer KO. (B) Mature mRNA expression of direct miRNA targets by polyA-tagged mRNA (C) Δexon-Δintron values of direct miRNA targets representing differences in exonic measurements versus intronic measurements of miRNA targets (blue) compared to non-targets (grey).
Fig. 3
Fig. 3
Histone marks illustrate collaboration between transcriptional and post-transcriptional regulatory modes with distinct impacts of gene expression. (A) Cumulative distribution plot of groups of genes defined by their mode of regulation, with colors and counts indicated by inset Venn diagram; grey represents genes without evidence of transcriptional or miRNA regulation. (B) Fraction of genes within each fold change bracket belonging to each class. (C) Distribution of Δexon - Δintron log2 fold change values of genes according to mode of regulation.
Fig. 4
Fig. 4
Implementation of hierarchical network algorithm. The network structure weights edges according to five types of data representing changes incurred upon miRNA loss. Legend inset.
Fig. 5
Fig. 5
The predicted network implicates 14 transcription factors (triangles) in activating mRNA (red circles) and repressing mRNA (blue circles) downstream of expressed miRNAs (squares). Legend inset.
Fig. 6
Fig. 6
Computational and experimental validation of selected transcriptional factors. (A) Results of computational network perturbation indicating how frequently the algorithm-selected transcription factors showed up when either individual (colored) data sources were perturbed or all (black) data sources were perturbed. (B–D) Genes with significant (q<0.05) changes in intronic RNA levels that are activated (red) and repressed (blue) upon over-expression of (B) Flag-HA-Tead4, (C) Flag-HA-Sox9, and (D) Flag-HA-Pbx3 are significantly enriched in genes with intronic log2 RNA changes > 0.5 (pink) or less than −0.5 (cyan) in the Dicer KO. P-values computed via Fisher’s exact test.

References

    1. Afshar AS, Xu J, Goutsias J. Integrative Identification of Deregulated MiRNA/TF-Mediated Gene Regulatory Loops and Networks in Prostate Cancer. PLoS One. 2014;9:e100806. doi: 10.1371/journal.pone.0100806. - DOI - PMC - PubMed
    1. Agarwal V, Bell GW, Nam JW, Bartel DP. Predicting effective microRNA target sites in mammalian mRNAs. Elife. 2015;4:e05005. doi: 10.7554/eLife.05005. - DOI - PMC - PubMed
    1. Anders S, Huber W. Differential expression analysis for sequence count data. Genome Biol. 2010;11:R106. doi: 10.1186/gb-2010-11-10-r106. - DOI - PMC - PubMed
    1. Baek D, Villén J, Shin C, Camargo FD, Gygi SP, Bartel DP. The impact of microRNAs on protein output. Nature. 2008;455:64–71. doi: 10.1038/nature07242. - DOI - PMC - PubMed
    1. Bernstein BE, Stamatoyannopoulos JA, Costello JF, Ren B, Milosavljevic A, Meissner A, Kellis M, Marra MA, Beaudet AL, Ecker JR, Farnham PJ, Hirst M, Lander ES, Mikkelsen TS, Thomson JA. The NIH Roadmap Epigenomics Mapping Consortium. Nat Biotechnol. 2010;28:1045–8. doi: 10.1038/nbt1010-1045. - DOI - PMC - PubMed