. 2016 Jan 12;14(2):380-9.
doi: 10.1016/j.celrep.2015.12.021. Epub 2015 Dec 31.

Simultaneous Multiplexed Measurement of RNA and Proteins in Single Cells

Affiliations

Simultaneous Multiplexed Measurement of RNA and Proteins in Single Cells

Spyros Darmanis et al. Cell Rep. .

Abstract

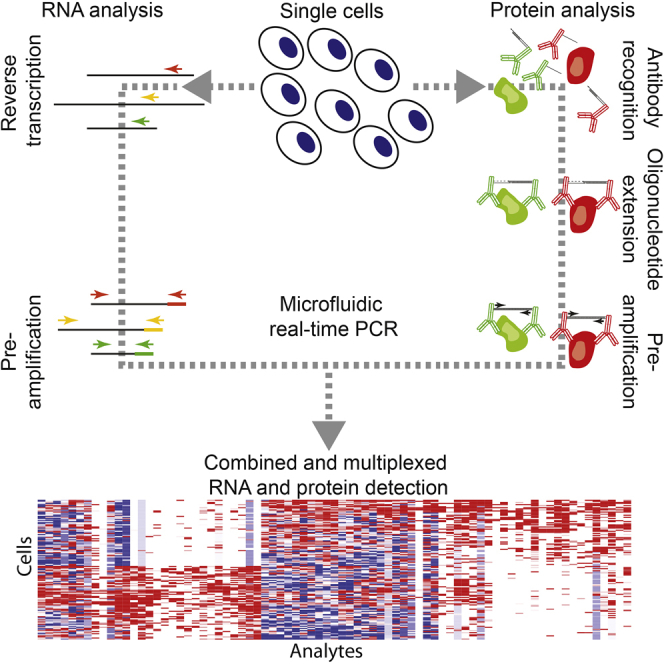
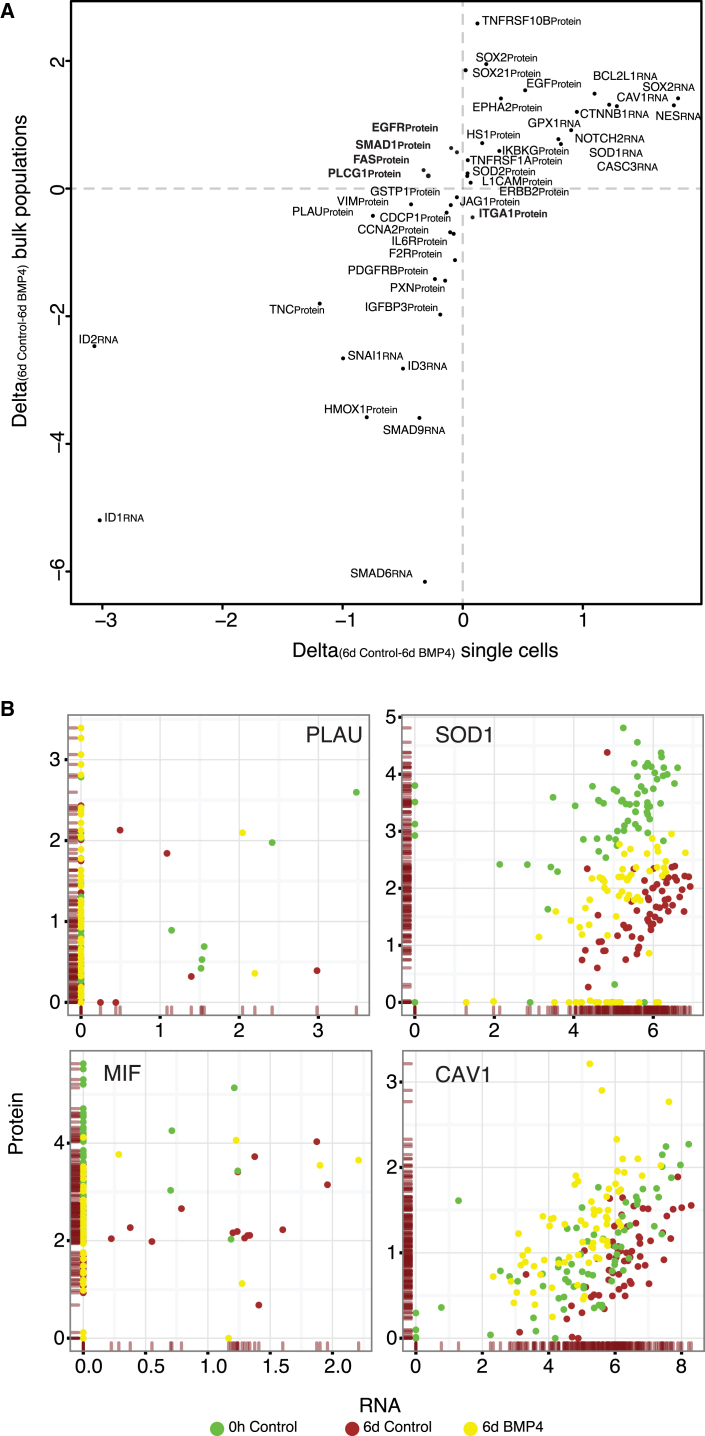
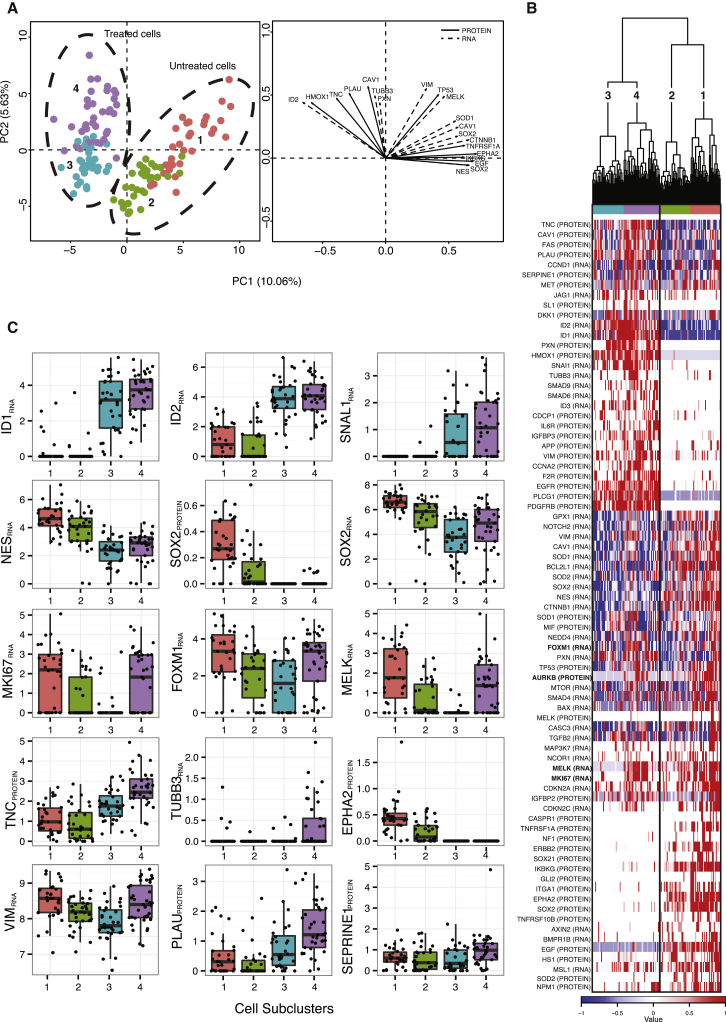
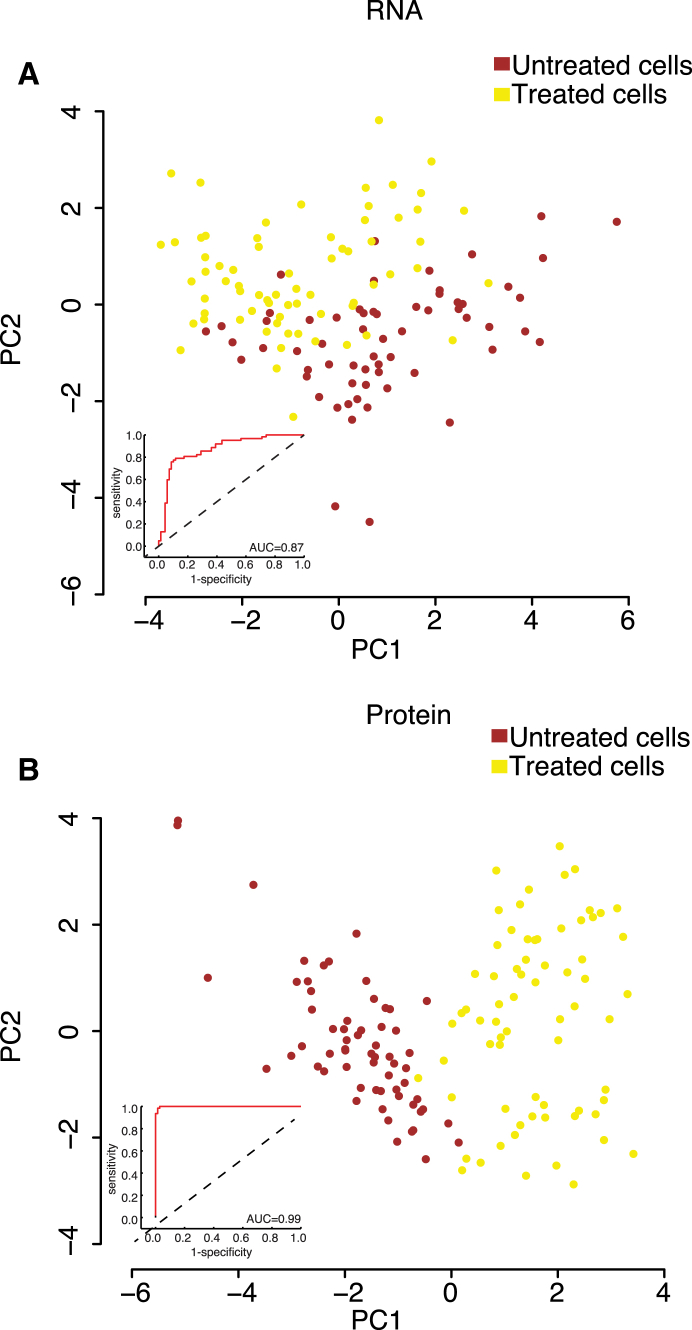
Significant advances have been made in methods to analyze genomes and transcriptomes of single cells, but to fully define cell states, proteins must also be accessed as central actors defining a cell's phenotype. Methods currently used to analyze endogenous protein expression in single cells are limited in specificity, throughput, or multiplex capability. Here, we present an approach to simultaneously and specifically interrogate large sets of protein and RNA targets in lysates from individual cells, enabling investigations of cell functions and responses. We applied our method to investigate the effects of BMP4, an experimental therapeutic agent, on early-passage glioblastoma cell cultures. We uncovered significant heterogeneity in responses to treatment at levels of RNA and protein, with a subset of cells reacting in a distinct manner to BMP4. Moreover, we found overall poor correlation between protein and RNA at the level of single cells, with proteins more accurately defining responses to treatment.


Figures

None
Graphical abstract
Figure 1
Figure 1
Experimental Approach and Validation (A) Illustration of the experimental approach. Single cells are isolated by FACS and lysed immediately. Cell lysates are split for subsequent protein and RNA analysis by PEA and gene-targeted TaqMan assays, respectively. (B) Standard curves of sorted 1,000, 100, and 10 U3035MG cells plus no cell control (blank) for select PEA assays. The circle and triangle data points represent biological replicates. The red horizontal bar denotes the mean background value, whereas the dashed lines are the mean ± 3 SD. y axis values represent extension control normalized Cq values. See also Figure S1. (C) Coefficient of variation analysis of n = 40 split U3035MG single cells, where both halves were analyzed with the same PEA single cell protein panel. The coefficient of variation of each assay is plotted as a function of the number cells, out of a total 40 cells, in which the assay generated a detectable signal cells (top left). The top right panel shows the correlation between the mean values for each protein assay, comparing cell half 1 and 2 for each cell. The bottom panel shows the correlation coefficients between each of the two lysate aliquots, calculated for each cell across all assays.
Figure 2
Figure 2
Analysis of Agreement between Averages of Single Cells and a Bulk Population Sample and Single-Cell RNA-Protein Correlations (A) Plot of the delta values (6d Control – 6d BMP4) for the means from the single cells (x axis) or the population controls (n = 150 cells) (y axis) sorted at the same time as the single cells (Pearson’s r = 0.68). Gene products that disagree between the average single and bulk controls are in bold. (B) Correlation plots between RNA and protein levels for selected analytes in all single cells belonging to the 0-hr untreated (green), day-6 untreated (red), and day-6 BMP4-treated (yellow) populations. Distributions of protein and RNA levels are shown as ticks on the y and x axes respectively. See also Figure S2.
Figure 3
Figure 3
Analysis of BMP4 Response in Glioblastoma Patient Cell Line U3035MG (A) PCA (left) and gene vector (right) plots for PC1 and PC2 for day-6 untreated and BMP4-treated cells, using combined normalized RNA and protein data. For the PCA plot, values for each marker in individual cells are reflected on a scale from blue to red. The colors and numbers at the top of the heatmap correspond to subclusters identified through the hierarchical clustering analysis shown in (B) with subclusters 1 (orange) and 2 (green) encompassing the day-6 untreated cells and subclusters 3 (turquoise) and 4 (purple) belonging to the day-6 BMP4-treated cells. Subclusters 1 and 4 primarily contain proliferationhigh cells. For the vector plot, vectors illustrate the ten most significant variables, measured at the level of RNA (dashed vector lines) or protein (solid vector lines), correlating with each of the first two principal components. The vector lengths represent the extent of correlation to each of the components. (B) Hierarchical clustering and heatmap of factors significantly (p < 0.001) associated with PC1 and PC2 from the PCA analysis shown in (A). (C) Boxplots of select RNA or protein factors divided by subcluster. Subclusters are identified by colors as described in (A). The y axis represent normalized Cq values subtracted from the normalized mean background − 2SD of the mean background. See also Figure S3.
Figure 4
Figure 4
Distinction of Treated and Untreated Cells Using RNA or Protein Expression Data PCA plots of BMP4 treated (yellow) and untreated cells (brown) at day 6 using expression of the same 22 genes, measured at the level of RNA (A) or protein (B), illustrating the relative ability of protein and RNA analyses to correctly identify whether cells had been treated with BMP4 or not. Insets show receiver-operating characteristic (ROC) curves derived by performing linear discriminant analysis of the first two principal components. AUC, area under the curve. See also Figure S4 for analysis including more principal components.

References

    1. Assarsson E., Lundberg M., Holmquist G., Björkesten J., Thorsen S.B., Ekman D., Eriksson A., Rennel Dickens E., Ohlsson S., Edfeldt G. Homogenous 96-plex PEA immunoassay exhibiting high sensitivity, specificity, and excellent scalability. PLoS ONE. 2014;9:e95192. - PMC - PubMed
    1. Bao S., Wu Q., McLendon R.E., Hao Y., Shi Q., Hjelmeland A.B., Dewhirst M.W., Bigner D.D., Rich J.N. Glioma stem cells promote radioresistance by preferential activation of the DNA damage response. Nature. 2006;444:756–760. - PubMed
    1. Bendall S.C., Simonds E.F., Qiu P., Amir A.D., Krutzik P.O., Finck R., Bruggner R.V., Melamed R., Trejo A., Ornatsky O.I. Single-cell mass cytometry of differential immune and drug responses across a human hematopoietic continuum. Science. 2011;332:687–696. - PMC - PubMed
    1. Carro M.S., Lim W.K., Alvarez M.J., Bollo R.J., Zhao X., Snyder E.Y., Sulman E.P., Anne S.L., Doetsch F., Colman H. The transcriptional network for mesenchymal transformation of brain tumours. Nature. 2010;463:318–325. - PMC - PubMed
    1. Dalerba P., Kalisky T., Sahoo D., Rajendran P.S., Rothenberg M.E., Leyrat A.A., Sim S., Okamoto J., Johnston D.M., Qian D. Single-cell dissection of transcriptional heterogeneity in human colon tumors. Nat. Biotechnol. 2011;29:1120–1127. - PMC - PubMed

Publication types