. 2016 Jan 7;61(1):68-83.
doi: 10.1016/j.molcel.2015.12.008. Epub 2015 Dec 31.

MDM2 Associates with Polycomb Repressor Complex 2 and Enhances Stemness-Promoting Chromatin Modifications Independent of p53

Affiliations

MDM2 Associates with Polycomb Repressor Complex 2 and Enhances Stemness-Promoting Chromatin Modifications Independent of p53

Magdalena Wienken et al. Mol Cell. .

Abstract

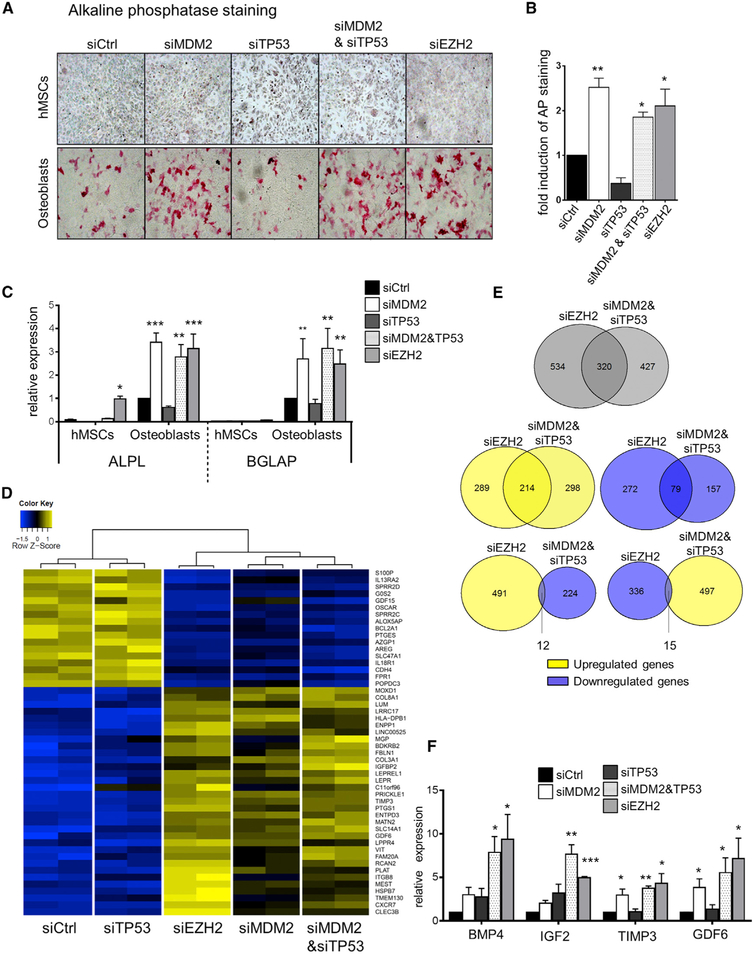
The MDM2 oncoprotein ubiquitinates and antagonizes p53 but may also carry out p53-independent functions. Here we report that MDM2 is required for the efficient generation of induced pluripotent stem cells (iPSCs) from murine embryonic fibroblasts, in the absence of p53. Similarly, MDM2 depletion in the context of p53 deficiency also promoted the differentiation of human mesenchymal stem cells and diminished clonogenic survival of cancer cells. Most of the MDM2-controlled genes also responded to the inactivation of the Polycomb Repressor Complex 2 (PRC2) and its catalytic component EZH2. MDM2 physically associated with EZH2 on chromatin, enhancing the trimethylation of histone 3 at lysine 27 and the ubiquitination of histone 2A at lysine 119 (H2AK119) at its target genes. Removing MDM2 simultaneously with the H2AK119 E3 ligase Ring1B/RNF2 further induced these genes and synthetically arrested cell proliferation. In conclusion, MDM2 supports the Polycomb-mediated repression of lineage-specific genes, independent of p53.


Figures

Figure 1.
Figure 1.. Mdm2 Is Required for Efficient iPS Cell Generation and PRC2 Target Gene Repression in Murine Embryonic Fibroblasts
(A) p53−/− and p53−/− Mdm2−/− MEFs were reprogrammed into induced pluripotent stem (iPS) cells by three factors (Oct4, Sox2, and Klf4; OSK). The number of obtained iPS colonies per MEFs was determined (mean ± SEM, n = 3). (B) p53−/−, p53−/− Mdm2−/−, and p53−/− Mdm2CA/CA (Mdm2CA/CA = Mdm2C462A/C462A) MEFs were analyzed via next-generation RNA sequencing, and differentially expressed genes are shown as a heatmap (ordered by p values). (C) qRT-PCR analysis of selected genes (mean ± SEM, n = 4). (D) Ezh2 was inhibited by 48 hr incubation with 5 μM EPZ6438, followed by qRT-PCR (mean ± SEM, n = 5). Above the bars, fold change and p values are indicated. Note that the fold change values between DMSO- and EPZ6438-treated cells are consistently lower in p53−/− Mdm2−/− MEFs, suggesting epistasis of Mdm2 and Ezh2. See also Figure S1 and Table S1, Table S2, Table S3, and Table S4.
Figure 2.
Figure 2.. MDM2 Hinders the Differentiation of Human Mesenchymal Stem Cells to Osteoblasts and Contributes to the Regulation of PRC2 Target Genes
(A) hMSC-Tert cells were depleted of MDM2 and/or p53 or EZH2 using siRNA, followed by the addition of osteoblast differentiation medium. At day 7, alkaline phosphatase (AP) activity was detected. (B) Quantification of AP activity from A (mean ± SEM, n = 3). (C and D) RNA from the differentiated osteoblasts was quantified by qRT-PCR (C, n = 3) and array hybridization. (D, n = 2; the genes are shown that were differentially regulated with the highest significance.) (E) Venn diagrams present overlapping gene sets that respond to EZH2 and MDM2 and p53 depletion. (F) qRT-PCR analysis of marker genes (mean ± SEM, n = 3). See also Figure S2 and Table S1, Table S3, Table S4, and Table S5.
Figure 3.
Figure 3.. MDM2 Represses PRC2 Target Genes and Promotes Survival of Tumor Cells
HCT116 p53−/− and MCF7 cells were depleted of MDM2 and EZH2. (A) HCT116 p53−/− cells were transfected at the time points 0 and 48 hr. At 96 hr, the cells were trypsinized and then seeded at equal numbers, followed by analysis of their proliferation. Either depletion reduces the proliferation of HCT116 p53−/− cells (mean ± SEM, n = 3). (B) The amount of MCF7 cells displaying clonogenic survival was reduced by depletion of MDM2 or EZH2, too, regardless of p53 coknockdown (mean ± SEM, n = 3). (C) Differential gene expression was determined via microarray analysis of HCT116 p53−/− cells. (n = 2; the most significantly regulated genes are shown; two different siRNAs were used for each gene) (D) Gene sets regulated by both MDM2 and EZH2 are depicted in Venn diagrams to show the overlap of co-regulated genes and the absence of genes with opposite regulation. (E and F) qRT-PCR analysis of selected genes (mean ± SEM, n = 3). See also Figure S3 and Table S1, Table S3, Table S4, and Table S6.
Figure 4.
Figure 4.. MDM2 Interacts with the PRC2 on Chromatin
(A) Endogenous MDM2, EZH2, and SUZ12 were coimmunoprecipitated from MG132-pretreated SJSA cells. Cell lysates (Input) and the immunoprecipitated (IP) material were analyzed by immunoblotting (IB). (B and C) Wild-type MDM2 was overexpressed by transfection, together with HA-tagged EZH2 (B) or Flag-tagged SUZ12(C) in H1299 cells, followed by IP and IB as in (A). Note that the Input in (B) was obtained after the addition of antibodies, explaining the appearance of an IgH band. Endogenous MDM2 was below the detection limit. (D) Domain mapping of the MDM2 interaction with EZH2, graphically summarized from Figures S4C-S4H. (E) PRC2 recruits Mdm2 to chromatin. Chromatin immunoprecipitation (ChIP) analysis of MDM2 on PRC2 target gene promoters after SJSA cells were transfected with siEZH2 or siControl (enrichment over IgG background; mean ± SEM; n = 3). (F) Mdm2 is recruited to the heterologous promoter by EZH2. HEK293 cells carrying an integrated upstream activation sequence (UAS) that binds Gal4 either contained a tetracyclin-inducible expression cassette for EZH2 fused to the Gal4 DNA binding domain, or a control gene (Hansen et al., 2008). Upon tetracyclin addition and transient overexpression of MDM2, ChIP was performed with antibodies to EZH2 and MDM2, followed by amplification of the UAS. See also Figure S4.
Figure 5.
Figure 5.. Mdm2 Is Required for H3K27 Trimethylation at Transcription Start Sites
(A and B) p53−/−, p53−/− Mdm2−/−, and p53−/− Mdm2CA/CA MEFs were subjected to targeted H3K27me3 (A) and EZH2 ChIP(B). ChIP levels around the TSSs of Mdm2/PRC2 target genes are shown as % of Input normalized to p53−/− cells; mean ± SEM, n ≥ 4. (C and D) H3K27me3 ChIP-Seq from p53−/− and p53−/− Mdm2−/− MEFs (n = 4). Differentially methylated TSSs were aggregated around the TSSs. (E) In comparison with the gene expression levels (RNA-Seq; Figure 1B; Table S2), relative H3K27me3 enriched genomic sites for either upregulated (UP), downregulated (DOWN), or nonregulated (non-reg.) genes were evaluated comparing p53−/− Mdm2−/− to p53−/− MEFs. See also Figure S5, Table S2, and Table S7.
Figure 6.
Figure 6.. Loss of Mdm2 Simultaneously Depletes H2AK119ub1 and H3K27me3 from PRC2 Target Gene Promoters
(A and B) p53−/−, p53−/− Mdm2−/−, and p53−/− Mdm2CA/CA MEFs were subjected to targeted H2AK119ub1 (A) and Ring 1B(B) ChIP in analogy to Figures 5A and 5B. Mean ± SEM, n ≥ 4. (C) H2AK119ub1 ChIPSeq, aggregated around TSSs. (D) Differentially ubiquitinated sites around TSSs (cf. Figure 5C and Table S7). (E) In comparison to the gene expression levels (Figure 1B and Table S2), relative ChIP-Seq levels for either upregulated (UP), downregulated (DOWN), or nonregulated (non-reg.) genes were evaluated, comparing p53−/− Mdm2−/− to p53−/− MEFs. (F) Overlap of differentially bound (DB) regions from H3K27me3 and H2AK119ub1 ChIP-Seq analysis, distinguishing DB sites which are downregulated (dko < sko) or upregulated (dko > sko) in p53−/− Mdm2−/− compared to p53−/− MEFs (sko, p53−/−; dko, p53−/− Mdm2−/−). (G) Genomic binding profiles for H3K27me3 and H2AK119ub1 at the HoxC10 locus; a larger portion of the locus is shown in Figure S6H (sko, p53−/−; dko, p53−/− Mdm2−/−). See also Figure S6, Table S2, and Table S7.
Figure 7.
Figure 7.. Simultaneous Elimination of MDM2 and RING1B/RNF2 Synthetically Interferes with Gene Repression and Cell Proliferation
(A) p53−/− and p53−/− Mdm2−/− MEFs were each transduced to knock down Ring1B by shRNA. qRT-PCR analysis reflected the induction of PRC2-regulated genes. (B and C) The cells from (A) were counted 2 days after plating, revealing compromised proliferation of cells that lack both Mdm2 and Ring1B. (D) HCT116 p53−/− cells were depleted of MDM2 and/or RING1B by transfection of siRNA and retransfection at 48 hr. Changes in cell morphology and number were documented by phase contrast microscopy 96 hr after the first transfection. (E) The area covered by cells giving rise to phase contrast (cf. D) was quantified in each case, revealing significant differences between the combined depletion of MDM2 and RING1B and all other siRNA transfections. (F) The same cells were used for H2AK119ub1 ChIP on target gene promoters. See also Figure S7.

Comment in

References

    1. Abdel-Wahab O, Adli M, LaFave LM, Gao J, Hricik T, Shih AH, Pandey S, Patel JP, Chung YR, Koche R, et al. (2012). ASXL1 mutations promote myeloid transformation through loss of PRC2-mediated gene repression. Cancer Cell 22, 180–193. - PMC - PubMed
    1. Armstrong JF, Kaufman MH, Harrison DJ, and Clarke AR (1995). High-frequency developmental abnormalities in p53-deficient mice. Curr. Biol. 5, 931–936. - PubMed
    1. Ben-Saadon R, Zaaroor D, Ziv T, and Ciechanover A (2006). The polycomb protein Ring1B generates self atypical mixed ubiquitin chains required for its in vitro histone H2A ligase activity. Mol. Cell 24, 701–711. - PubMed
    1. Bhatnagar S, Gazin C, Chamberlain L, Ou J, Zhu X, Tushir JS, Virbasius CM, Lin L, Zhu LJ, Wajapeyee N, and Green MR (2014). TRIM37 is a new histone H2A ubiquitin ligase and breast cancer oncoprotein. Nature 576, 116–120. - PMC - PubMed
    1. Blackledge NP, Farcas AM, Kondo T, King HW, McGouran JF, Hanssen LL, Ito S, Cooper S, Kondo K, Koseki Y, et al. (2014). Variant PRC1 complex-dependent H2A ubiquitylation drives PRC2 recruitment and polycomb domain formation. Cell 157, 1445–1459. - PMC - PubMed

Publication types

MeSH terms