. 2016 Feb 4;61(3):449-460.
doi: 10.1016/j.molcel.2015.12.004. Epub 2015 Dec 31.

Targeting BRCA1 and BRCA2 Deficiencies with G-Quadruplex-Interacting Compounds

Affiliations

Targeting BRCA1 and BRCA2 Deficiencies with G-Quadruplex-Interacting Compounds

Jutta Zimmer et al. Mol Cell. .

Abstract

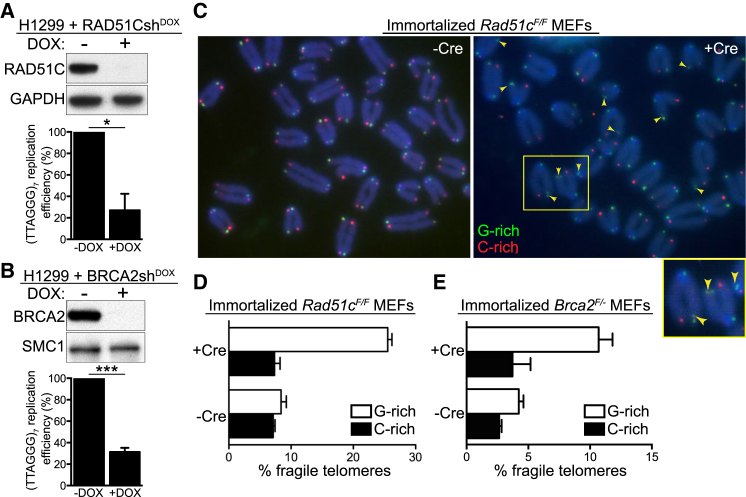
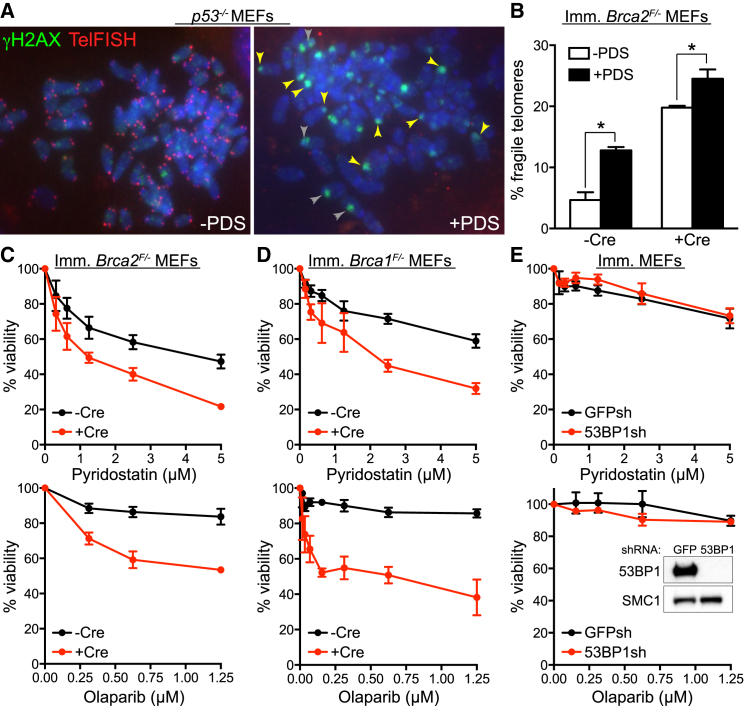
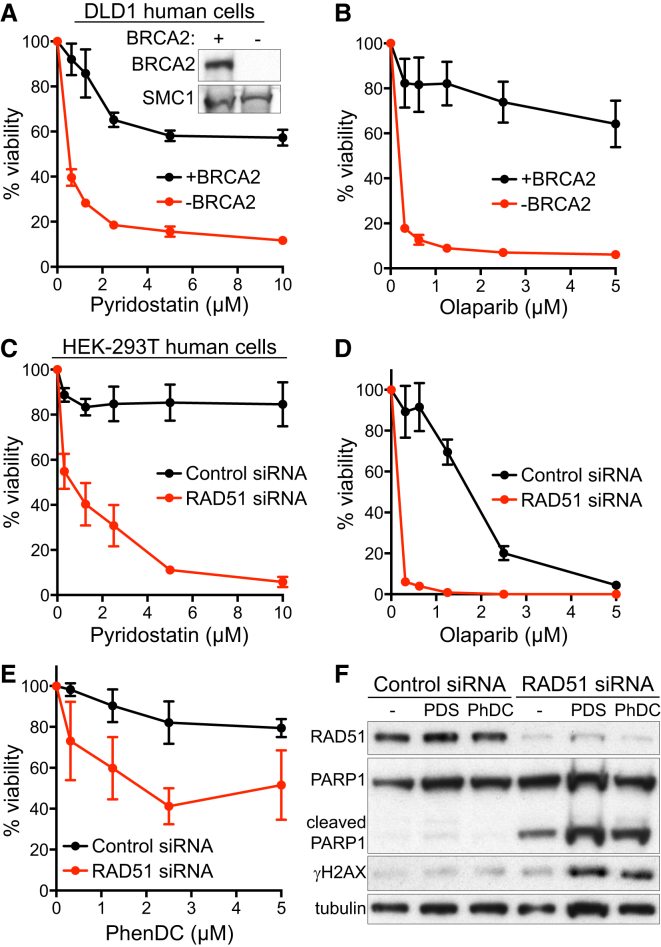
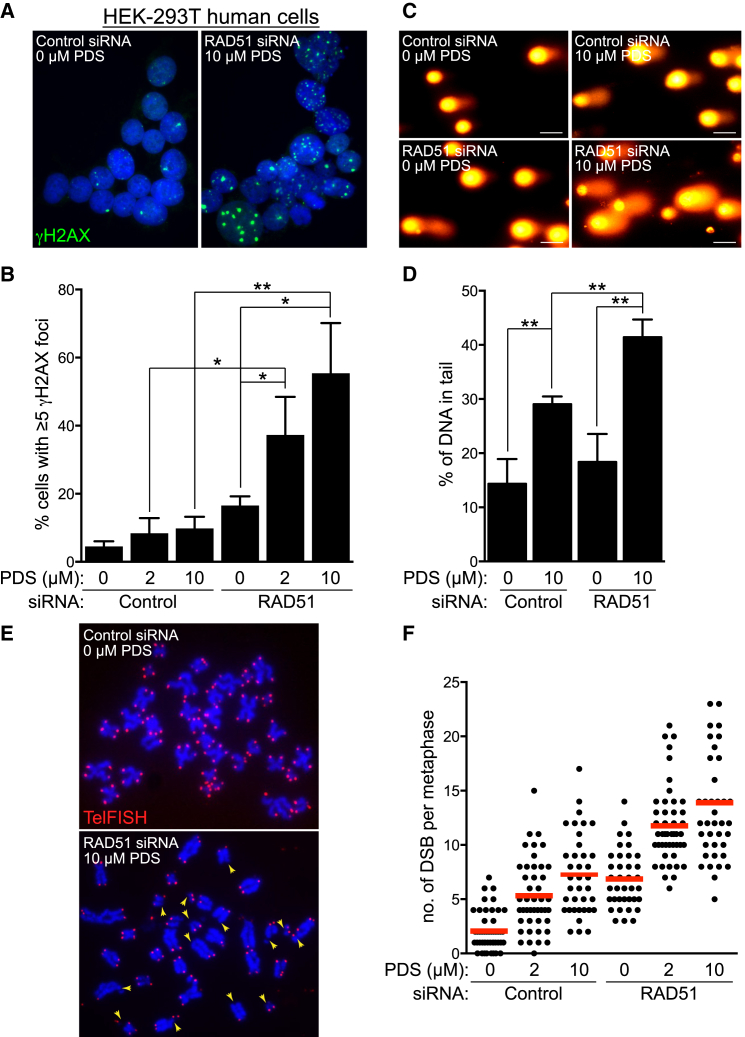
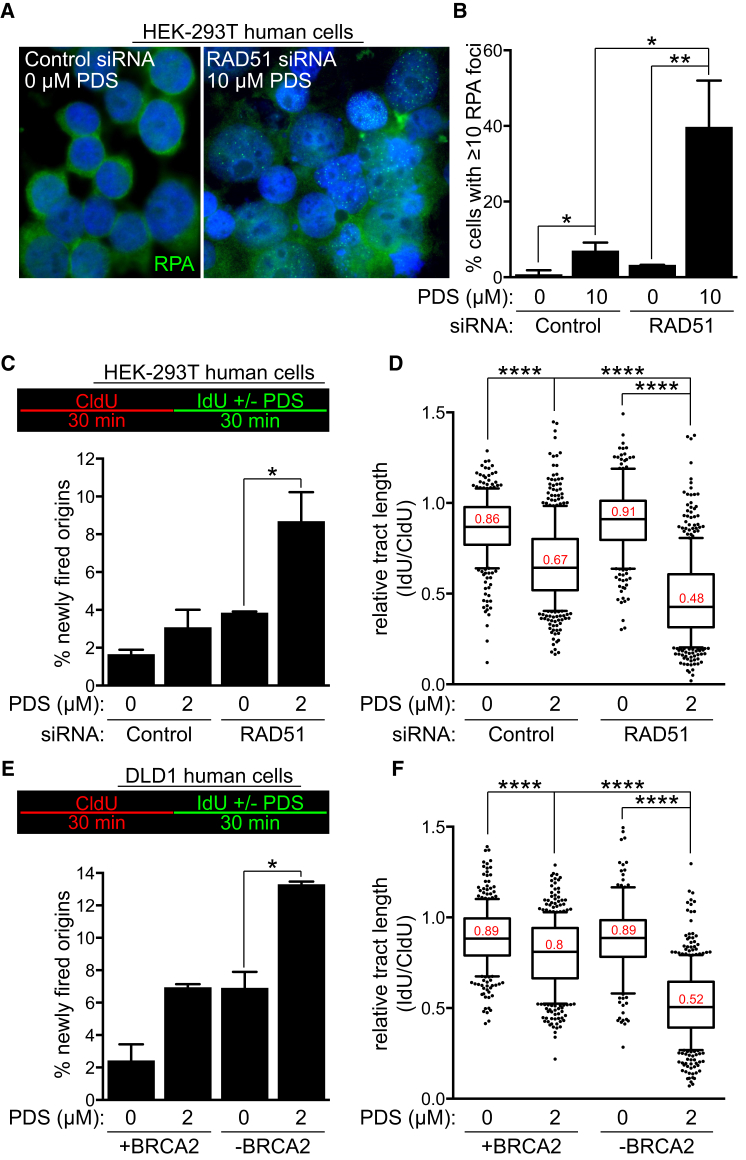
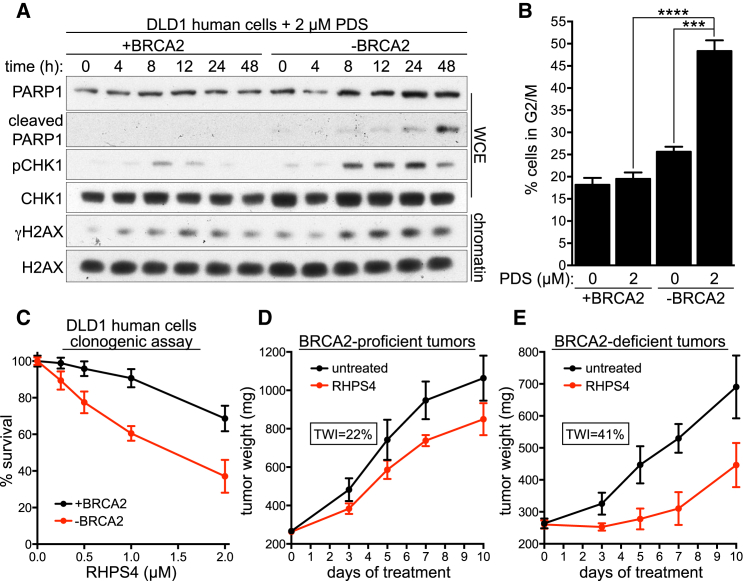
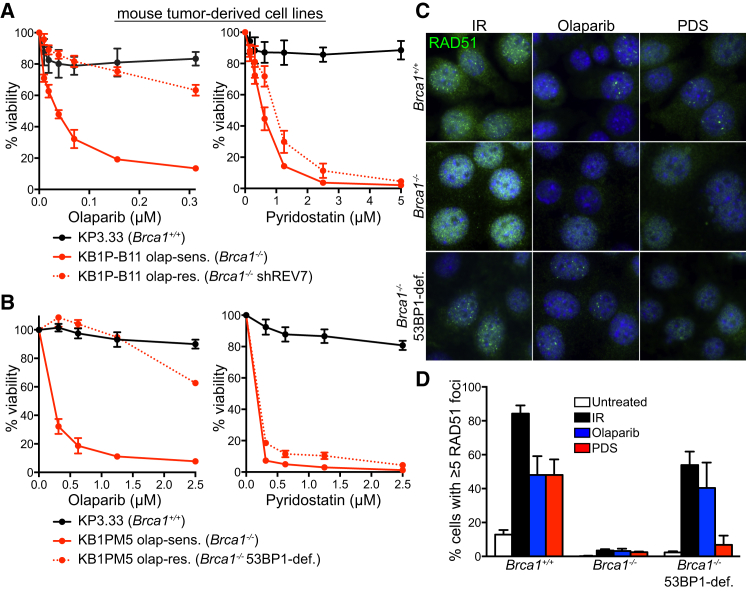
G-quadruplex (G4)-forming genomic sequences, including telomeres, represent natural replication fork barriers. Stalled replication forks can be stabilized and restarted by homologous recombination (HR), which also repairs DNA double-strand breaks (DSBs) arising at collapsed forks. We have previously shown that HR facilitates telomere replication. Here, we demonstrate that the replication efficiency of guanine-rich (G-rich) telomeric repeats is decreased significantly in cells lacking HR. Treatment with the G4-stabilizing compound pyridostatin (PDS) increases telomere fragility in BRCA2-deficient cells, suggesting that G4 formation drives telomere instability. Remarkably, PDS reduces proliferation of HR-defective cells by inducing DSB accumulation, checkpoint activation, and deregulated G2/M progression and by enhancing the replication defect intrinsic to HR deficiency. PDS toxicity extends to HR-defective cells that have acquired olaparib resistance through loss of 53BP1 or REV7. Altogether, these results highlight the therapeutic potential of G4-stabilizing drugs to selectively eliminate HR-compromised cells and tumors, including those resistant to PARP inhibition.


Figures

None
Graphical abstract
Figure 1
Figure 1
RAD51C and BRCA2 Prevent Lagging-Strand Telomere Fragility (A and B) Replication efficiency of a plasmid containing (TTAGGG)7 in H1299 cells expressing doxycycline (DOX)-inducible RAD51C (A) or BRCA2 (B) shRNAs is shown relative to the replication efficiency of the empty vector (n = 3 for RAD51CshDOX; n = 4 for BRCA2shDOX; error bars, SEM). p values were calculated using a one-sample t test (p ≤ 0.05 and ∗∗∗p ≤ 0.001). Cell extracts prepared at the time of plasmid transfection were immunoblotted as indicated. GAPDH and SMC1 were used as loading controls. (C) CO-FISH detection of lagging (G-rich, green) and leading (C-rich, red) telomeric strands in immortalized Rad51cF/F MEFs treated with Cre (+Cre) and control (−Cre) retroviruses. Enlarged inset shows the area marked with the yellow rectangle. Arrows mark lagging-strand fragile telomeres. (D and E) Quantification of fragile telomeres in immortalized Rad51cF/F (D) and Brca2F/- (E) MEFs. Approximately 1,000 telomeres were scored per condition per replica (n = 2; error bars, SD). See also Figure S1.
Figure 2
Figure 2
Effect of the G4-Interacting Compound PDS on Telomere Fragility and Viability of Brca-Deficient MEFs (A) Mitotic chromosome spreads of p53−/− MEFs grown in the presence (+PDS) or absence (−PDS) of 5 μM PDS for 48 hr. Preparations were fixed and stained with anti-γH2AX monoclonal antibody (green). Telomeres were visualized with a Cy3-conjugated (CCCTAA)6-PNA probe (red), using identical exposure conditions for untreated and PDS-treated cells. DNA was counterstained with DAPI (blue). (B) Quantification of fragile telomeres visualized by FISH on metaphase chromosomes from Brca2F/- MEFs treated with Cre (+Cre) and control (−Cre) retroviruses incubated with 5 μM PDS for 40 hr (n = 2; > 1,500 long-arm telomeres were scored per condition per replica; error bars, SD). p values were calculated using an unpaired two-tailed t test (p ≤ 0.05). (C) Dose-dependent viability assays of Brca2F/- MEFs treated with Cre (+Cre) and control (−Cre) retroviruses exposed to PDS or olaparib at the indicated concentrations. (D) Dose-dependent viability assays of Brca1F/- MEFs treated as in (C). (E) Dose-dependent viability assays of immortalized (imm.) MEFs treated as in (C) with retroviruses encoding shRNA against GFP or 53BP1 (Bouwman et al., 2010). Cell extracts were immunoblotted as indicated. SMC1 was used as a loading control. See also Figures S1 and S2. Graphs shown are representative of at least two independent experiments, each performed in triplicate. Error bars represent SD of triplicate values obtained from a single experiment.
Figure 3
Figure 3
Effect of PDS on BRCA2- or RAD51-Deficient Human Cell Viability (A and B) Dose-dependent viability assays of DLD1 cells, BRCA2 proficient (+BRCA2) or deficient (−BRCA2), treated with indicated concentrations of PDS (A) or olaparib (B). (C–E) Dose-dependent viability assays of HEK293T cells transfected with control or RAD51 siRNA treated with indicated concentrations of PDS (C), olaparib (D), or PhenDC (E). Graphs shown are representative of at least two independent experiments, each performed in triplicate. Error bars represent SD of triplicate values obtained from a single experiment. (F) Whole-cell extracts prepared after 4 days of treatment with 2 μM PDS or PhenDC (PhDC) were immunoblotted as indicated. Tubulin was used as a loading control. See also Figure S2.
Figure 4
Figure 4
Elevated Levels of DNA Damage in RAD51-Deficient Human Cells Treated with PDS (A) Representative images of HEK293T cells transfected with control or RAD51 siRNA and treated with PDS for 4 days before processing for immunofluorescence staining with anti-γH2AX antibody (green). DNA was counterstained with DAPI (blue). (B) Quantification of the frequency of cells with ≥5 γH2AX foci treated as in (A); n = 3; error bars, SD. p values were calculated using an unpaired two-tailed t test (p ≤ 0.05; ∗∗p ≤ 0.01). (C) Representative images of cells treated as in (A) processed for comet assays. Scale bar, 50 μm. (D) Quantification of tail moment using comet assays of cells treated as in (A); n = 3; error bars, SD. p values were calculated using an unpaired two-tailed t test (p ≤ 0.05). (E) Representative images of FISH analysis of metaphase chromosome spreads of cells treated as in (A) with a Cy3-conjugated telomeric probe (red). DNA was counterstained with DAPI (blue). Arrowheads point to chromatid/chromosome breaks. (F) Quantification of mean DSB frequencies (red bars) in cells treated as in (A). Approximately 40 metaphases were analyzed for each sample. See also Figure S3.
Figure 5
Figure 5
PDS Exacerbates the Replication Defect of RAD51- and BRCA2-Deficient Human Cells. (A) Representative images of HEK293T cells transfected with control or RAD51 siRNA and treated with PDS for 4 days before processing for immunofluorescence staining with anti-RPA antibody (green). DNA was counterstained with DAPI (blue). (B) Quantification of the frequency of cells with ≥10 RPA foci treated as in (A); n = 3; error bars, SD. p values were calculated using an unpaired two-tailed t test (p ≤ 0.05; ∗∗p ≤ 0.01). (C) HEK293T cells transfected with control or RAD51 esiRNA were processed for DNA fiber analysis as outlined in the inset, followed by quantification of the frequency of newly fired origins (n = 2; error bars, SD). p values were calculated using an unpaired two-tailed t test (p ≤ 0.05). (D) Quantification of the relative replication tract length (IdU/CldU) in cells treated as in (C). Middle line represents median, and the box extends from the 25th to 75th percentiles. The whiskers mark the 10th and 90th percentiles. p values were calculated using a Mann-Whitney test (n = 2; ∗∗∗∗p < 0.0001). (E) DLD1 cells, BRCA2 proficient (+BRCA2) or deficient (−BRCA2), were processed for DNA fiber analysis as outlined in the inset, followed by quantification of the frequency of newly fired origins (n = 2; error bars, SD). p values were calculated using an unpaired two-tailed t test (p ≤ 0.05). (F) Quantification of the relative replication tract length (IdU/CldU) in cells treated as in (E). Middle line represents median, and the box extends from the 25th to 75th percentiles. The whiskers mark the 10th and 90th percentiles. p values were calculated using a Mann-Whitney test (n = 2; ∗∗∗∗p < 0.0001). See also Figure S4.
Figure 6
Figure 6
Effect of PDS on Viability of BRCA2-Deficient Cells and Tumors (A) DLD1 cells, BRCA2 proficient (+BRCA2) or deficient (−BRCA2), were incubated with 2 μM PDS. Whole-cell extracts (WCE) or chromatin fractions prepared at indicated time points were immunoblotted as shown. (B) Cells treated as in (A) were processed for FACS analyses of DNA content after 48 hr. Quantification of the percentage of cells in G2/M is shown (n = 3; error bars, SD). p values were calculated using an unpaired two-tailed t test (∗∗∗p ≤ 0.001; ∗∗∗∗p ≤ 0.0001). (C) Clonogenic survival assays of DLD1 cells, BRCA2 proficient (+BRCA2) or deficient (−BRCA2), exposed to the indicated concentrations of RHPS4 for 24 hr. Error bars represent SD of triplicate values obtained from a single experiment. (D and E) Mean tumor weights in untreated and RHPS4-treated mice injected with BRCA2-proficient (+BRCA2; D) or deficient (−BRCA2; E) DLD1 cells (n = 8; error bars, SD). Tumor weight inhibition (TWI) was calculated at the time point of maximum effect. See also Figures S5 and S6.
Figure 7
Figure 7
Olaparib-Resistant Brca1-Deleted Tumor Cells Exhibit PDS Sensitivity (A and B) Dose-dependent viability assays of mouse mammary tumor-derived cell lines deficient in REV7 (A) or 53BP1 (B) treated with indicated concentrations of PDS or olaparib. Graphs shown are representative of at least two independent experiments, each performed in triplicate. Error bars represent SD of triplicate values obtained from a single experiment. (C) Representative images of cells described in (A) incubated with 0.5 μM olaparib (OLAP), PDS for 40 hr, or irradiated with 10 Gy of IR followed by 1 hr recovery and processed for immunofluorescence staining with anti-RAD51 antibody (green). DNA was counterstained with DAPI (blue). (D) Quantification of the frequency of cells with ≥5 RAD51 foci in cells treated as in (C); n = 2; error bars, SD; >200 nuclei were analyzed for each condition per replica. See also Figure S7.

References

    1. Aze A., Zhou J.C., Costa A., Costanzo V. DNA replication and homologous recombination factors: acting together to maintain genome stability. Chromosoma. 2013;122:401–413. - PubMed
    1. Badie S., Escandell J.M., Bouwman P., Carlos A.R., Thanasoula M., Gallardo M.M., Suram A., Jaco I., Benitez J., Herbig U. BRCA2 acts as a RAD51 loader to facilitate telomere replication and capping. Nat. Struct. Mol. Biol. 2010;17:1461–1469. - PMC - PubMed
    1. Badie S., Carlos A.R., Folio C., Okamoto K., Bouwman P., Jonkers J., Tarsounas M. BRCA1 and CtIP promote alternative non-homologous end-joining at uncapped telomeres. EMBO J. 2015;34:828. - PMC - PubMed
    1. Bailey S.M., Cornforth M.N., Kurimasa A., Chen D.J., Goodwin E.H. Strand-specific postreplicative processing of mammalian telomeres. Science. 2001;293:2462–2465. - PubMed
    1. Biffi G., Tannahill D., McCafferty J., Balasubramanian S. Quantitative visualization of DNA G-quadruplex structures in human cells. Nat. Chem. 2013;5:182–186. - PMC - PubMed

Publication types

MeSH terms