. 2016 Jan 25;26(2):212-218.
doi: 10.1016/j.cub.2015.11.058. Epub 2015 Dec 31.

Transcriptional Memory in the Drosophila Embryo

Affiliations

Transcriptional Memory in the Drosophila Embryo

Teresa Ferraro et al. Curr Biol. .

Abstract

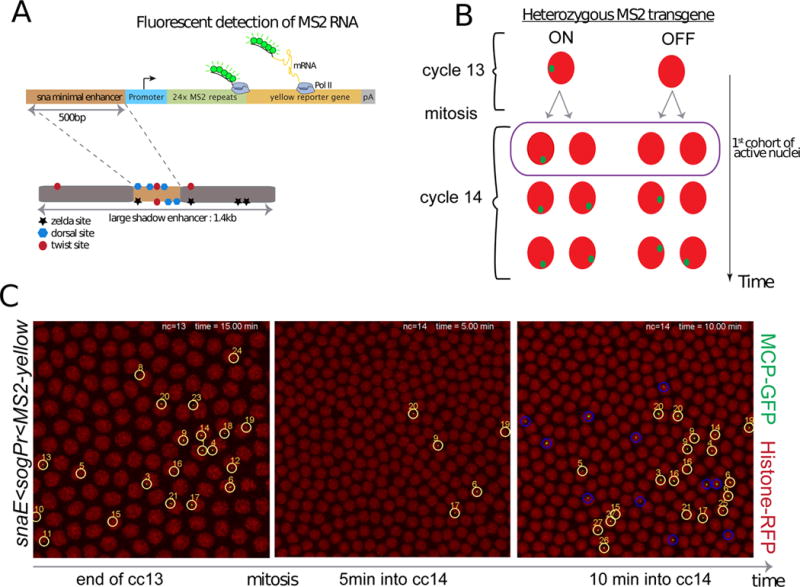
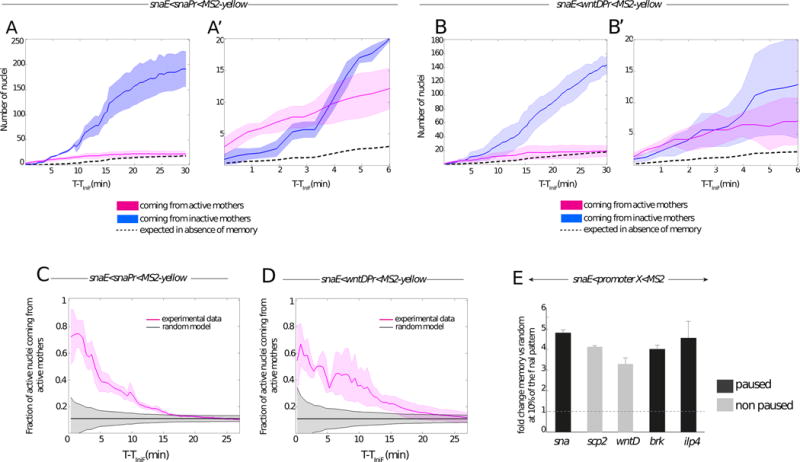
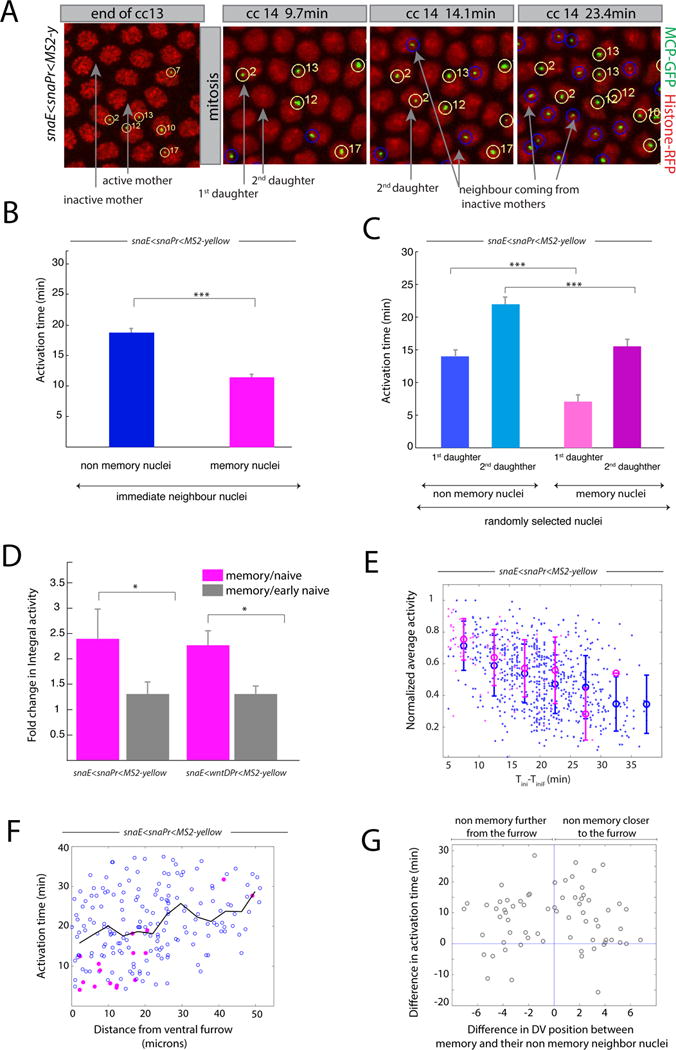
Transmission of active transcriptional states from mother to daughter cells has the potential to foster precision in the gene expression programs underlying development. Such transcriptional memory has been specifically proposed to promote rapid reactivation of complex gene expression profiles after successive mitoses in Drosophila development [1]. By monitoring transcription in living Drosophila embryos, we provide the first evidence for transcriptional memory in animal development. We specifically monitored the activities of stochastically expressed transgenes in order to distinguish active and inactive mother cells and the behaviors of their daughter nuclei after mitosis. Quantitative analyses reveal that there is a 4-fold higher probability for rapid reactivation after mitosis when the mother experienced transcription. Moreover, memory nuclei activate transcription twice as fast as neighboring inactive mothers, thus leading to augmented levels of gene expression. We propose that transcriptional memory is a mechanism of precision, which helps coordinate gene activity during embryogenesis.


Figures

Figure 1
Figure 1. Live imaging of a sensitized snail transgene reveals transcriptional memory
(A) Schematic view of a sensitized snail transgene. A minimal 500bp snail shadow enhancer was cloned upstream of various minimal promoters and 24X MS2 repeats, followed by a yellow reporter gene. Upon activation, the MS2 stem loops in nascent transcripts are bound by a MCP-GFP fusion protein. (B) Schematic representation of transcriptional memory. Descendants from transcriptionally active mother nuclei in nuclear cycle (cc) 13 tend to activate transcription very early during interphase 14, circled and referred to as ‘first cohort of active nuclei’. This particular population will be referred to as ‘memory’ nuclei, whereas active descendants from inactive mother nuclei at cc13 will be referred to as ‘non memory’ nuclei. (C) Live imaging of the transcriptional activity of a sensitized snail transgene (snail-enhancer<sogPr<MS2-yellow). Nascent mRNA ‘spots’ are shown in green (MS2-MCP-GFP) and nuclei are labeled in red (Histone-RFP transgene). Only selected time frames are shown, the entire movie can be obtained in Movie S1. All active nuclei at cc13 are tracked with a unique number. After mitosis their descendants are tracked, circled in yellow, while active cc14 nuclei derived from inactive mothers are circled in blue. Ventral views of a 2.1 zoomed central region of an embryo, where anterior is to the left. See also Figure S1 and Movie S1.
Figure 2
Figure 2. Quantitative analysis of transcriptional memory
(A–B) Memory bias in transcriptional activity during cc14. Kinetics are extracted from 3 independent movies of snaE<snaPr<MS2 transgenic embryos (A) and from 3 independent movies of snaE<wntDPr<MS2 transgenic embryos (B). The distribution of active nuclei derived from transcriptionally active mother nuclei is shown in pink. The descendants of inactive mother nuclei are depicted in blue. Light colors indicate the standard deviation of these quantified kinetics. Dashed curves represent the expected average time behavior in the absence of a memory bias, for mathematical formulations please refer to the main text. (A′, B′) Zoomed view of the 6 first minutes of cc14, corresponding to the plots shown in (A) and (B) respectively. (C, D) Temporal behavior of the fraction of nuclei derived from memory mothers during cc14 (pink curves). Two different genotypes are shown, with a paused promoter (snaE<snaPr<MS2, n=3) (C) or a non-paused promoter (snaE<wntDPr<MS2, n=3) (D). Experimental data are compared to the expected behavior of a random activation distribution, indicated in grey, assuming a binomial sampling of a constant fraction of active nuclei in each cell cycle (see Supplements for details). For all the plots (A to D) the x axes corresponds to the time (in minutes), starting at the frame where the first spot is detected (TiniF). (E) Increase in the probability that a memory daughter nucleus is among the first cohort (first 10%) of activated nuclei with respect to the random model expectations during the onset of cc14 for the following transgenes: snaE<snaPr<MS2 (n=3 movies); snaE<wntDPr<MS2 (n=3 movies), snaE<scpPr<MS2 (n=2movies), snaE<brkPr<MS2 (n=2movies), snaE<ilp4Pr<MS2 (n=2 movies). The fold change is obtained by dividing the fraction of active nuclei coming from active mothers by the fraction expected from the random model. The fold change is evaluated at the time corresponding to 10% of the total active pattern. Error bars represent standard errors. See also Figure S2 and Movie S2.
Figure 3
Figure 3. Transcriptional kinetics of memory
(A) Snapshots of live imaging of a snaE<snaPr<MS2 transgenic embryo. Confocal z-projected images of selected ventral regions are shown at different time points during cc13 and cc14. Tracked active nuclei at cc13 and their descendants (first and second daughter to exhibit transcription) are circled and numbered in yellow. Examples of immediate neighboring nuclei coming from inactive mother nuclei are circled in blue. (B) Mean activation time for descendants of active mother nuclei and for immediate neighboring nuclei coming from inactive mothers. Error bars represent standard errors (non-memory nuclei are shown in blue, n=68; memory nuclei are shown in pink, n=68; memory versus non-memory p-value=3*10−10). (C) Mean activation time for descendants of active mother nuclei or those from inactive mothers, tracking the first daughter and second daughter separately, randomly selected from the entire imaged region. For panels B, C, quantification was performed on 3 movies of snaE<snaPr<MS2 transgenic embryos (total of 750 nuclei). Error bars represent standard errors (first daughter non memory, n=54; second daughter non memory, n=54; first daughter memory, n=24; second daughter non memory n=24). Statistics: first daughter non memory versus first daughter memory, p-value= 3*10−8; second daughter non memory versus second daughter memory, p-value=1*10−4). (D) Fold change in integral activity, defined as the ratio between the integral activity of memory nuclei divided by that of non memory nuclei. Integral activity corresponds to the sum of activities across all time frames. Error bars represent standard errors computed on 3 different movies for each genotype. Statistics: snaE<snaPr<MS2 p-value=0.02; snaE<wntDPr<MS2 p-value=0.03). (E) This scatter plot shows the behavior of the average activity as a function of the activation time. The data points are extracted from three movies and the value of the average activity is normalized by its maximum. Nuclei coming from active mothers are depicted in pink while those coming from inactive mothers are represented in blue. Error bars are standard deviations evaluated by binning the activation time in intervals of 5 minutes each. (F) Scatter plot of the activation time as function of the distance from the ventral furrow at cc14 for a snaE<snaPr<MS2 transgenic embryo. Pink symbols represent memory nuclei and blue symbols non memory ones. The black line is the average behavior. (G) Scatter plot of the difference in activation time between a memory nucleus and its non memory closest neighbor as function of their distance. The statistical test used in Figure 3 is a two samples t-test with the following convention: * for a p-value comprised between 0.05 and 0.01; ** for a p-value comprised between 0.01 and 0.001; *** for a p-value inferior or equal to 0.001. See also Figure S3, Movie S2 and Movie S3.

Comment in

Similar articles

Cited by

References

    1. Porcher A, Abu-Arish A, Huart S, Roelens B, Fradin C, Dostatni N. The time to measure positional information: maternal hunchback is required for the synchrony of the Bicoid transcriptional response at the onset of zygotic transcription. Development. 2010;137:2795–2804. - PubMed
    1. Muramoto T, Müller I, Thomas G, Melvin A, Chubb JR. Methylation of H3K4 Is Required for Inheritance of Active Transcriptional States. Current Biology. 2010;20:397–406. - PubMed
    1. Zhao R, Nakamura T, Fu Y, Lazar Z, Spector DL. Gene bookmarking accelerates the kinetics of post-mitotic transcriptional re-activation. Nature Cell Biology. 2011;13:1295–1304. - PMC - PubMed
    1. Sigal A, Milo R, Cohen A, Geva-Zatorsky N, Klein Y, Liron Y, Rosenfeld N, Danon T, Perzov N, Alon U. Variability and memory of protein levels in human cells. Nature. 2006;444:643–646. - PubMed
    1. Lagha M, Bothma JP, Levine M. Mechanisms of transcriptional precision in animal development. Trends Genet. 2012;28:409–416. - PMC - PubMed

Publication types

MeSH terms

LinkOut - more resources