. 2016 Feb;22(6):2004-2011.
doi: 10.1002/chem.201504057. Epub 2016 Jan 8.

Tilting and Tumbling in Transmembrane Anion Carriers: Activity Tuning through n-Alkyl Substitution

Affiliations

Tilting and Tumbling in Transmembrane Anion Carriers: Activity Tuning through n-Alkyl Substitution

Sophie J Edwards et al. Chemistry. 2016 Feb.

Abstract

Anion transport by synthetic carriers (anionophores) holds promise for medical applications, especially the treatment of cystic fibrosis. Among the factors which determine carrier activity, the size and disposition of alkyl groups is proving remarkably important. Herein we describe a series of dithioureidodecalin anionophores, in which alkyl substituents on one face are varied from C0 to C10 in two-carbon steps. Activities increase then decrease as the chain length grows, peaking quite sharply at C6 . Molecular dynamics simulations showed the transporter chloride complexes releasing chloride as they approach the membrane-aqueous interface. The free transporter then stays at the interface, adopting an orientation that depends on the alkyl substituent. If chloride release is prevented, the complex is positioned similarly. Longer chains tilt the binding site away from the interface, potentially freeing the transporter or complex to move through the membrane. However, chains which are too long can also slow transport by inhibiting movement, and especially reorientation, within the phospholipid bilayer.

Keywords: anion transport; lipophilicity; membranes; molecular dynamics; supramolecular chemistry.


Figures

Scheme 1
Scheme 1
(i) Trifluoroacetic acid (TFA), CH2Cl2, rt, 16 h; (ii) isothiocyanate 8 af (2.2 equiv), 4‐dimethylaminopyridine (DMAP; 2.7 equiv), diisopropylethylamine (DIPEA), THF, rt, 16 h.
Figure 1
Figure 1
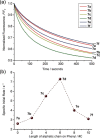
(a) Chloride transport into vesicles (POPC/cholesterol 7:3) facilitated by decalins 7 a (red), 7 b (orange), 7 c (yellow), 7 d (green), 7 e (blue), and 7 f (purple) at a 1:1000 transporter to lipid ratio. (b) Plot of the specific initial rate values of chloride transport by decalins 7 af as a function of the length of the aliphatic chain R. Activities peak for 7 d.
Figure 2
Figure 2
Evolution of Pint ⋅⋅⋅decalinCOM (purple), Pint ⋅⋅⋅N−HCOM (blue), Pint ⋅⋅⋅ p‐CCOM (orange) and Pint ⋅⋅⋅tailCOM (red) distances for A1.7 a (left plot) and A1.7 f (right plot), as well as the corresponding Pint ⋅⋅⋅Cl (light green) during 150 ns of simulation time. The water/lipid interface is represented as a black line at z=0 Å. The atoms used to define each centre of mass are identified in the far right sketch with purple, blue, orange, and red for decalinCOM, N−HCOM, p‐CCOM, and tailCOM, respectively, in agreement with the corresponding lines in the plots.
Figure 3
Figure 3
Consecutive snapshots depicting the diffusion of the chloride complex of 7 a and 7 f in simulations A1.7 a (top) and A1.7 f (bottom). The transporter, the phosphorus atoms and ions are represented as spheres. The hydrogen atoms are shown in white, oxygen atoms in red, nitrogen atoms in blue, sulfur atoms in yellow, phosphorus atoms in orange and carbon atoms in light blue (transporter) or wheat (phospholipids), whereas the chloride and sodium ions are shown in green and pink, respectively. The chloride decomplexation assisted by water is emphasized with the depiction of water molecules within 3.5 Å from 7 a or f as spheres. The lipid C−H bonds are omitted for clarity.
Figure 4
Figure 4
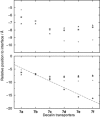
Average positions of decalinCOM (▴), N−HCOM (▪), p‐CCOM (⧫), and tailCOM (•) thiourea reference points relative to the closest interface. Each point was calculated averaging the last 50 ns of the four independent setup A MD simulation replicates, resulting in 200 ns of total sampling time.
Figure 5
Figure 5
Rationalisation of transport data for 7 af, as was suggested by molecular dynamic simulations. Cartoons depict chloride complexes of the six transporters. All complexes locate at the membrane interface, but orientations are different. For 7 a, the binding site is directed towards the aqueous phase. This allows the bound anion and polar groups to interact effectively with water molecules, which are linked by hydrogen bonding to bulk water. These interactions are relatively difficult to break, inhibiting transport. When alkyl chains are added to the receptor, the complex is turned by hydrophobic interactions. The connection to the aqueous phase becomes weaker, and more easily broken. Transport rates reach a maximum at 7 d, after which reorientation of the complex in the membrane becomes rate determining. This process is especially important for longer chains, which obstruct release of chloride if pointing in the wrong direction, and also becomes slower as chain lengths increase, in agreement with our molecular mechanics energetic analysis.

Similar articles

Cited by

References

    1. None
    1. Davis A. P., Sheppard D. N., Smith B. D., Chem. Soc. Rev. 2007, 36, 348–357; - PMC - PubMed
    1. Gokel G. W., Barkey N., New J. Chem. 2009, 33, 947–963;
    1. Davis J. T., Okunola O., Quesada R., Chem. Soc. Rev. 2010, 39, 3843–3862; - PubMed
    1. Matile S., Vargas Jentzsch A., Montenegro J., Fin A., Chem. Soc. Rev. 2011, 40, 2453–2474; - PubMed

LinkOut - more resources