. 2016 Jan;155(2):223-34.
doi: 10.1007/s10549-016-3677-3. Epub 2016 Jan 9.

Assessing cost-utility of predictive biomarkers in oncology: a streamlined approach

Affiliations

Assessing cost-utility of predictive biomarkers in oncology: a streamlined approach

Anton Safonov et al. Breast Cancer Res Treat. 2016 Jan.

Abstract

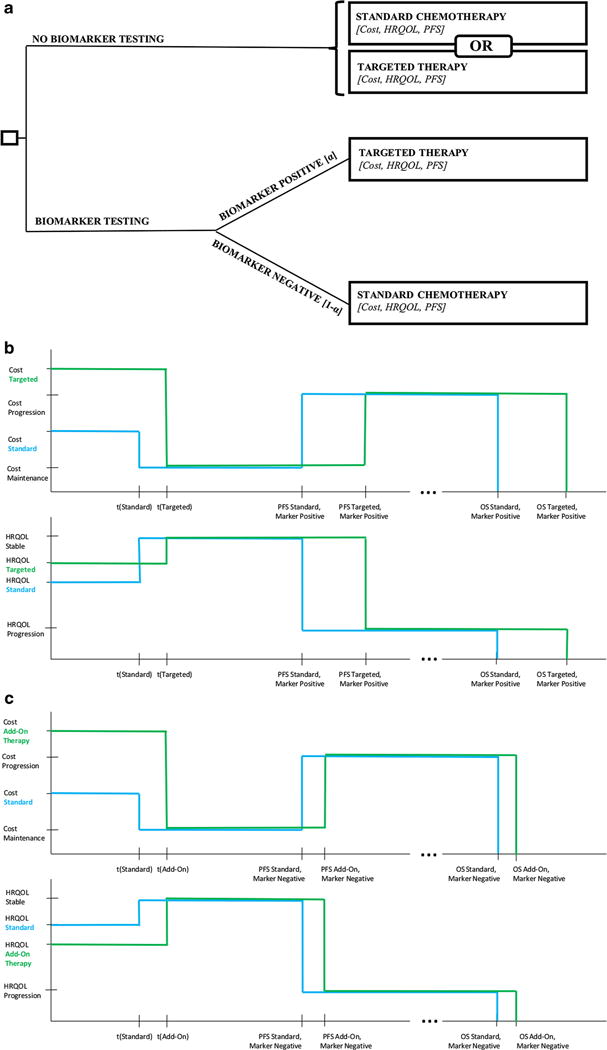
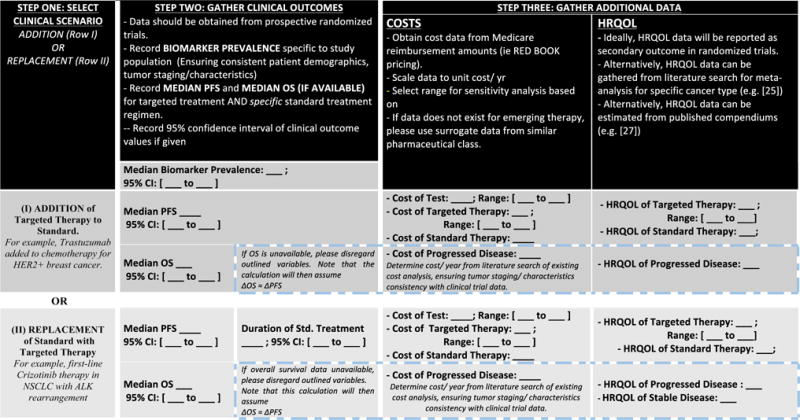
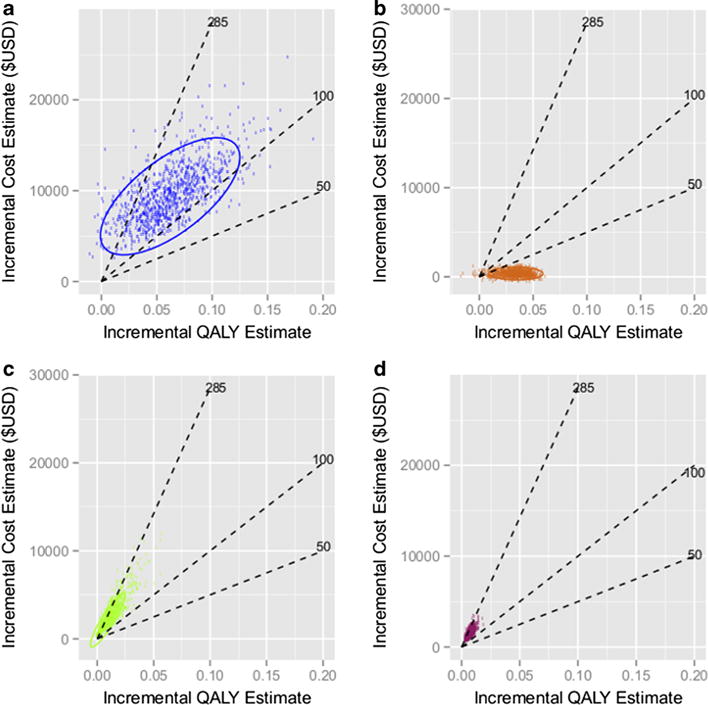
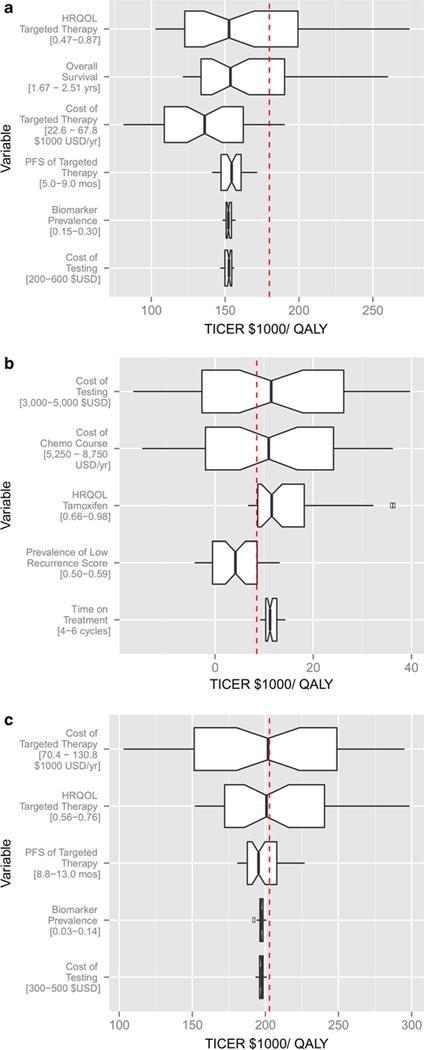
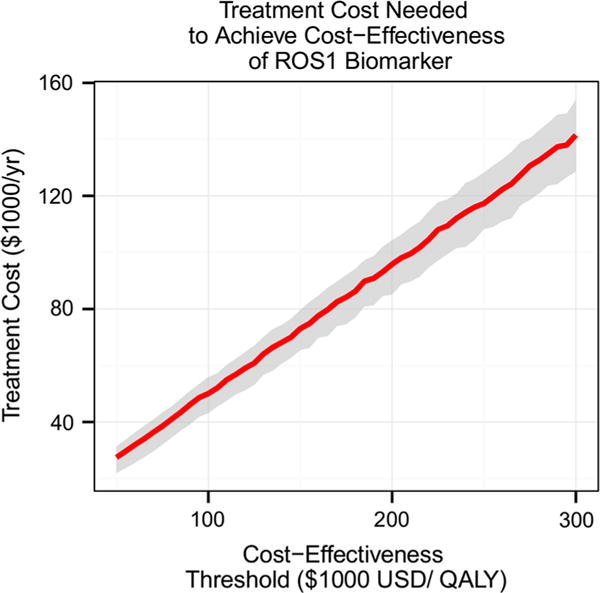
Evaluation of cost-utility is critical in assessing the medical utility of predictive or prognostic biomarkers. Current methods involve complex state-transition models, requiring comprehensive data inputs. We propose a simplified decision-analytic tool to explore the relative effect of factors contributing to the cost-utility of a biomarker. We derived a cost-utility metric, the "test incremental cost-effectiveness ratio" (TICER) for biomarker-guided treatment compared to no biomarker use. This method uses data inputs readily accessible through clinical literature. We compared our results with traditional cost-effectiveness analysis of predictive biomarkers for established (HER2-guided trastuzumab, ALK-guided crizotinib, OncotypeDX-guided adjuvant chemotherapy) and emerging (ROS1-guided crizotinib) targeted treatments. We conducted sensitivity analysis to determine which factors had the greatest impact on TICER estimates. Base case TICER for HER2 was $149,600/quality-adjusted life year (QALY), for ALK was $22,200/QALY, and for OncotypeDX was $11,600/QALY, consistent with literature-reported estimates ($180,000/QALY, $202,800/QALY, $8900/QALY, respectively). Base case TICER for ROS1-guided crizotinib was $205,900/QALY. Generally, when treatment cost is considerably greater than biomarker testing costs, TICER is driven by clinical outcomes and health-related quality of life, while biomarker prevalence and treatment cost have a lesser effect. Our simplified decision-analytic approach produces values consistent with existing cost-effectiveness analyses. Our results suggest that biomarker value is mostly driven by the clinical efficacy of the targeted agent. A user-friendly web tool for complete TICER analysis has been made available for open use at http://medicine.yale.edu/lab/pusztai/ticer/ .

Keywords: Breast cancer; Comparative effectiveness; Decision analysis; OncotypeDX; Outcomes; Research.


Conflict of interest statement

Conflicts of Interest The authors of this study have no conflicts of interest to disclose.

Figures

Fig. 1
Fig. 1
Model schematic a Simple decision framework to guide treatment with biomarker testing, as compared to no biomarker testing. If testing is performed, the biomarker prevalence a determines the proportion of patients for which a specific therapy is added or spared. Each endpoint is a clinical state corresponding to the patient’s progression-free survival, overall survival, as well as associated costs and HRQOL. b Cost (top) and HRQOL profile (bottom) when the default treatment is standard therapy. We consider treatment time t for targeted therapy, t (targeted), for standard therapy, t (standard), post-treatment stable disease (from t to PFS), and disease progression (PFS to OS) for both treatment arms. TICER essentially compares the median difference in quality-adjusted outcomes (PFS and OS) in biomarker-positive patients to the cost difference between treatment arms. c Cost (top) and HRQOL profile (bottom) when the default treatment is a certain therapy, and testing serves to spare this treatment in biomarker-negative patients. We consider a similar progression through treatment time, stable disease, and progression as (b). We effectively compare cost, HRQOL difference, and any difference in median PFS and OS for add-on therapy and standard therapy in biomarker-negative patients
Fig. 2
Fig. 2
TICER data input template. This figure guides the reader in the data collection process. Step one involves the decision of clinical scenario considered (addition of targeted treatment to standard-of-care therapy or replacement of standard therapy with targeted treatment). Step two involves collection of clinical outcome data from a randomized clinical trial. Step three guides the reader on the remaining data needed, depending on availability of overall survival data
Fig. 3
Fig. 3
Incremental cost-QALY plane. Scatterplots portray the incremental costs (numerator of TICER) vs. incremental QALY (denominator of TICER) for a HER2-guided Trastuzumab therapy, b OncotypeDX-guided chemotherapy sparing, c ALK-guided crizotinib therapy, and d ROS1-guided crizotinib therapy. A variety of “acceptability” thresholds are plotted (dashed lines, in units of 1000 $USD/QALY). 95 % confidence ellipses are also plotted around the estimated points
Fig. 4
Fig. 4
Sensitivity analyses. Sensitivity analysis displays the median TICER for uniformly sampled values of each parameter of interest, averaged over the effect of all other parameters. The range of each parameter tested in sensitivity analysis, as reported in Table 2, is shown underneath each variable. ICER values derived from comprehensive cost-effectiveness analyses in the literature are reported as a reference line for comparison. HER2-guided trastuzumab therapy (a), OncotypeDX-guided chemotherapy sparing (b), and ALK-guided crizotinib therapy (c). The base case TICER for HER2 biomarker was 149,600 $USD/QALY, as compared to the literature value of 180,000 $USD/QALY [18]. The base case for ALK was 222,000 $USD/QALY, as compared to the literature value of 202,800 $USD/QALY [19]. The base case TICER for OncotypeDX was 11,600 $USD/QALY, as compared to the literature value of 8900 $USD/QALY [37]
Fig. 5
Fig. 5
Treatment cost needed to meet a range of cost-effectiveness thresholds. This graph suggests maximum treatment costs that are needed in order to meet a cost-effectiveness threshold defined by the user. For a cost-effectiveness threshold of $100,000 USD/QALY, the treatment cost must be below $50,800 USD/year. For a threshold of $200,000 USD/QALY, the treatment cost must be below $93,400 USD/year

Similar articles

Cited by

References

    1. Scalo JF, Rascati KL. Trends and issues in oncology costs. Expert Rev Pharmacoecon Outcomes Res. 2014;14(1):35–44. doi: 10.1586/14737167.2014.864561. - DOI - PubMed
    1. Fund C. Why not the best?: results from the National Scorecard on US Health System Performance 2008. Common-wealth Fund; New York: 2008.
    1. Woolf SH, Aron L. U.S. Health in International perspective: shorter lives, poorer health. In: Woolf SH, Aron L, editors. The National academies collection: reports funded by National Institutes of Health. Institute of Medicine of the National Academies; Washington: 2013. - PubMed
    1. Slamon DJ, Leyland-Jones B, Shak S, Fuchs H, Paton V, Bajamonde A, Fleming T, Eiermann W, Wolter J, Pegram M, Baselga J, Norton L. Use of chemotherapy plus a monoclonal antibody against HER2 for metastatic breast cancer that overexpresses HER2. N Engl J Med. 2001;344(11):783–792. doi: 10.1056/NEJM200103153441101. - DOI - PubMed
    1. Herbst RS, Soria JC, Kowanetz M, Fine GD, Hamid O, Gordon MS, Sosman JA, McDermott DF, Powderly JD, Gettinger SN, Kohrt HE, Horn L, Lawrence DP, Rost S, Leabman M, Xiao Y, Mokatrin A, Koeppen H, Hegde PS, Mellman I, Chen DS, Hodi FS. Predictive correlates of response to the anti-PD-L1 antibody MPDL3280A in cancer patients. Nature. 2014;515(7528):563–567. doi: 10.1038/nature14011. - DOI - PMC - PubMed

Publication types

LinkOut - more resources