. 2016 Jan 11:6:19054.
doi: 10.1038/srep19054.

Low diversity of planktonic bacteria in the tropical ocean

Affiliations

Low diversity of planktonic bacteria in the tropical ocean

Mathias Milici et al. Sci Rep. .

Abstract

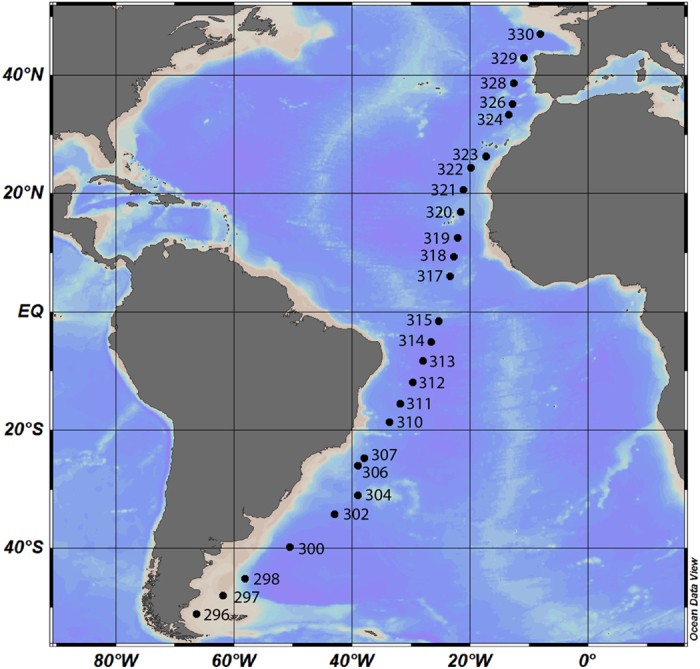
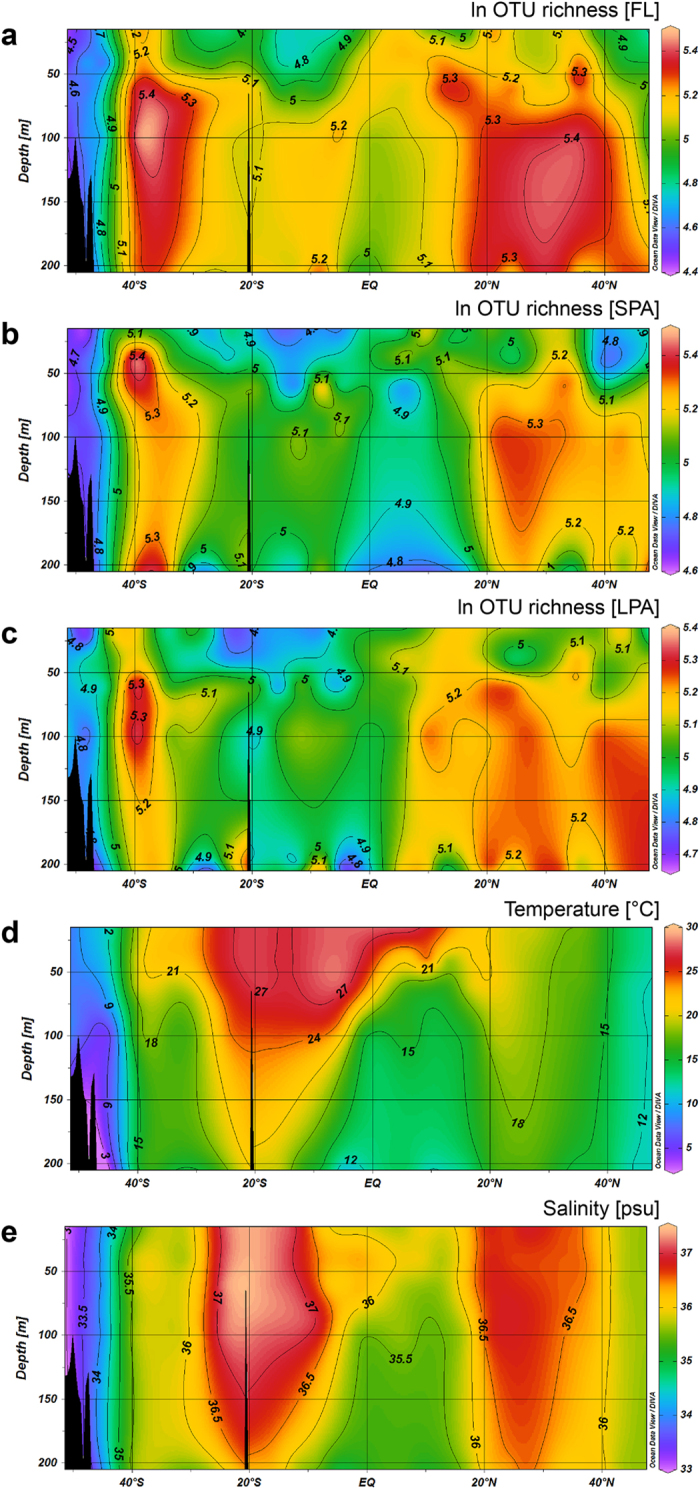
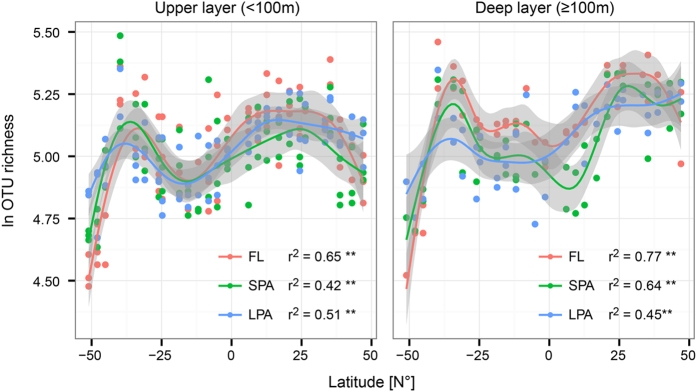
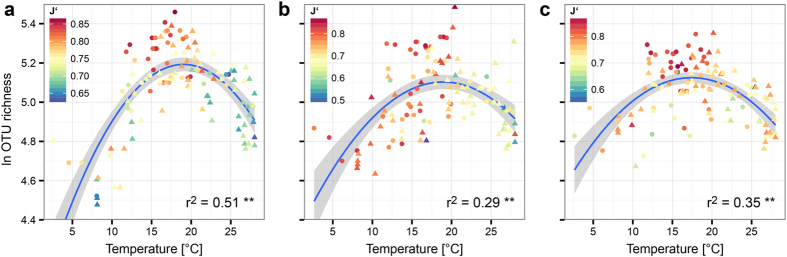
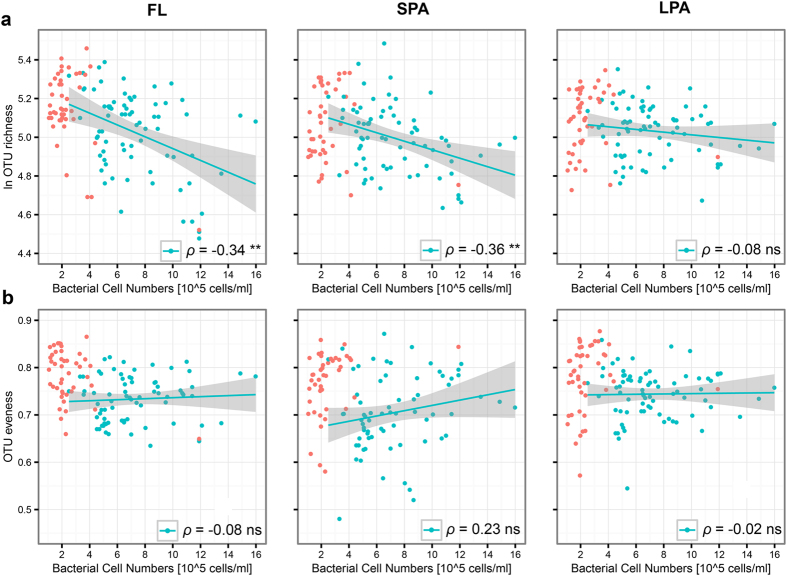
The diversity of macro-organisms increases towards the equator, with almost no exceptions. It is the most conserved biogeographical pattern on earth and is thought to be related to the increase of temperature and productivity in the tropics. The extent and orientation of a latitudinal gradient of marine bacterioplankton diversity is controversial. Here we studied the euphotic zone of the Atlantic Ocean based on a transect covering ~12.000 km from 51°S to 47 °N. Water samples were collected at 26 stations at five depths between 20 and 200 m and sequentially filtered through 8 μm, 3 μm and 0,22 μm filters, resulting in a total of 359 samples. Illumina sequencing of the V5-V6 region of the 16S rRNA gene revealed a clear biogeographic pattern with a double inverted latitudinal gradient. Diversity was higher in mid-latitudinal regions of the Atlantic Ocean and decreased towards the equator. This pattern was conserved for bacteria from all three planktonic size fractions. Diversity showed a non-linear relationship with temperature and was negatively correlated with bacterial cell numbers in the upper depth layers (<100 m). The latitudinal gradients of marine bacterial diversity and the mechanisms that govern them are distinct from those found in macro-organisms.


Figures

Figure 1
Figure 1. Sampling stations of cruise ANT 28-5 across the Atlantic Ocean.
At each station, the epipelagic zone was sampled from 20 to 200 m. The free software Ocean Data View (Schlitzer, R., Ocean Data View, http://odv.awi.de, 2015), version 4.7.2, was used to generate the map in accordance with the geographical position reported in Supplementary Table S1.
Figure 2
Figure 2. Bacterial diversity, water temperature and salinity in the epipelagic zone of the Atlantic Ocean.
Bacterial diversity is shown as the ln of OTU richness (S) from 20 to 200 m depth from 51 °S to 47 °N for the three size fractions of the marine plankton: FL (free living bacteria, 3–0.22 μm filtrate) (a), SPA (small particle associated bacteria, 8–3 μm filtrate) (b) and LPA (large particle associated bacteria, >8 μm filtrate) (c). Panel (d) shows the water temperature and (e) the salinity. The five sections were generated with the free software Ocean Data View (Schlitzer, R., Ocean Data View, http://odv.awi.de, 2015), version 4.7.2, in accordance with the metadata reported in Supplementary Table S2.
Figure 3
Figure 3. Latitudinal course of bacterial diversity.
The OTU richness (ln S) at each sampling site and depth was plotted against the latitude for the upper (>100 m, left) and lower (>100 m, right) water depths. Generalized Additive Models were fitted with cubic spline. Color code indicates the size fraction of the marine plankton. The coefficient of determination (adjusted R2) and its significance (**p < 0.01) are reported for each model.
Figure 4
Figure 4. Relationship between OTU richness and temperature.
Bacterial diversity expressed as the ln of OTU richness (S), was plotted against the water temperature. A second order polynomial model was fitted to the data and significance was calculated for permutations (999). A separate model was constructed for each of the size fractions of the marine plankton: FL (a), SPA (b) and LPA (c). All three models were highly statistically significant (** p < 0.01).The color key shows Pielou’s index of evenness (J‘). The coefficient of determination (adjusted R2) is reported for each of the models in the upper right part of the graphs. Triangles represent samples from depths above 100 m, while circles represent samples from depths >100 m.
Figure 5
Figure 5. Relationship between alpha diversity and bacterial cell numbers.
OTU richness (S), and bacterial evenness (J‘) were correlated with cell numbers (cells/ml) for the depths above 100 m. Spearman rank correlation with 999 permutations was calculated. Significance level (**p < 0.01, *p < 0.05 and ns p > 0.05) and Rho values (ρ) are shown on the chart area. (a) Correlation for the three separated communities: FL, SPA and LPA between OTU richness (S) and cell numbers (cells/ml). (c) Correlation for the three separated communities: FL, SPA and LPA between OTU evenness (J‘) and cell numbers (cells/ml). Grey shading shows 95% confidence intervals for Spearman rank correlation. Red circles show data for depths >100 m. Here, cell numbers were low and had no correlation with diversity.

References

    1. Whitman W. B., Coleman D. C. & Wiebe W. J. Prokaryotes: the unseen majority. Proc. Natl. Acad. Sci. USA 95, 6578–6583 (1998). - PMC - PubMed
    1. Falkowski P. G., Fenchel T. & DeLong E. F. The microbial engines that drive Earth’s biogeochemical cycles. Science 320, 1034–1039 (2008). - PubMed
    1. Azam F. & Malfatti F. Microbial structuring of marine ecosystems. Nat. Rev. Microbiol. 5, 782–791 (2007). - PubMed
    1. Moran M. A., Reisch C. R., Kiene R. P. & Whitman W. B. Genomic insights into bacterial DMSP transformations. Ann. Rev. Mar. Sci. 4, 523–542 (2012). - PubMed
    1. Zehr J. P. & Kudela R. M. Nitrogen cycle of the open ocean: from genes to ecosystems. Ann. Rev. Mar. Sci. 3, 197–225 (2011). - PubMed

Publication types

Substances

LinkOut - more resources