. 2016 Feb;18(2):213-24.
doi: 10.1038/ncb3295. Epub 2016 Jan 11.

The LINK-A lncRNA activates normoxic HIF1α signalling in triple-negative breast cancer

Affiliations

The LINK-A lncRNA activates normoxic HIF1α signalling in triple-negative breast cancer

Aifu Lin et al. Nat Cell Biol. 2016 Feb.

Abstract

Although long non-coding RNAs (lncRNAs) predominately reside in the nucleus and exert their functions in many biological processes, their potential involvement in cytoplasmic signal transduction remains unexplored. Here, we identify a cytoplasmic lncRNA, LINK-A (long intergenic non-coding RNA for kinase activation), which mediates HB-EGF-triggered, EGFR:GPNMB heterodimer-dependent HIF1α phosphorylation at Tyr 565 and Ser 797 by BRK and LRRK2, respectively. These events cause HIF1α stabilization, HIF1α-p300 interaction, and activation of HIF1α transcriptional programs under normoxic conditions. Mechanistically, LINK-A facilitates the recruitment of BRK to the EGFR:GPNMB complex and BRK kinase activation. The BRK-dependent HIF1α Tyr 565 phosphorylation interferes with Pro 564 hydroxylation, leading to normoxic HIF1α stabilization. Both LINK-A expression and LINK-A-dependent signalling pathway activation correlate with triple-negative breast cancer (TNBC), promoting breast cancer glycolysis reprogramming and tumorigenesis. Our findings illustrate the magnitude and diversity of cytoplasmic lncRNAs in signal transduction and highlight the important roles of lncRNAs in cancer.


Figures
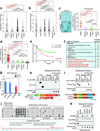
Figure 1
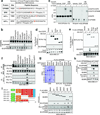
Figure 1. LINK-A is a TNBC-upregulated cytoplasmic lncRNA with prognostic value
(a and b) Scatter plots comparing LINK-A expression in breast tumors samples with different ER, PR, and HER2 status including ER−/PR−/HER2− (n=119), ER−/PR−/HER2+ (n=30), ER+/PR+/HER2- (n=482), and ER+/PR+/HER2+ (n=80) (a), or in breast tumor tissue samples with different subtype including basal (n=139), HER2 (n=67), LumA (n=417), LumB (n=191), and Normal like (n=23) (b). Statistical significance was determined by two-way ANOVA. The boxes show the median and the interquartile range. The whiskers show the minimum and maximum. (c and d) RNAScope® detection of LINK-A expression in human breast cancer and adjacent normal tissues (training and validation set, respectively). Left panel: representative images. Scale bars, 100µm; Right panel: statistical analysis. Training set: TNBC (n=10), ER−/PR−/HER2+ (n=7), ER+/PR+/HER2- (n=18), and ER+/PR+/HER2+ (n=2); Validation set: ER−/PR−/HER2- (n=38), ER−/PR−/HER2+ (n=2), ER+/PR+/HER2- (n=6), ER+/PR+/HER2+ (n=9), and normal tissue (n=20) (median, two-way ANOVA). (e) Recurrence free survival analysis of LINK-A status in breast cancer patients detected by qRT-PCR (n=123 patients, Gehan-Breslow test). (f) A list of top LINK-A-associated proteins identified by RNA pulldown and MS analysis in MDA-MB-231 cells. (g) RIP-qPCR detection of indicated RNAs retrieved by BRK-, LRRK2- or eIF4B-specific antibodies in MDA-MB-231 cells. Error bars, S.E.M., n=3 independent experiments (*p<0.05, two-tailed paired Student’s t-test). (h and i) In vitro RNA-protein binding assay showing the interaction of biotinylated LINK-A with wild-type (WT) FLAG-tagged BRK and deletion mutants (h), or WT Myc-tagged LRRK2 and deletion mutant (i). Dot-blot of RNA-protein binding samples indicates equal RNA transcript present in the assay. Bottom panel: graphic illustration of BRK or LRRK2 domain deletion mutants. (j) Upper panel: In vitro RNA-protein binding followed by dot-blot assays using biotinylated LINK-A sense (sen.) or anti-sense (as.) transcripts and GST-tagged, bacterially expression BRK or LRRK2 proteins. The hybridized RNA fragments were detected by Streptavidin-HRP. Bottom panel: graphic illustration of LINK-A probes. (k) Immunoblot (IB) detection of proteins retrieved by in vitro transcribed biotinylated LINK-A full-length (FL) or deletion mutants expressed in MDA-MB-231 cells. Unprocessed original scans of blots are shown in Supplementary Fig. 7.
Figure 2
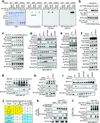
Figure 2. LINK-A is involved in a HB-EGF-triggered, EGFR:GPNMB-mediated signaling pathway
(a) Summary of phosphorylation sites of indicated proteins identified from RNA pulldown followed by MS analysis. (b) IP followed by IB detection of indicated proteins in MDA-MB-231cells treated with indicated growth factors for 30 min. (c) IB detection using indicated antibodies in MDA-MB-231 cells stimulated with vehicle, EGF or HB-EGF followed by DTSSP chemical crosslinking (1mM, 30 minutes). (d and e) His tag (d) or FLAG tag (e) pulldown followed by IB detection using indicated antibodies in MDA-MB-231 cells transfected with indicated expression vectors followed by HB-EGF stimulation. ECD: extracellular domain; TM: transmembrane domain; ICD: intracellular domain. (f) IP followed by IB detection of GPNMB, BRK, and HIF1α phosphorylation in MDA-MB-231 cells treated with indicated growth factors. (g) In vitro kinase assay using indicated recombinant proteins, followed by Coomassie blue staining (CBB), and IB detection using indicated antibodies. (h and i) IP followed by IB detection using indicated antibodies in cells transfected with indicated expression vectors followed by HB-EGF stimulation. Left panel (i): graphic illustration of BRK domain deletion mutants. Unprocessed original scans of blots are shown in Supplementary Fig. 7.
Figure 3
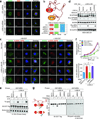
Figure 3. LINK-A mediates recruitment of BRK to GPNMB for kinase activation
(a) Immunofluorescence detection using indicated antibodies in MDA-MB-231 cells harboring control (upper panel) or LINK-A shRNA, followed by HB-EGF stimulation (upper panel). Scale bars, 20µm. (b) Graphic illustration of the BRK-, LRRK2-LINK-A interactions (upper panel) and corresponding deletion abolishing these interactions (lower panel). (c and d) Immunofluorescence imaging (c, Scale bars, 20µm) or IB detection (d) was performed using indicated antibodies in MDA-MB-231 cells transfected with LNA against LINK-A followed by overexpression of indicated rescue plasmids with HB-EGF stimulation. (e) In vitro kinase assay using recombinant BRK and in vitro transcribed RNA transcripts as indicated in the presence or absence of [32P]-ATP. Dot-blot indicates equal RNA transcript present in the assay. (f) Quantification analysis of BRK kinase activity in the presence of indicated in vitro transcribed RNA transcripts using HIF1α peptide (a.a. 557–566) as substrate. Upper panel: release of free Pi amount measured at OD620; lower panel: calculation of BRK kinase activity (pmol/min/µg). Error bars, S.E.M., n=3 independent experiments (*p<0.05, two-tailed paired Student’s t-test) (g) IB detection of BRK using indicated antibodies in the presence of indicated lncRNA transcripts with or without Caspase-1 digestion. Left panel: graphic illustration of Caspase-1-mediated BRK cleavage in the absence or presence of lncRNA. Unprocessed original scans of blots are shown in Supplementary Fig. 7. The dotted line on the blots of Fig. 3d indicates the position where the images of single blots were vertically cropped to juxtapose non-adjacent lanes. The uncropped blots are shown in Supplementary Fig. 7.
Figure 4
Figure 4. LINK-A-dependent BRK phosphorylation of HIF1α at Tyr565 antagonizes HIF1α Pro564 hydroxylation
(a) In vitro phosphorylation assay using recombinant proteins (WT or mutants as indicated). (b) In vitro kinase assay using bacterially expressed GST-tagged BRK WT or mutant and His-tagged HIF1α. (c–f) IB detection using indicated antibodies in MDA-MB-231 (c–e) or MDA-MB-468 (f) cells treated with HB-EGF at indicated time point (c) or transfected with indicated siRNAs followed by HB-EGF treatment (d–f). (g–i) IB detection using indicated antibodies in MDA-MB-231 cells treated with MG-132 followed by HB-EGF treatment at indicated time (g) or in cells transfected with indicated siRNAs followed by MG-132 and HB-EGF treatment (h and i). (j) LC-MS sequencing of HIF1α peptide (557–566) in in vitro hydroxylation assay. The total peptide number indicating proline nonhydroxylated vs. hydroxylated (P-OH) detected by LC-MS were shown. The peptide number of hydroxylated WT peptide was indicated as red. (k) His tag pulldown followed by IB detection of HIF1α phosphorylation and hydroxylation (WT vs. Y565F) in in vitro kinase assay (1°) followed by in vitro hydroxylation assay (2°). (l) IP followed by IB detection of HIF1α phosphorylation and hydroxylation (wt vs. Y565F) in MDA-MB-231 cells transfected with indicated plasmids and treated with MG-132 followed by HB-EGF treatment. Unprocessed original scans of blots are shown in Supplementary Fig. 7.
Figure 5
Figure 5. LINK-A-recruited LRRK2 phosphorylates HIF1α at Ser797, enhances HIF1α transcriptional activity and promotes tumor growth
(a and b) IP followed by IB detection using indicated antibodies in MDA-MB-231 cells transfected with indicated siRNAs (a) or plasmids (b), and treated with MG-132 followed by HB-EGF treatment. (c) IB detection using indicated antibodies in MDA-MB-231 cells transfected with LNA against LINK-A followed by overexpression of indicated rescue plasmids and HB-EGF stimulation. (d) HIF1α ChIP-seq analysis showing top enriched HIF binding consensus motifs. (e) HIF1α ChIP-seq analysis showing signaling pathways in MDA-MB-231 cells treated with HB-EGF. (f and g) ChIP-qPCR detection of HIF1α occupancy on indicated target gene promoters (f) and qRT-PCR analysis of HIF1α target genes expression (g) in MDA-MB-231 cells transfected with control or LINK-A siRNA followed by HB-EGF treatment. (h) Colony formation assay in MDA-MB-231 cells transduced with control and LINK-A shRNAs. Scale bars, 200µm. For panel fh, error bars, S.E.M., n=3 independent experiments (*p<0.05 and **p<0.01, two-tailed paired Student’s t-test). (i and j) In vivo analyses of tumor growth (i) or weight (j) in mice that were subcutaneously injected with MDA-MB-231 cells harboring control or LINK-A shRNA. Data are mean±S.E.M., n=5 mice per group (**p<0.01, two-tailed paired Student’s t-test). Unprocessed original scans of blots are shown in Supplementary Fig. 7. The dotted line on the blots of Fig. 5c indicates the position where the images of single blots were vertically cropped to juxtapose non-adjacent lanes. The uncropped blots are shown in Supplementary Fig. 7.
Figure 6
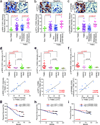
Figure 6. LINK-A-dependent normoxic HIF1α signaling pathway correlates with TNBC
(a–c) Immunohistochemical staining using antibodies against phospho-BRK (Tyr351) (a), phospho-HIF1α (Tyr565) (b), or phospho-GPNMB (Tyr525) (c) in human breast cancer tissues. Upper panel: representative image. Scale bars, 100µm; Lower panel: statistics analysis based on non-TNBC tissues (n=5) vs. TNBC tissues (n=40) and non-Metastasis (TnN0M0) TNBC (n=27) vs. Metastasis (TnN>0M>0) breast tissues (n=13) (median, two-way ANOVA). (d–f) Upper panel: statistical analysis of immunohistochemical staining using antibodies against phospho-BRK (Tyr351) (d), phospho-HIF1α (Tyr565) (e) or phospho-GPNMB (Tyr525) (f) in human breast cancer tissues including TNBC (n=10), ER−/PR−/HER2+ (n=7), ER+/PR+/HER2- (n=18), and ER+/PR+/HER2+ (n=2) (median, two-way ANOVA). Lower panel: Pearson’s correlation analysis comparing staining density between LINK-A expression and phospho-BRK (Tyr351) (d), phospho-HIF1α (Tyr565) (e), or phospho-GPNMB (Tyr525) (f) within the TNBC group (n=10 tissue samples, Fisher’s exact test). (g–i) Kaplan-Meier survival analysis of phosphor-BRK (Tyr351) (g), phosphor-HIF1α (Tyr565) (h), and phospho-GPNMB (Tyr525) (i) status in breast cancer patients (n=160, Gehan-Breslow test).

References

    1. Cancer Genome Atlas, N. Comprehensive molecular portraits of human breast tumours. Nature. 2012;490:61–70. - PMC - PubMed
    1. Foulkes WD, Smith IE, Reis-Filho JS. Triple-negative breast cancer. N Engl J Med. 2010;363:1938–1948. - PubMed
    1. Hudis CA, Gianni L. Triple-negative breast cancer: an unmet medical need. Oncologist. 2011;16(Suppl 1):1–11. - PubMed
    1. Prensner JR, Chinnaiyan AM. The emergence of lncRNAs in cancer biology. Cancer Discov. 2011;1:391–407. - PMC - PubMed
    1. Cheetham SW, Gruhl F, Mattick JS, Dinger ME. Long noncoding RNAs and the genetics of cancer. Br J Cancer. 2013;108:2419–2425. - PMC - PubMed

MeSH terms

Substances