Review
. 2016 Jan 7;8(1):28.
doi: 10.3390/nu8010028.

Ageing Is Associated with Decreases in Appetite and Energy Intake--A Meta-Analysis in Healthy Adults

Affiliations
Review

Ageing Is Associated with Decreases in Appetite and Energy Intake--A Meta-Analysis in Healthy Adults

Caroline Giezenaar et al. Nutrients. .

Abstract

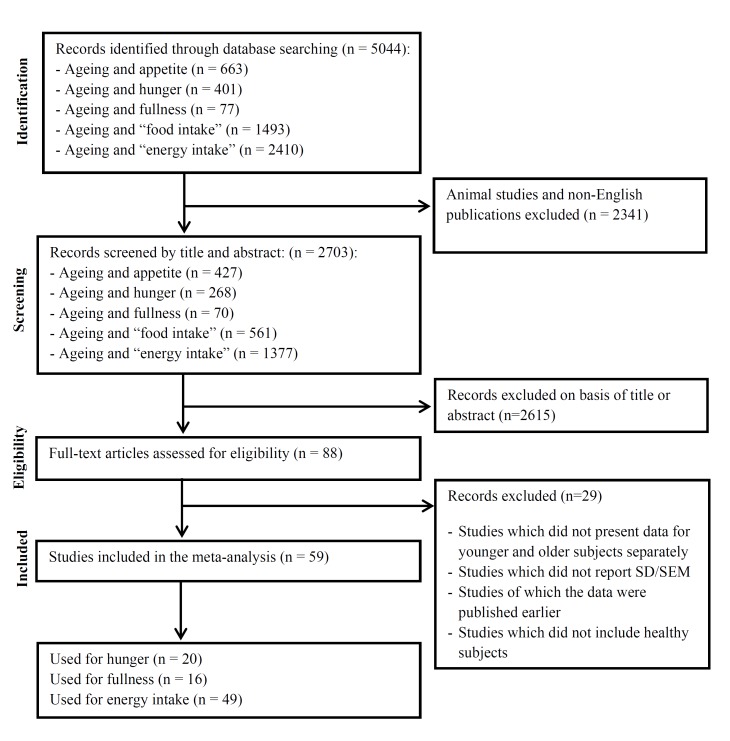
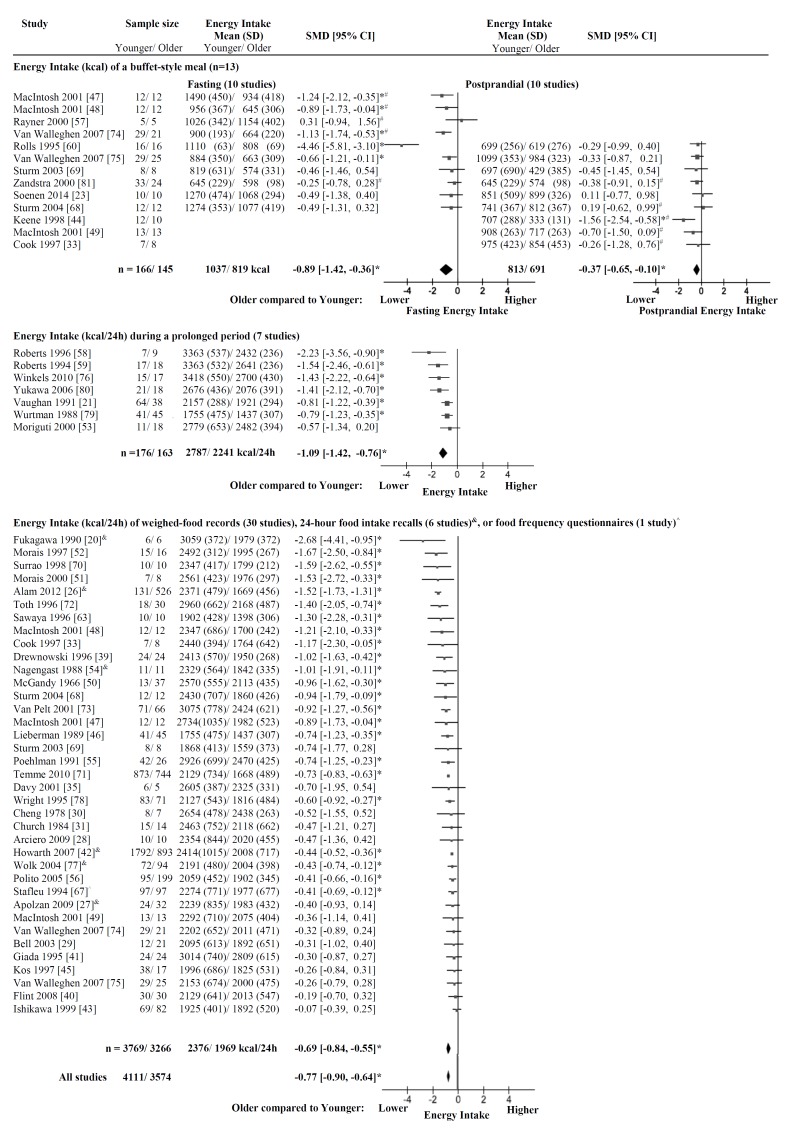
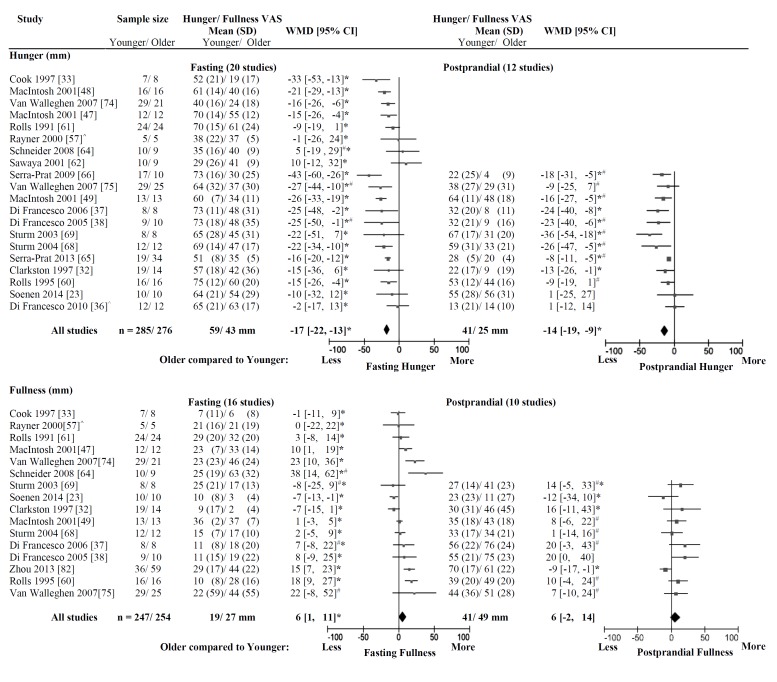
It is not well recognized that in the elderly weight loss is more common than weight gain. The aim of this analysis was to determine the effect of ageing on appetite (hunger/fullness) and energy intake, after overnight fasting and in a postprandial state, by meta-analyses of trials that included at least two age groups (>18 years). We hypothesized that appetite and energy intake would be less in healthy older compared with younger adults. Following a PubMed-database systematic search up to 30 June 2015, 59 studies were included in the random-effects-model meta-analyses. Energy intake was 16%-20% lower in older (n = 3574/~70 years/~71 kg/~25 kg/m²) than younger (n = 4111/~26 years/~69 kg/~23 kg/m²) adults (standardized mean difference: -0.77 (95% confidence interval -0.90 to -0.64)). Hunger was 25% (after overnight fasting; weighted mean difference (WMD): -17 (-22 to -13) mm) to 39% (in a postprandial state; WMD: -14 (-19 to -9) mm) lower, and fullness 37% (after overnight fasting; WMD: 6 mm (95% CI: 1 to 11 mm)) greater in older than younger adults. In conclusion, appetite and energy intake are less in healthy older than younger adults, suggesting that ageing per se affects food intake.

Keywords: ageing; appetite; elderly; energy intake; fullness; hunger.


Figures

Figure 1
Figure 1
Flow diagram for the selection of studies.
Figure 2
Figure 2
Energy intake. Mean ± SD of energy intake (kcal) and a plot of the standardized mean difference (SMD; mm) of energy intake in older compared with younger subjects with the DerSimonian and Laird random-effect model. The horizontal lines denote the 95% confidence interval; ▀ point estimates (the size of the square corresponds to its weight); ♦ the pooled estimate of age effect. Three different methods of measuring energy intake were distinguished: (i) energy intake of a single ad libitum buffet-style meal at the research facility after overnight fasting and in a postprandial state after a nutrient preload, administered orally or infused directly into the small intestine; (ii) energy intake of provided food items during a prolonged period; and (iii) energy intake of weighed food records, 24-h food intake recalls, or food frequency questionnaires. In the total group of 7685 subjects, energy intake was less (SMD: −0.77 (95% CI −0.90 to −0.64), I2 = 76%, p < 0.001) in the older than the younger adults. * p < 0.05 energy intake significantly less in older than younger adults within the study; # data were derived from a figure of the original publication; food records, & 24-h food intake recalls; or ^ food frequency questionnaires.
Figure 3
Figure 3
Appetite. Mean ± SD of appetite (hunger and fullness; Visual Analogue Scale (VAS; mm)) after overnight fasting and in a postprandial state and a plot of the weighted mean difference (WMD; mm) of appetite in older compared with younger subjects with the DerSimonian and Laird random-effect model. The horizontal lines denote the 95% confidence interval; ▀ point estimates (the size of the square corresponds to its weight); ♦ the pooled estimate of the age effect. Older compared to younger adults were less hungry (WMD: −17 mm (95% CI −22 to −13 mm), I2 = 52%, p = 0.004) and more full (WMD: 6 mm 95% CI 1 to 11 mm, I2 = 76%, p < 0.001) after overnight fasting and less hungry (WMD: −14 mm (95% CI −19 to −9 mm), I2 = 53%, p = 0.01) in a postprandial state, whereas fullness was comparable (WMD: 6 mm (95% CI −2 to 14 mm), I2 = 54%, p = 0.02). * p < 0.05 appetite (hunger/fullness) significantly different in older than younger adults within the study; # data were derived from a figure of the original publication; ^ data were provided by the investigators by e-mail upon request.

Similar articles

Cited by

References

    1. Australian Institute of Health and Welfare (AIHW) Australia's Health. AIHW; Canberra, Australia: 2014. (Ausrtalia’s Health Series No. 14. Cat. No. AUS 178).
    1. Thibault R., Chikhi M., Clerc A., Darmon P., Chopard P., Genton L., Kossovsky M.P., Pichard C. Assessment of food intake in hospitalised patients: A 10-year comparative study of a prospective hospital survey. Clin. Nutr. 2011;30:289–296. doi: 10.1016/j.clnu.2010.10.002. - DOI - PubMed
    1. Koehler K.M. The New Mexico aging process study. Nutr. Rev. 1994;52:S34–S37. doi: 10.1111/j.1753-4887.1994.tb01446.x. - DOI - PubMed
    1. Sjogren A., Osterberg T., Steen B. Intake of energy, nutrients and food items in a ten-year cohort comparison and in a six-year longitudinal perspective: A population study of 70- and 76-year-old swedish people. Age Ageing. 1994;23:108–112. doi: 10.1093/ageing/23.2.108. - DOI - PubMed
    1. Briefel R.R., McDowell M.A., Alaimo K., Caughman C.R., Bischof A.L., Carroll M.D., Johnson C.L. Total energy intake of the us population: The third national health and nutrition examination survey, 1988–1991. Am. J. Clin. Nutr. 1995;62:1072S–1080S. - PubMed

LinkOut - more resources