. 2016 Jan 6;6(1):5.
doi: 10.3390/biom6010005.

Moderate (2%, v/v) Ethanol Feeding Alters Hepatic Wound Healing after Acute Carbon Tetrachloride Exposure in Mice

Affiliations

Moderate (2%, v/v) Ethanol Feeding Alters Hepatic Wound Healing after Acute Carbon Tetrachloride Exposure in Mice

Krutika T Deshpande et al. Biomolecules. .

Abstract

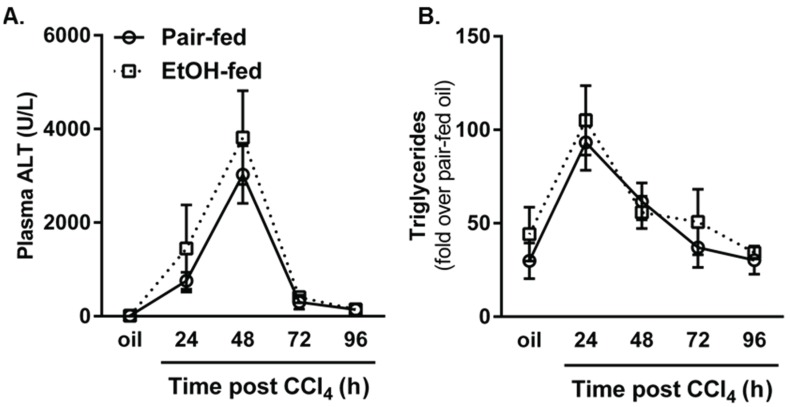
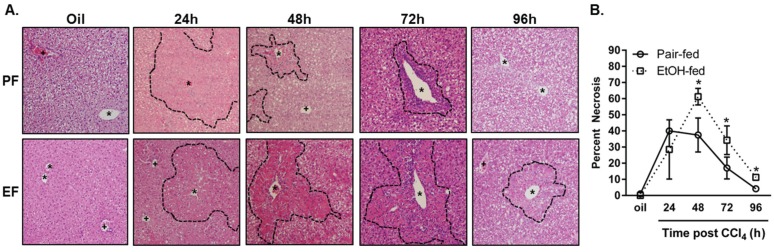
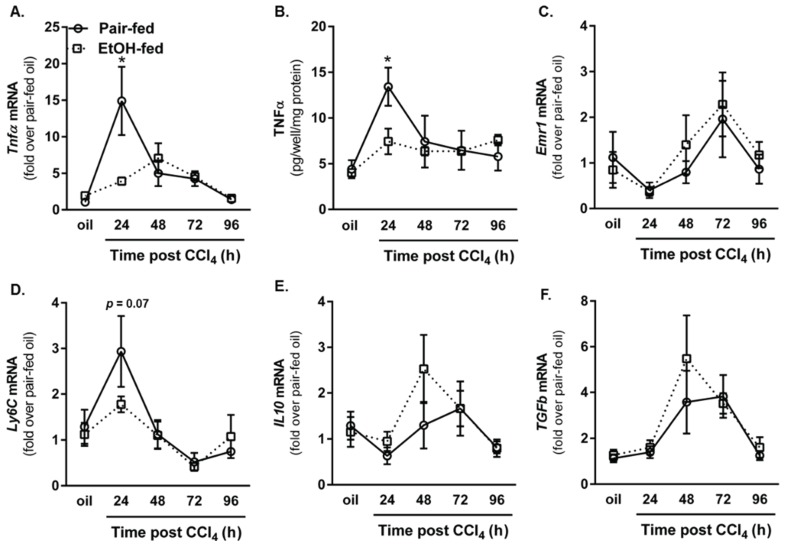
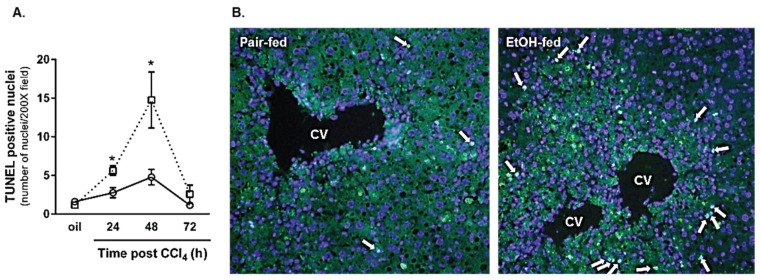
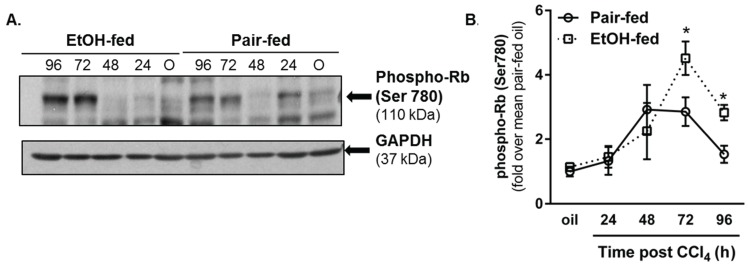
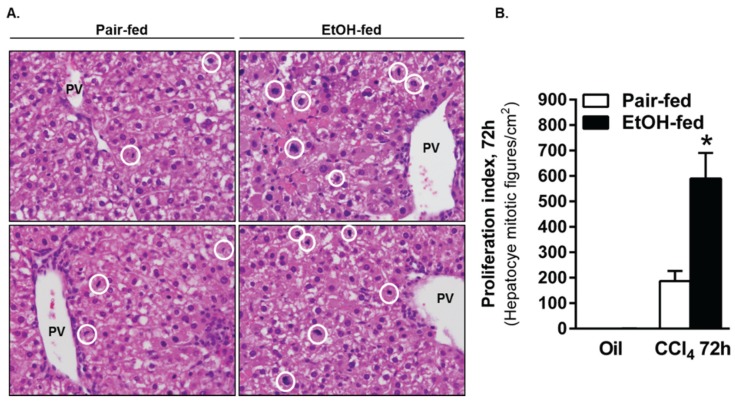
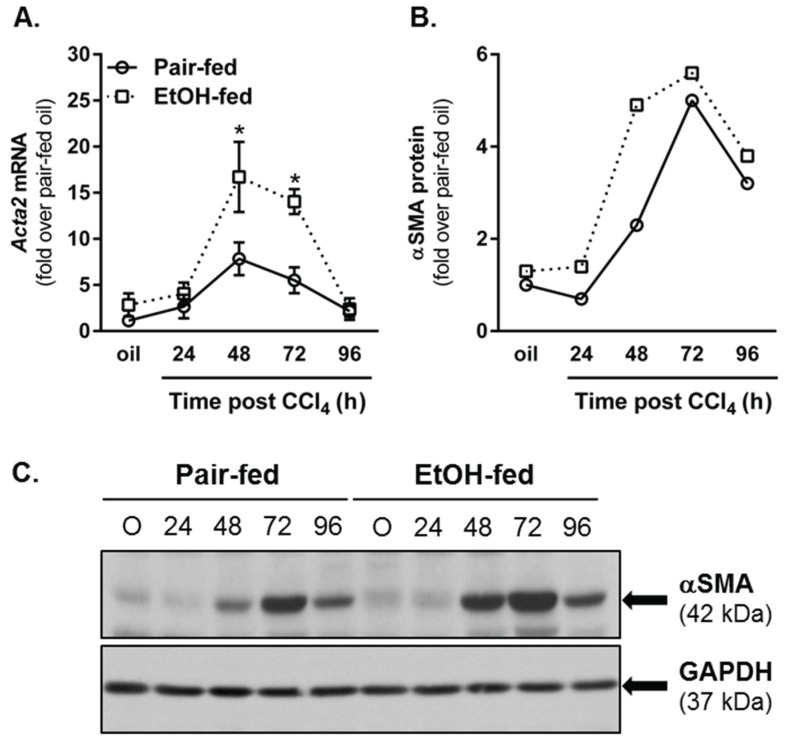
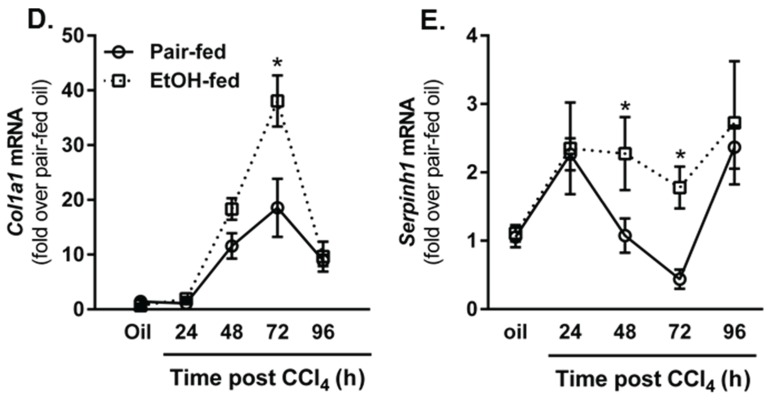
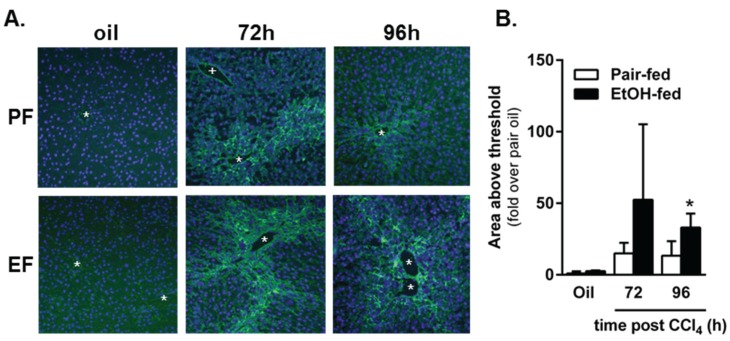
Wound healing consists of three overlapping phases: inflammation, proliferation, and matrix synthesis and remodeling. Prolonged alcohol abuse can cause liver fibrosis due to deregulated matrix remodeling. Previous studies demonstrated that moderate ethanol feeding enhances liver fibrogenic markers and frank fibrosis independent of differences in CCl₄-induced liver injury. Our objective was to determine whether or not other phases of the hepatic wound healing response were affected by moderate ethanol after CCl₄ exposure. Mice were fed moderate ethanol (2% v/v) for two days and then were exposed to CCl₄ and euthanized 24-96 h later. Liver injury was not different between pair- and ethanol-fed mice; however, removal of necrotic tissue was delayed after CCl₄-induced liver injury in ethanol-fed mice. Inflammation, measured by TNFα mRNA and protein and hepatic Ly6c transcript accumulation, was reduced and associated with enhanced hepatocyte apoptosis after ethanol feeding. Hepatocytes entered the cell cycle equivalently in pair- and ethanol-fed mice after CCl₄ exposure, but hepatocyte proliferation was prolonged in livers from ethanol-fed mice. CCl₄-induced hepatic stellate cell activation was increased and matrix remodeling was prolonged in ethanol-fed mice compared to controls. Taken together, moderate ethanol affected each phase of the wound healing response to CCl₄. These data highlight previously unknown effects of moderate ethanol exposure on hepatic wound healing after acute hepatotoxicant exposure.

Keywords: carbon tetrachloride; ethanol; fibrosis; inflammation; liver regeneration; matrix remodeling; wound healing.


Figures

Figure 1
Figure 1
Hepatic CYP2E1 content and activity did not differ between control (pair-fed) or ethanol-fed mice. Mice were allowed free-access to a 2% (v/v) ethanol-containing Lieber-DiCarli diet, or pair-fed a control diet, for 10 days. Livers were harvested, a portion of which was used for performing a CYP2E1 immunoblot (A,C) while a separate portion was used to perform a CYP2E1 activity assay (B). In (B), the positive (+ve) control was generated by using microsomes isolated from mice fed a 5% (v/v) ethanol-containing diet for four weeks. The negative (−ve) control was generated by using microsomes isolated from mice 24 h after a single CCl4 exposure (CCl4 consumptively depletes CYP2E1). N = 4–8 mice per group.
Figure 2
Figure 2
CCl4-induced liver injury and steatosis were not affected by ethanol feeding to mice. Mice were allowed free-access to a 2% (v/v) ethanol containing diet for two days and then were exposed to CCl4 and euthanized 24, 48, 72 or 96 h thereafter, while remaining on the ethanol diet. Control animals were pair-fed a diet that isocalorically substituted maltose dextrins for ethanol. (A) Plasma ALT was used to determine hepatic injury; (B) A biochemical assay was used to quantify hepatic triglyceride content. N = 4–8 mice per group.
Figure 3
Figure 3
Moderate ethanol feeding delayed removal of nectrotic tissue after CCl4 exposure. Mice were allowed free-access to a 2% (v/v) ethanol containing diet for 2 days and then were exposed to CCl4 and euthanized 24, 48, 72 or 96 h thereafter while remaining on the ethanol diet. Control animals were pair-fed a diet that isocalorically substituted maltose dextrins for ethanol. (A) Representative micrographs taken of hematoxylin and eosin stained liver sections taken at the time points indicated. The dashed line demarks boundary of injured (24 h) or necrotic hepatocytes (48, 72, 96 h). PF = pair-fed, EF = ethanol-fed, asterisk = central vein, plus sign = portal vein; (B) Percent necrotic area graphed over time post CCl4 in pair- and ethanol-fed mice. N = 4–8 mice per group.
Figure 4
Figure 4
Ethanol feeding suppressed hepatic inflammation early after CCl4 exposure. Real-time PCR (A) was used to determine hepatic Tnfα transcript level, while an ELISA (B) was used to determine TNFα concentration in peripheral blood from pair- and ethanol-fed mice after CCl4. Hepatic transcripts for the F4/80 gene (Emr1 (C); Ly6C (D); Il10 (E) and Tgfβ (F)) were determined using real-time PCR. For real time PCR, data are expressed as fold change over pair-fed, olive oil exposed mice after normalization to 18S. N = 4–8 mice per group. * p <0.05.
Figure 5
Figure 5
Hepatocyte apoptosis was increased in livers from ethanol-fed mice 24 and 48 h after CCl4 exposure. The terminal deoxynucleotidyl transferase dUTP nick end labeling (TUNEL) assay was used to determine the number of apoptotic hepatocyte nuclei in livers from pair- and ethanol-fed mice 24, 48, and 72 h after CCl4 exposure. (A) Quantification of the number of TUNEL-positive hepatocyte nuclei in each 200× image (three non-overlapping images per animal); (B) Representative TUNEL staining from pair- and ethanol-fed mice 48 h (maximum hepatocyte apoptosis) after CCl4 exposure. N = 4 mice per group. * p < 0.05.
Figure 6
Figure 6
Moderate ethanol feeding enhanced hepatic cyclin content after CCl4 exposure. Cyclin D1 (AC), cyclin E1 (DF), cyclin A2 (GI) and cyclin B1 (JL) were each analyzed in livers from pair-and ethanol-fed mice after CCl4 exposure. In (A,D,G,J), real time PCR was used to determine hepatic content of cyclin transcripts while in (C,F,I,L), immunoblotting was used to determine hepatic cyclin protein content from pooled liver samples (n = 4–8 mice per group). Real time PCR data are expressed as fold change over pair-fed, olive oil exposed mice after normalization to 18S. Protein band integrated density was determined for each cyclin and GAPDH (loading control) band. After normalization to GAPDH, band densities were used to calculate fold change in cyclin protein over pair-fed mice exposed to olive oil (oil). N = 4–8 mice per group. * p < 0.05.
Figure 7
Figure 7
Phosphorylation of the retinoblastoma (Rb) protein was increased by moderate ethanol feeding to mice. Mice on ethanol-containing diets were exposed to CCl4 and euthanized 24–96 h later. Immunoblots were used to determine hepatic content of phospho-Rb (Ser780) in livers from each mouse. (A) Representative phospho-Rb immunoblot. GAPDH was used as a loading control; (B) Semi-quantification of band densities from all blots after normalization to GAPDH. Data are graphed as fold change over pair-fed, olive oil-treated mice. N = 4–8 mice per group. * p < 0.05.
Figure 8
Figure 8
Moderate ethanol feeding to mice sustained hepatocyte proliferation late in the time course after CCl4 exposure. (A) Representative images from Ki67-stained livers from pair- and ethanol-fed mice by immunofluorescense (green) after CCl4. DAPI (blue) was used as a nuclear counterstain. Sections were stained on the same day and exposure times kept constant for each image; (B) Quantification of the number of Ki67-positive hepatocyte nuclei in 3–4 images from a single liver section per mouse. PF = Pair-fed, EF = Ethanol-fed. N = 3–4 mice per group. * p < 0.05.
Figure 9
Figure 9
The number of mitotic figures was greater in livers from ethanol-fed mice 72 h after CCl4 exposure. (A) Representative images from H&E stained liver sections taken from mice 72 h after CCl4 exposure. Mitotic figures were found predominantly in Zones 1 and 2, so the images were captured using the portal vein as a landmark. The white circles in each image outline mitotic cells. (B) Graphical representation of the number of mitotic cells in livers from pair and ethanol-fed mice 72 h after CCl4 exposure. Mitotic figures were rare or not present at other time points evaluated. N = 4–8 mice per group. * p < 0.05.
Figure 10
Figure 10
Moderate ethanol feeding enhanced hepatic stellate cell (HSC) activation after acute CCl4 exposure. (A) Real time PCR was used to measure hepatic Acta2 transcript accumulation. Data are expressed as fold change over pair-fed, olive oil-exposed mice after normalization to 18S; (B) Semi-quantification of αSMA band density expressed as fold change of pair-fed, olive oil exposed mice after normalization to GAPDH as a loading control; (C) Representative αSMA immunoblot. Hepatic Col1a1 (D) and Serpinh1 (E) transcript accumulation were determined using real-time PCR. Data are expressed as fold change over pair-fed, olive oil-exposed mice after normalization to 18S. N = 4–8 mice per group. * p < 0.05.
Figure 10
Figure 10
Moderate ethanol feeding enhanced hepatic stellate cell (HSC) activation after acute CCl4 exposure. (A) Real time PCR was used to measure hepatic Acta2 transcript accumulation. Data are expressed as fold change over pair-fed, olive oil-exposed mice after normalization to 18S; (B) Semi-quantification of αSMA band density expressed as fold change of pair-fed, olive oil exposed mice after normalization to GAPDH as a loading control; (C) Representative αSMA immunoblot. Hepatic Col1a1 (D) and Serpinh1 (E) transcript accumulation were determined using real-time PCR. Data are expressed as fold change over pair-fed, olive oil-exposed mice after normalization to 18S. N = 4–8 mice per group. * p < 0.05.
Figure 11
Figure 11
Matrix metabolism was sustained by ethanol feeding to mice after acute CCl4 exposure. In situ zymography was used to determine area of gelatinase activity in frozen liver sections from pair- and ethanol-fed mice after CCl4 exposure. (A) Representative fluorescence microscopy images. The green fluorescence indicates area of gelatinase activity. The blue fluorescence (DAPI) was used as a nuclear counter stain. The asterisks denote location of central veins, while the plus sign (PF, 72 h only) denotes the location of a portal vein. Matrix metabolism occurs most robustly in the pericentral area where CCl4-induced liver injury and subsequent liver regeneration occurs; (B) Quantification of the area of fluorescence per 200× image as a fold change over pair-fed, olive oil-treated mice. PF = Pair-fed, EF = Ethanol-fed. N = 3–6 mice per group (CCl4). * (in B), p < 0.05.
Figure 12
Figure 12
Effect of moderate ethanol feeding to mice on the liver wound healing response after acute hepatotoxin exposure. In (A), three phases of wound healing, inflammation (black dotted line), cell proliferation (red dotted line) and HSC activation, matrix synthesis and remodeling (blue dotted line) are depicted as overlapping curves which peak at 100% of normal response after acute CCl4; In (B), the effect of moderate ethanol on these three phases of wound healing after acute CCl4 exposure are depicted. The arrows added to the graph indicate that ethanol decreased (black downward arrow), prolonged (red right arrow) or enhanced (blue upward arrow) the related phase of the wound healing response. In brief, the data contained in this study demonstrated that early after CCl4-induced acute liver injury, inflammation is reduced in ethanol-fed mice relative to pair-fed mice. Reduced inflammation was associated with increased hepatocyte apoptosis (yellow “apoptosis” star), which occurred in parallel with a prolonged hepatocyte proliferative response. Moreover, indices of HSC activation were enhanced (peak values greater) in ethanol-fed mice. Finally, matrix degradation was prolonged in livers from ethanol-fed mice. Question marks indicate that more data is required to determine whether or not the ethanol-mediated effect, enhancement or prolongation, occurs in that phase of the wound healing response. We propose that reduction in TNFα, a surrogate marker for hepatoprotective inflammation, in ethanol-fed mice was responsible for increased apoptotic hepatocyte death and, therefore, the need for more robust hepatocyte proliferation, ECM synthesis and remodeling after CCl4-induced acute liver injury.

References

    1. Bataller R., Rombouts K., Altamirano J., Marra F. Fibrosis in alcoholic and nonalcoholic steatohepatitis. Best Prac. Res. Clin. Gastroenterol. 2011;25:231–244. doi: 10.1016/j.bpg.2011.02.010. - DOI - PubMed
    1. Gao B., Bataller R. Alcoholic liver disease: Pathogenesis and new therapeutic targets. Gastroenterology. 2011;141:1572–1585. doi: 10.1053/j.gastro.2011.09.002. - DOI - PMC - PubMed
    1. Schuppan D., Kim Y.O. Evolving therapies for liver fibrosis. J. Clin. Investig. 2013;123:1887–1901. doi: 10.1172/JCI66028. - DOI - PMC - PubMed
    1. Diegelmann R.F., Evans M.C. Wound healing: An overview of acute, fibrotic and delayed healing. Front. Biosci. 2004;9:283–289. doi: 10.2741/1184. - DOI - PubMed
    1. Brem H., Tomic-Canic M. Cellular and molecular basis of wound healing in diabetes. J. Clin. Investig. 2007;117:1219–1222. doi: 10.1172/JCI32169. - DOI - PMC - PubMed

Publication types

MeSH terms

LinkOut - more resources