. 2016 Jan 11;11(1):e0144200.
doi: 10.1371/journal.pone.0144200. eCollection 2016.

A Probabilistic Atlas of Diffuse WHO Grade II Glioma Locations in the Brain

Affiliations

A Probabilistic Atlas of Diffuse WHO Grade II Glioma Locations in the Brain

Sarah Parisot et al. PLoS One. .

Abstract

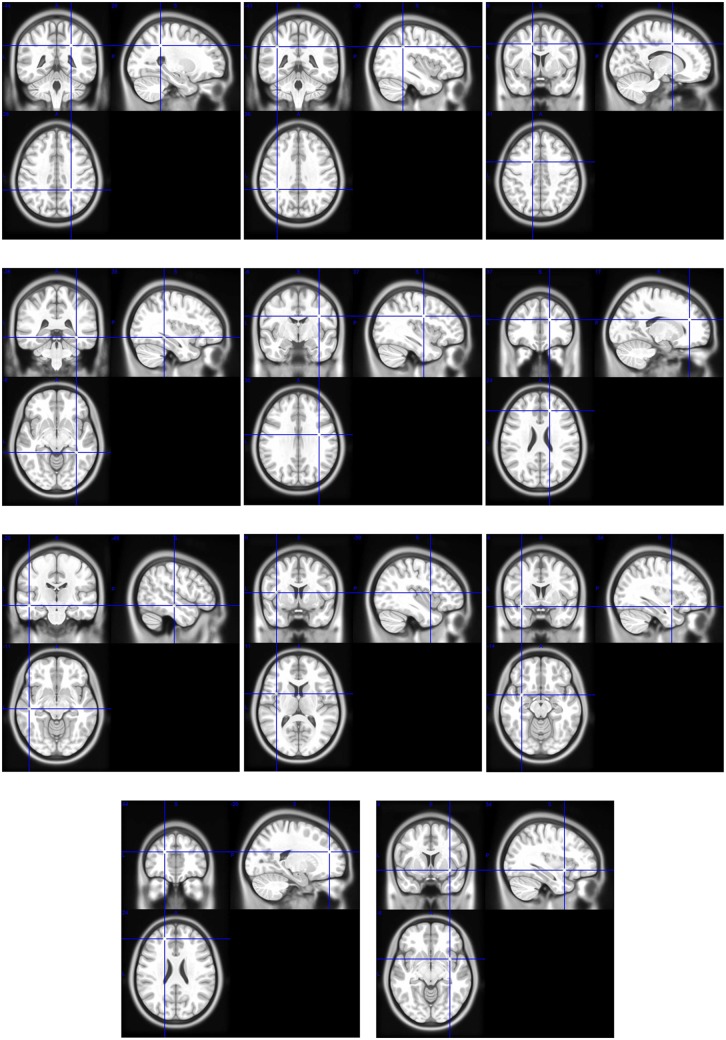
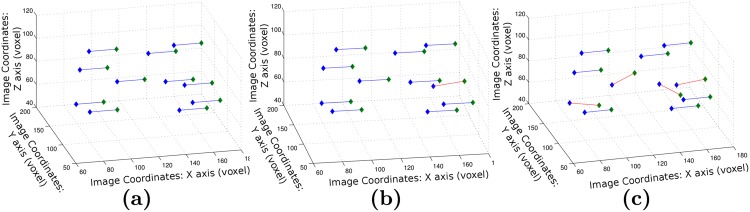
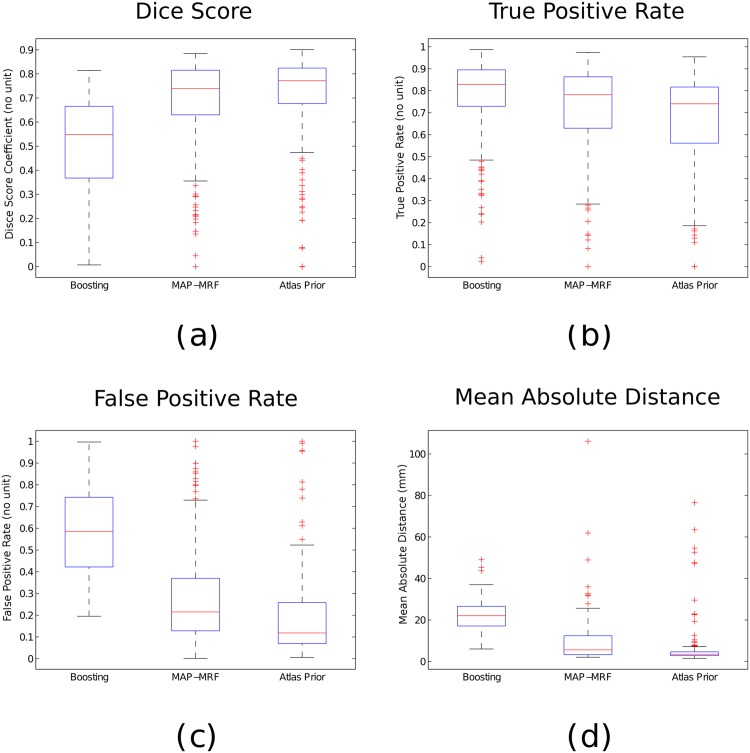
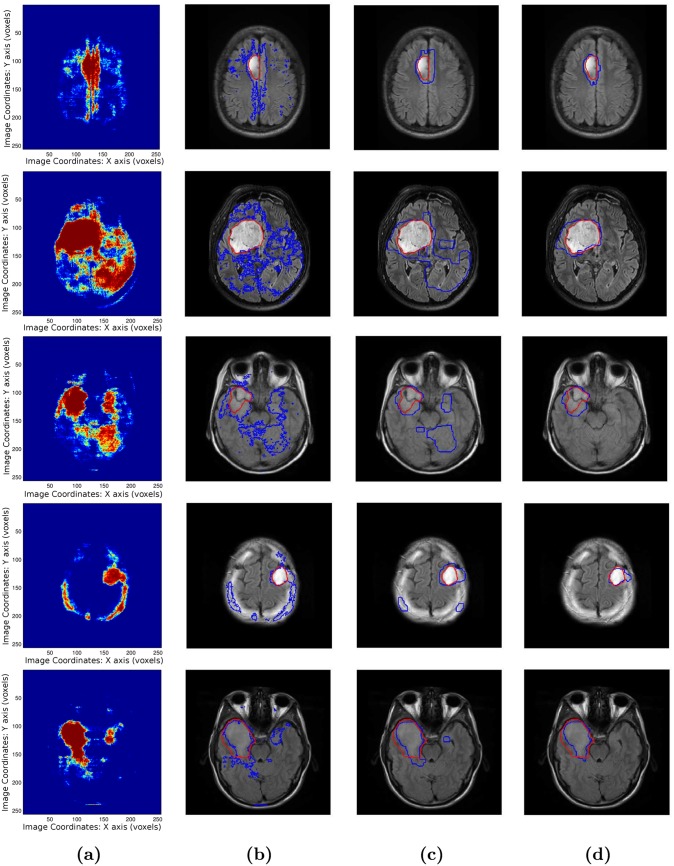
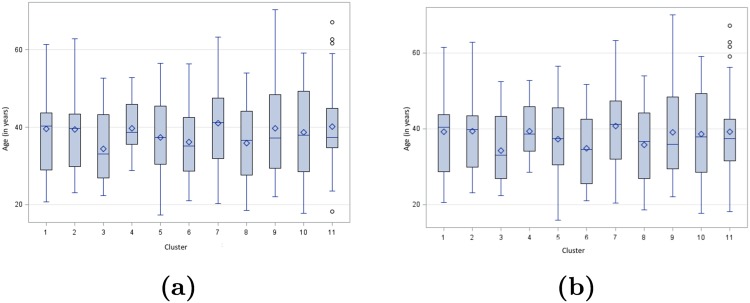
Diffuse WHO grade II gliomas are diffusively infiltrative brain tumors characterized by an unavoidable anaplastic transformation. Their management is strongly dependent on their location in the brain due to interactions with functional regions and potential differences in molecular biology. In this paper, we present the construction of a probabilistic atlas mapping the preferential locations of diffuse WHO grade II gliomas in the brain. This is carried out through a sparse graph whose nodes correspond to clusters of tumors clustered together based on their spatial proximity. The interest of such an atlas is illustrated via two applications. The first one correlates tumor location with the patient's age via a statistical analysis, highlighting the interest of the atlas for studying the origins and behavior of the tumors. The second exploits the fact that the tumors have preferential locations for automatic segmentation. Through a coupled decomposed Markov Random Field model, the atlas guides the segmentation process, and characterizes which preferential location the tumor belongs to and consequently which behavior it could be associated to. Leave-one-out cross validation experiments on a large database highlight the robustness of the graph, and yield promising segmentation results.


Conflict of interest statement

Competing Interests: Authors SP and SC are affiliated to a commercial company: Intrasense SAS (www.intrasense.fr). This does not alter the authors’ adherence to PLOS ONE policies on sharing data and materials.

Figures

Fig 1
Fig 1. Network representation of the whole data-set before clustering superimposed to the mean registered image.
The nodes are located in the center of gravity of the tumors and bigger nodes have bigger network centrality (i.e. they are strongly connected to many other nodes). The edges colors and strength represent the distance between nodes (from red and thick (short distance) to blue and thin). For visibility reasons, arcs corresponding to a distance greater than 35 are not displayed.
Fig 2
Fig 2. Examples of cluster probability maps describing the spatial repartition of tumors in the cluster.
The maps are superimposed to the mean registered image.
Fig 3
Fig 3. Cluster validity indices with respect to the value of α (a, b, c, d) and the number of clusters (e).
Dunn index (a), Davies Bouldin index (b), Silhouette index (c) and combined indices (d, e).
Fig 4
Fig 4. Visualization of the complete clustered graph superimposed to the mean registered image.
The numbers correspond to the number of nodes in each cluster.
Fig 5
Fig 5. Positions of the cluster centers on the MNI atlas.
The clusters are organized in numerical order (from cluster 1 to 11).
Fig 6
Fig 6. Examples of graph matching results.
(a) Complete match, (b, c) Partial match. Positive matches correspond to blue edges and mismatched samples to red edges. The nodes’ locations correspond to the coordinates of the cluster centres of each clustering. The green nodes have been translated along the x axis for visualisation purposes.
Fig 7
Fig 7. Boxplots of the Dice score (a), True Positive rate (b), False positive rate (c), and MAD score (d) between the automatic and manual tumor segmentation for the three different methods.
Fig 8
Fig 8. Visual Segmentation results.
(a) boosting score, (b) Boosting classification (thresholding), (c) Pairwise MRF, (d) MRF with spatial prior.
Fig 9
Fig 9. Patient’s age at the time of the first symptoms (a) and MRI diagnosis (b) for each cluster.

References

    1. Duffau H (2009) Surgery of low-grade gliomas: towards a ‘functional neurooncology’. Curr Opin Oncol 21: 543–549. 10.1097/CCO.0b013e3283305996 - DOI - PubMed
    1. Rigau V, Zouaoui S, Mathieu-Daudé H, Darlix A, Maran A, et al. (2011) French brain tumor database: 5-year histological results on 25 756 cases. Brain Pathology 21: 633–644. 10.1111/j.1750-3639.2011.00491.x - DOI - PMC - PubMed
    1. Dolecek TA, Propp JM, Stroup NE, Kruchko C (2012) Cbtrus statistical report: primary brain and central nervous system tumors diagnosed in the united states in 2005–2009. Neuro-Oncology 14: v1–v49. 10.1093/neuonc/nos218 - DOI - PMC - PubMed
    1. Capelle L, Fontaine D, Mandonnet E, Taillandier L, Golmard JL, et al. (2013) Spontaneous and therapeutic prognostic factors in adult hemispheric world health organization grade ii gliomas: a series of 1097 cases: Clinical article. Journal of Neurosurgery 118: 1157–1168. 10.3171/2013.1.JNS121 - DOI - PubMed
    1. Gerin C, Pallud J, Grammaticos B, Mandonnet E, Deroulers C, et al. (2012) Improving the time-machine: estimating date of birth of grade ii gliomas. Cell Proliferation 45: 76–90. 10.1111/j.1365-2184.2011.00790.x - DOI - PMC - PubMed

Publication types