. 2016 Jan 11;12(1):e1005616.
doi: 10.1371/journal.pgen.1005616. eCollection 2016 Jan.

Genome-Wide Analysis Reveals Novel Regulators of Growth in Drosophila melanogaster

Affiliations

Genome-Wide Analysis Reveals Novel Regulators of Growth in Drosophila melanogaster

Sibylle Chantal Vonesch et al. PLoS Genet. .

Abstract

Organismal size depends on the interplay between genetic and environmental factors. Genome-wide association (GWA) analyses in humans have implied many genes in the control of height but suffer from the inability to control the environment. Genetic analyses in Drosophila have identified conserved signaling pathways controlling size; however, how these pathways control phenotypic diversity is unclear. We performed GWA of size traits using the Drosophila Genetic Reference Panel of inbred, sequenced lines. We find that the top associated variants differ between traits and sexes; do not map to canonical growth pathway genes, but can be linked to these by epistasis analysis; and are enriched for genes and putative enhancers. Performing GWA on well-studied developmental traits under controlled conditions expands our understanding of developmental processes underlying phenotypic diversity.


Conflict of interest statement

The authors have declared that no competing interests exist.

Figures

Fig 1
Fig 1. Analysis of 26 size traits in the DGRP.
(a) Standardized Drosophila culture conditions for the quantification of morphometric traits. The protocol extends over three generations and efficiently controls known covariates of size, such as temperature, humidity, day-night-cycle and crowding. Additionally, effects of other environmental covariates, such as intra-vial environment, light intensity and incubator position, are randomized. (b) Illustration of the wing features. L2_AP and L5_AP are not illustrated; they comprise the area between the AP boundary and L2 or L5, respectively, and serve as measures for the size of the anterior and posterior part of the wing. (c) Genetic correlation between morphometric traits in females. Two modules of higher correlation are clearly visible (bright yellow): one encompassing almost all wing features and one comprising all head/thorax traits. (d) Cumulative variance explained in female data by increasing number of principal components. (e) Variables factor map. PC1 and PC2 separate the data into two groups. (f) Correlation between PCs and traits. PC1 reflects a general size component and PC2 is highly correlated with head/thorax traits, effectively splitting the data into two groups.
Fig 2
Fig 2. Phenotypic variation in the DGRP for two size traits.
Plots show mean phenotypic values for (a) centroid size and (b) interocular distance. Each dot represents the mean phenotype per line of males (black) and corresponding females (red), with error bars denoting one standard deviation. Lines are ordered on the x-axis according to male trait value, from lowest to highest: consequently, the order of lines is different for each plot. Raw phenotypes and line means are listed in S2 Table. To the right are illustrations of both measures.
Fig 3
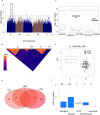
Fig 3. Genome-wide association of size traits.
(a) Manhattan plot of the SNP p-values from the IOD GWAS in females shows that nominally associated SNPs are distributed over all chromosomes. Negative log10 p-values are plotted against genomic position, the black horizontal line denotes the nominal significance threshold of 10−05 and the black box marks the location of the cluster of Bonferroni-significant SNPs upstream of kek1 on 2L. (b) Correlation between SNPs nominally associated with female IOD. The cluster of Bonferroni-significant SNPs on 2L shows high correlation among individual SNPs over a larger region, whereas most other SNPs except a few in a narrow region on 3L represent individual associations. Blue = No correlation, orange = complete correlation. Pixels represent individual SNPs and black lines divide chromosomes. (c) Locus zoom plot of the region 20kb upstream of kek1 hat harbors the genome-wide significant associations. The black horizontal line denotes the genome-wide significance threshold (p = 3.8x10-08) and the locations of kek1 and the ncRNA CR43818 are marked by broad black lines. (d) Lines with the minor allele genotype at the most significantly associated locus have a larger IOD than lines with the major allele. (e) Overlap in the number of nominally associated SNPs for different wing traits in females. The overlap is bigger between the absolute wing size phenotypes and only a few SNPs are candidates for all traits. (f) Nominally associated SNPs are most abundant in the intergenic space and in regulatory regions. Boxes show the distribution of negative log10 p-values of the SNPs nominally associated to rCS in females among site classes. Numbers of SNPs belonging to each site class are denoted above the boxes. As a SNP can fall into multiple classes, the sum of SNPs from all site classes is higher than the total number of nominally associated SNPs.
Fig 4
Fig 4. Associated SNPs overlap 33 functionally diverse novel candidate genes for wing size determination and localize within putative enhancer elements.
(a) Validated genes in females. Bars show the percent change in median wing area compared to CG1315 RNAi upon wing-specific knockdown of candidate genes. Only the lines yielding a significant wing size change (p<0.001, Wilcoxon rank sum test) are depicted. (b) Alignment of the 2kb region on chromosome arm 2L upstream of the D. melanogaster ex locus that shows sequence conservation across Drosophila species. The position of the SNP is indicated by the vertical blue line. The D. melanogaster sequence is represented by the dark grey bar at the top (“Sequence”). The respective sequences of each compared species are represented below. Light grey regions are matches to the D. melanogaster sequence, red regions are mismatches, gaps in the alignment are denoted by horizontal red lines and insertions by black lines and arrows.
Fig 5
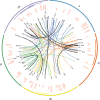
Fig 5. Pairwise interactions between focal genes and DGRP SNPs for male wing size (rCSM).
The plot shows the focal genes annotated in black and the interactors in red. Interaction lines are colored according to the chromosome the focal gene is located on and the thick black lines denote Bonferroni-significant interactions. The outer circle demarks the chromosome arms (2L = orange, 2R = yellow, 3L = green, 3R = purple, X = blue). The colored bars inside the inner circle demark the locations of cosmopolitan inversions (orange: In(2L)t; yellow: In(2R)NS; purple: In(3R)K, In(3R)P, In(3R)Mo).

Comment in

References

    1. Oldham S, Bohni R, Stocker H, Brogiolo W, Hafen E. Genetic control of size in Drosophila. Phil. Trans. R. Soc. B: Biological Sciences 2000; 355: 945–952. - PMC - PubMed
    1. Johnston LA, Gallant P. Control of growth and organ size in Drosophila. Bioessays 2002; 24: 54–64. - PubMed
    1. Mirth CK, Riddiford LM. Size assessment and growth control: how adult size is determined in insects. Bioessays 2007; 29: 344–355. - PubMed
    1. Shingleton AW. The regulation of organ size in Drosophila: physiology, plasticity, patterning and physical force. Organogenesis 2010; 6: 76–87. - PMC - PubMed
    1. Oldham S, Hafen E. Insulin/IGF and target of rapamycin signaling: a TOR de force in growth control. Trends Cell Biol.2003; 13: 79–85. - PubMed

Publication types

LinkOut - more resources