. 2016 Feb;19(2):243-52.
doi: 10.1038/nn.4211. Epub 2016 Jan 11.

Neural stem cells sustain natural killer cells that dictate recovery from brain inflammation

Affiliations

Neural stem cells sustain natural killer cells that dictate recovery from brain inflammation

Qiang Liu et al. Nat Neurosci. 2016 Feb.

Abstract

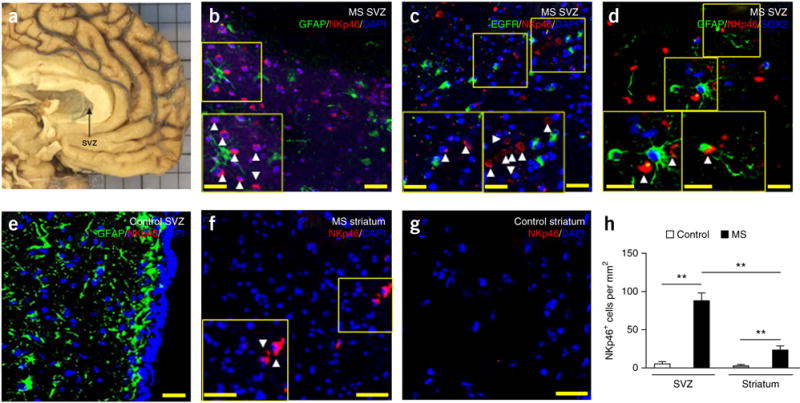
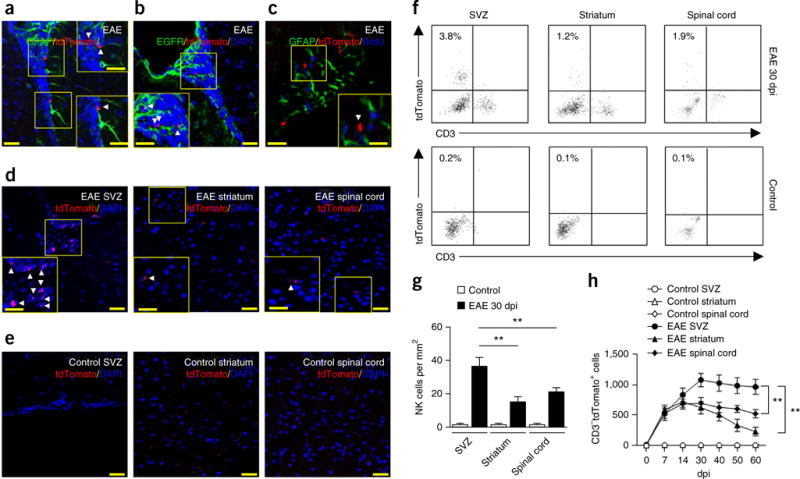
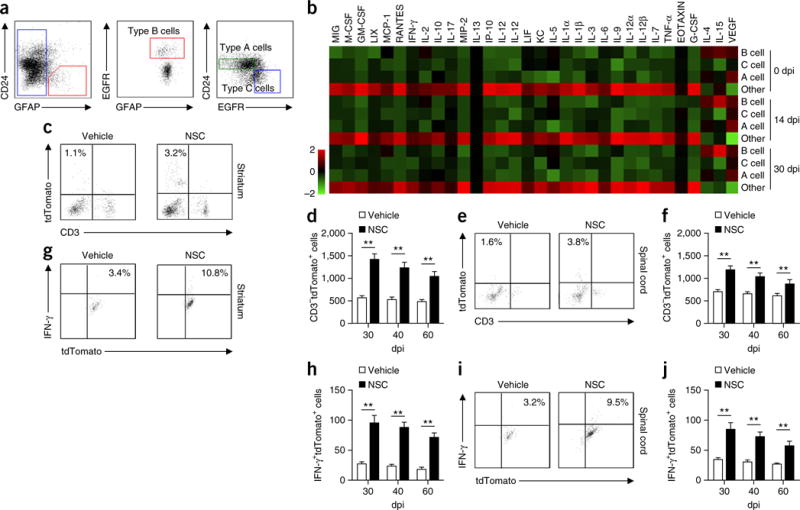
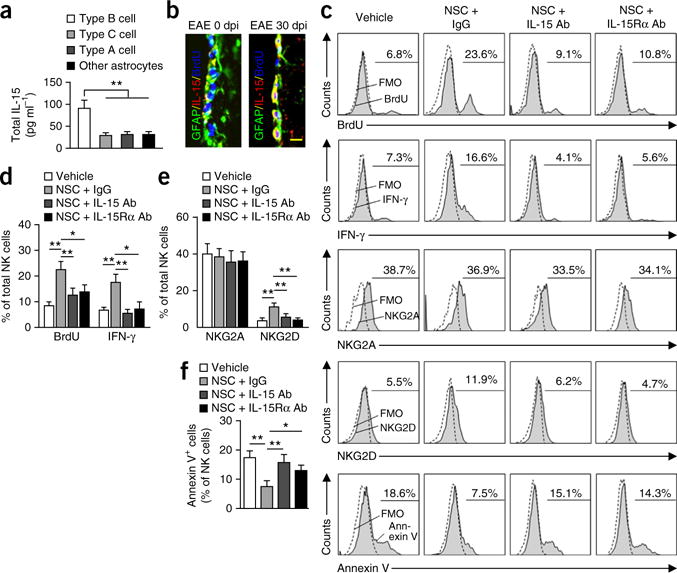
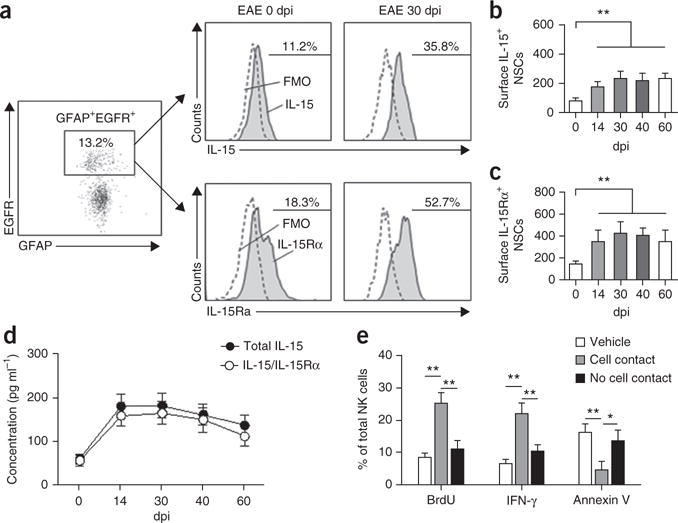
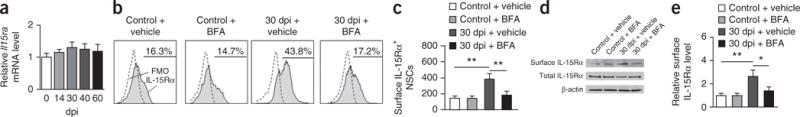
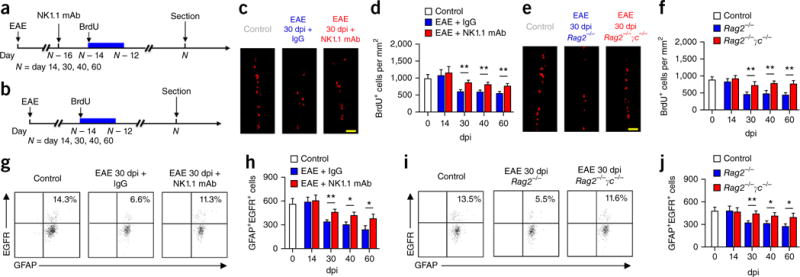
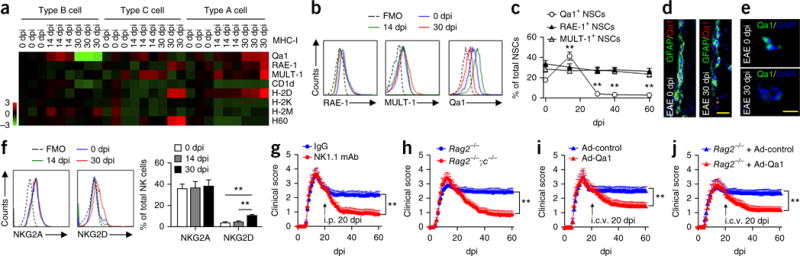
Recovery from organ-specific autoimmune diseases largely relies on the mobilization of endogenous repair mechanisms and local factors that control them. Natural killer (NK) cells are swiftly mobilized to organs targeted by autoimmunity and typically undergo numerical contraction when inflammation wanes. We report the unexpected finding that NK cells are retained in the brain subventricular zone (SVZ) during the chronic phase of multiple sclerosis in humans and its animal model in mice. These NK cells were found preferentially in close proximity to SVZ neural stem cells (NSCs) that produce interleukin-15 and sustain functionally competent NK cells. Moreover, NK cells limited the reparative capacity of NSCs following brain inflammation. These findings reveal that reciprocal interactions between NSCs and NK cells regulate neurorepair.


Conflict of interest statement

COMPETING FINANCIAL INTERESTS

The authors declare no competing financial interests.

Figures

Figure 1
Figure 1
Retention of NK cells in the SVZ of MS patients. (a) Representative brain tissues containing SVZ (arrow) obtained from a patient with MS in clinical remission. (bg) Infiltrated NKp46+ cells (red) in SVZ (bd) and striatum (f) of brain sections from patients with MS, which were largely absent in SVZ (e) and striatum (g) of brain sections from controls without neurological disease. NK cells reside in close proximity to GFAP+, EGFR+ or GFAP+SOX2+ cells in the SVZ (green: GFAP in b,d,e or EGFR in c; red: NKp46 in bg; blue: DAPI in b,c,eg or SOX2 in d). Insets show higher magnification of corresponding boxed regions. Arrowheads, NKp46+ cells. (h) Quantification of NK cell infiltration in brain sections from the SVZ and striatum of patients with MS in clinical remission (n = 6) and in controls without neurological disease (n = 5). P < 0.001, MS SVZ versus control SVZ; P = 0.001, MS striatum versus control striatum; P = 0.003, MS SVZ versus MS striatum. F(1,18) = 11.93, two-way ANOVA. Scale bars: 40 μm (ag), 20 μm (ag, inset). Data are representative of three independent experiments. Error bars represent s.e.m.; **P < 0.01.
Figure 2
Figure 2
Preferential accumulation of NK cells in the SVZ during progression of brain inflammation. (ae) Infiltrating NK1.1-tdTomato+ cells (red) in the SVZ of brain slices from NK1.1-tdTomato Cd1d−/− mouse brains at 30 dpi or healthy MOG-immunized and pertussis toxin–treated controls (control). NK cells resided in close proximity to GFAP+ or EGFR+ cells in the SVZ (ac) at 30 dpi. (d) Infiltrating NK cells were seen in SVZ, but were relatively sparse in striatum or spinal cord sections. (e) NK cells were not noticeable in healthy MOG-immunized and pertussis toxin–treated controls. Green: GFAP in a,c, EGFR in b; red: tdTomato in ae; blue: DAPI in a,b,d,e, BrdU in c. Scale bars: 40 μm (ae), 20 μm (ae, inset). Insets show higher magnification of corresponding boxed regions. Arrowheads, tdTomato+ cells. (f) Representative flow cytometry plots for CD3−NK1.1-tdTomato+ cells in the SVZ, striatum and spinal cord tissues of EAE mice (30 dpi) and healthy MOG-immunized and pertussis toxin–treated controls. All gates were set using FMO controls (Supplementary Fig. 1). (g) Quantification of infiltrating NK cells (tdTomato+) in brain sections from the SVZ of EAE mice (0–60 dpi) or healthy MOG-immunized and pertussis toxin–treated NK1.1-tdTomato Cd1d−/− controls. Average EAE disease grade for mice used for tissue analysis at the time of tissue collection was 2.3 ± 0.5. n = 6 mice per group. P = 0.007, EAE SVZ versus EAE striatum; P = 0.008, EAE SVZ versus EAE spinal cord. F(2,30) = 6.51, two-way ANOVA. (h) Time course of infiltrating NK cells in the SVZ, striatum and spinal cord of EAE mice. Cell infiltrates were isolated from brain homogenates. Kinetics of NK cell infiltration during EAE were quantified by flow cytometry. Absolute numbers of NK cells per SVZ, striatum or spinal cord tissue are shown. Average EAE disease grade for mice used for tissue analysis at the time of tissue collection was 3.3 ± 0.8 at 14 dpi, 2.2 ± 0.6 at 30 dpi, 1.9 ± 0.7 at 40 dpi and 1.7 ± 0.8 at 60 dpi. n = 8 mice per time point. P = 0.002, EAE SVZ versus EAE striatum; P = 0.001, EAE SVZ versus EAE spinal cord. F(30,294) = 7.48, two-way ANOVA. Data are representative of four independent experiments. Error bars represent s.e.m.; **P < 0.01.
Figure 3
Figure 3
NSCs have a distinct cytokine profile during progression of brain inflammation. (a) Representative flow cytometry for sorting SVZ cell types from wild-type adult mice. SVZ astrocytes were separated on the basis of GFAP expression by SVZ cells. From the GFAP+ pool, activated stem cell astrocytes (type B NSCs; GFAP+EGFR+CD24) were isolated from other SVZ astrocytes (GFAP+EGFRCD24) on the basis of EGFR expression. From the GFAP cell fraction, transit-amplifying cells (type C, GFAPEGFR+CD24) and neuroblasts (type A, GFAPEGFRCD24low) were isolated. All gates were set using FMO controls (Supplementary Fig. 3). (b) Heat map shows the cytokine and chemokine profiles of lysates from cultured SVZ type B, C and A cells and other SVZ astrocytes after sorting from SVZ of EAE or naive control mice. Results were based on clustering of immunoassay measurements of the listed proteins. Red shades represent increased expression of proteins relative to other cell types; green shades, decreased expression. Results were from three independent experiments. In a,b, average EAE disease grade for mice used for tissue analysis at the time of tissue collection was 3.5 ± 0.7 at 14 dpi and 2.3 ± 0.5 at 30 dpi. (c) Representative flow cytometry shows that injection of cultured SVZ NSCs or vehicle into striatum of EAE mice increased NK cell counts (7 d after injection) at 30 dpi in striatum. All gates were set using FMO controls (Supplementary Fig. 1). (d) Absolute numbers of NK cells per striatum after injection of cultured SVZ NSCs into striatum of EAE mice at 30, 40, or 60 dpi. n = 8 mice per group at each time point. P < 0.001, 30 dpi; P < 0.001, 40 dpi; P = 0.003, 60 dpi. F(2,42) = 3.06, two-way ANOVA. (e) Representative flow cytometry. Injection of cultured SVZ NSCs or vehicle into spinal cord of EAE mice increased NK cell counts (7 d after injection) at 30 dpi in spinal cord. All gates were set using FMO controls (Supplementary Fig. 1). (f) Absolute numbers of NK cells per spinal cord after injection of cultured SVZ NSCs into spinal cord of EAE mice at 30, 40, or 60 dpi. n = 8 mice per group at each time point. P < 0.001, 30 dpi; P = 0.003, 40 dpi; P = 0.005, 60 dpi. F(2,42) = 2.83, two-way ANOVA. (g) Representative flow cytometry. Injection of cultured SVZ NSCs or vehicle into striatum of EAE mice (30 dpi) increased IFN-γ production by NK cells (7 d after injection) in striatum. All gates were set using FMO controls (Supplementary Fig. 1). (h) Absolute numbers of IFN-γ+ NK cells per striatum after injection of cultured SVZ NSCs into striatum of EAE mice at 30, 40, or 60 dpi. n = 8 mice per group at each time point. P < 0.001, 30 dpi; P < 0.001, 40 dpi; P = 0.001, 60 dpi. F(2,42) = 2.61, two-way ANOVA. (i) Representative flow cytometry. Injection of cultured SVZ NSCs or vehicle into the spinal cord of EAE mice (30 dpi) increased IFN-γ production by NK cells (7 d after injection) in the spinal cord. (j) Absolute numbers of IFN-γ+ NK cells per spinal cord after injection of cultured SVZ NSCs into the spinal cord of EAE mice at 30, 40, or 60 dpi. n = 8 mice per group at each time point. P < 0.001, 30 dpi; P < 0.001, 40 dpi; P = 0.002, 60 dpi. F(2,42) = 3.32, two-way ANOVA. In cj, average EAE disease grade for mice used for tissue analysis at the time of tissue collection was 2.3 ± 0.6 (vehicle) and 2.0 ± 0.5 (NSC) in striatum, 2.3 ± 0.7 (vehicle) and 1.9 ± 0.6 (NSC) in the spinal cord at 30 dpi; 2.2 ± 0.6 (vehicle) and 1.9 ± 0.7 (NSC) in striatum, 2.3 ± 0.6 (vehicle) and 1.6 ± 0.5 (NSC) in the spinal cord at 40 dpi; 1.9 ± 0.6 (vehicle) and 1.5 ± 0.5 (NSC) in striatum, 2.0 ± 0.5 (vehicle) and 1.4 ± 0.6 (NSC) in the spinal cord at 60 dpi. Data are representative of three independent experiments. Error bars represent s.e.m.; **P < 0.01.
Figure 4
Figure 4
NSC-derived IL-15 is necessary to maintain NK cell proliferation, survival and IFN-γ production. (a) IL-15 ELISA from lysates of sorted SVZ NSCs. NSCs are a major source of IL-15 during the late stages of EAE (30 dpi). Average EAE disease grade for mice used for tissue analysis at the time of tissue collection was 2.2 ± 0.5 at 30 dpi. n = 12 per group. P = 0.001, type B cells versus type C; P = 0.003, type B cells versus type A; P = 0.004, type B cells versus other astrocytes. F(3,44) = 6.68, one-way ANOVA. (b) Representative immunostaining for IL-15. GFAP+ cells in SVZ of EAE mice express IL-15 at 30 dpi. Scale bar, 20 μm. Average EAE disease grade for mice used for tissue analysis at the time of tissue collection was 2.3 ± 0.6 at 30 dpi. n = 12 per group. (c) Representative flow cytometry for BrdU+, IFN-γ+, NKG2A+, NKG2D+ or annexin V+ NK cells after culture with vehicle, NSCs + immunoglobulin G (IgG) control, NSCs + IL-15 antibody, or NSCs + IL-15Rα antibody for 72 h. NSCs were sorted from 30-dpi EAE SVZ using flow cytometry. All gates were set using FMO controls. (d,e) Quantitation of NK cells cultured with NSCs for 72 h shows significant increases of BrdU+, IFN-γ+ or NKG2D+ NK cells (gated on CD3−tdTomato+ cells) as compared with vehicle-treated controls. Blockade of IL-15 or IL-15Rα with IL-15 or IL-15Rα antibody attenuates the effects of NSCs on NK cells. n = 12 per group. BrdU: P = 0.003. NSC + IgG versus vehicle; P = 0.007 (NSC + IgG versus NSC + IL-15 antibody; P = 0.02, NSC + IgG versus NSC + IL-15Rα antibody. F(3,44) = 4.62, one-way ANOVA. IFN-γ: P = 0.002, NSC + IgG versus vehicle; P = 0.006, NSC + IgG versus NSC + IL-15 antibody; P = 0.03, NSC + IgG versus NSC + IL-15Rα antibody. F(3,44) = 5.39, one-way ANOVA. NKG2D: P = 0.004, NSC + IgG versus vehicle; P = 0.007, NSC + IgG versus NSC + IL-15 mAb; P = 0.005, NSC + IgG versus NSC + IL-15Rα antibody. F(3,44) = 3.77, one-way ANOVA. (f) Blockade of IL-15 or IL-15Rα with IL-15 or IL-15Rα antibody abolishes the effects of NSCs on NK cell survival. n = 12 per group. P = 0.005, NSC + IgG versus vehicle; P = 0.008, NSC + IgG versus NSC + IL-15 antibody; P = 0.03, NSC + IgG versus NSC + IL-15Rα antibody. F(3,44) = 3.58, one-way ANOVA. In df, average EAE disease grade for mice used for isolation of NSCs at the time of tissue collection (30 dpi) was 2.3 ± 0.7. Results are from four individual experiments. Error bars represent s.e.m.; *P < 0.05, **P < 0.01.
Figure 5
Figure 5
Coordinated upregulation of IL-15 and IL-15Rα in NSCs during progression of brain inflammation. (a) Representative flow cytometry shows increased IL-15+ and IL-15Rα+ NSCs (GFAP+EGFR+) in EAE SVZ at 30 dpi. All gates were set using FMO controls. (b) Changes of surface IL-15 expression by GFAP+EGFR+ cells isolated from EAE SVZ (0–60 dpi). n = 12 per group. P = 0.005, 0 dpi versus 14 dpi; P = 0.002, 0 dpi versus 30 dpi; P = 0.003, 0 dpi versus 40 dpi; P = 0.003, 0 dpi versus 60 dpi. F(4,55) = 15.36, one-way ANOVA. (c) Changes of surface IL-15Rα in GFAP+EGFR+ cells isolated from EAE SVZ at 0–60 dpi. n = 12 per group. P = 0.003, 0 dpi versus 14 dpi; P = 0.001, 0 dpi versus 30 dpi; P = 0.002, 0 dpi versus 40 dpi; P = 0.002, 0 dpi versus 60 dpi. F(4,55) = 16.03, one-way ANOVA. In b,c, average EAE disease grade for mice used for tissue analysis at the time of tissue collection was 3.3 ± 0.9 at 14 dpi, 2.5 ± 0.7 at 30 dpi, 2.2 ± 0.9 at 40 dpi and 1.9 ± 0.6 at 60 dpi. Absolute numbers of cells per SVZ are shown. (d) ELISA of total IL-15 and heteromeric IL-15/IL-15Rα complexes in lysates of cultured flow cytometry–sorted NSCs from EAE SVZ at 0–60 dpi. n = 9 per group at each time point. Average EAE disease grade for mice used for tissue analysis at the time of tissue collection was 3.1 ± 0.6 at 14 dpi, 2.2 ± 0.8 at 30 dpi, 1.8 ± 0.6 at 40 dpi and 1.5 ± 0.7 at 60 dpi. (e) BrdU+, IFN-γ+ or annexin V+ NK cells were counted by flow cytometry in cultures of NK cells with flow cytometry–sorted NSCs from 30-dpi EAE SVZ in the same well (with cell contact) or spatially separated (without cell contact) by a membrane (0.4-μm pores). Average EAE disease grade for mice used for NSC collection was 2.3 ± 0.6 at 30 dpi. All gates were set using FMO controls (Supplementary Fig. 6). n = 9 per group. BrdU: P = 0.001, cell contact versus vehicle; P = 0.003, contact versus no contact. F(2,24) = 5.26, one-way ANOVA. IFN-γ: P = 0.001, cell contact versus vehicle; P = 0.005, contact versus no contact. F(2,24) = 5.37, one-way ANOVA. Annexin V: P = 0.008, contact versus vehicle; P = 0.02, contact versus no contact. F(2,24) = 3.86, one-way ANOVA. Results (be) are from three independent experiments. Error bars represent s.e.m.; *P < 0.05; **P < 0.01.
Figure 6
Figure 6
IL-15Rα upregulation in NSCs during the late stages of brain inflammation. (a) Real-time PCR shows IL-15Rα mRNA levels in NSCs obtained from EAE SVZ (0–60 dpi) as compared with those from naive controls. Data in each group were internally normalized to Gapdh mRNA levels. n = 9 per group. Average EAE disease grade for mice used for tissue analysis at the time of tissue collection was 3.6 ± 0.9 at 14 dpi, 2.6 ± 0.7 at 30 dpi, 2.5 ± 0.9 at 40 dpi and 2.2 ± 0.8 at 60 dpi. (b) Flow cytometry plots of NSCs isolated from SVZ of EAE mice (30 dpi) or naive controls. In vivo treatment with BFA inhibited EAE-induced increases of surface IL-15Rα+ NSCs. All gates were set using FMO controls. (c) Effects of BFA on the number of surface IL-15Rα+ NSCs obtained from EAE or control SVZ treated as indicated. Absolute numbers of cells per SVZ are shown. Average EAE disease grade for mice used for tissue analysis at the time of tissue collection was 2.6 ± 0.6 (vehicle) and 1.8 ± 0.5 (BFA) at 30 dpi. n = 9 per group. P = 0.003, 30 dpi + vehicle versus control + vehicle; P = 0.005, 30 dpi + vehicle versus 30 dpi + BFA. F(3,32) = 3.68, one-way ANOVA. (d) Immunoblotting show the expression of surface or total IL-15Rα protein in NSCs isolated from SVZ of EAE mice (30 dpi) or naive controls. Full-length blots are presented in Supplementary Figure 7. (e) Effects of BFA on surface IL-15Rα protein levels in NSCs from EAE SVZ treated as indicated. Average EAE disease grade for mice used for tissue analysis at the time of tissue collection was 2.5 ± 0.5 (vehicle) and 1.9 ± 0.6 (BFA) at 30 dpi. n = 9 per group. P = 0.005, 30 dpi + vehicle versus control + vehicle; P = 0.02, 30 dpi + vehicle versus 30 dpi + BFA. F(3,32) = 3.36, one-way ANOVA. Results (ae) are representative of three independent experiments. Error bars represent s.e.m.; *P < 0.05; **P < 0.01.
Figure 7
Figure 7
NK cells eliminate NSCs during the late stages of brain inflammation. (a) Protocol for BrdU injection and NK cell depletion in Cd1d−/− mice. (b) Protocol for BrdU injection in Rag2−/− and Rag2−/−γc−/− mice. (c) Representative images show increased numbers of BrdU+ cells in EAE SVZ (30 dpi) of Cd1d−/− mice treated with anti-NK1.1 mAb as compared to mice injected with isotype control IgG. Control, 0 dpi. Scale bar, 40 μm. (d) Significantly increased BrdU+ cells in Cd1d−/− EAE mice treated with anti-NK1.1 mAb during the late stages of EAE (30–60 dpi) as compared to mice injected with IgG, but not during the peak phase (14 dpi). Control, 0 dpi. Results show positive cells per mm2 of SVZ. n = 12 mice per group at each time point. Average EAE disease grade for mice used for tissue analysis at the time of tissue collection was 3.2 ± 0.5 (IgG) and 3.8 ± 0.6 (NK1.1 mAb) at 14 dpi, 2.5 ± 0.6 (IgG) and 1.7 ± 0.5 (NK1.1 mAb) at 30 dpi, 2.3 ± 0.8 (IgG) and 1.4 ± 0.5 (NK1.1 mAb) at 40 dpi and 2.2 ± 0.6 (IgG) and 1.3 ± 0.7 (NK1.1 mAb) at 60 dpi. n = 12 mice per group at each time point. P = 0.005, 30 dpi; P = 0.007, 40 dpi; P = 0.008, 60 dpi. F(3,88) = 3.33, two-way ANOVA. (e) Representative images show more BrdU+ cells in 30-dpi EAE SVZ of Rag2−/−γc−/− mice than Rag2−/− mice. Control, 0 dpi. Scale bar, 40 μm. (f) Significantly increased BrdU+ cells in Rag2−/−γc−/− EAE mice during the late stages of EAE (30–60 dpi) as compared with numbers in Rag2−/− mice, but not during the peak phase (14 dpi). Average EAE disease grade for mice used for tissue analysis at the time of tissue collection was 3.1 ± 0.8 (Rag2−/−) and 3.3 ± 0.7 (Rag2−/−γc−/−) at 14 dpi, 2.6 ± 0.7 (Rag2−/−) and 1.7 ± 0.6 (Rag2−/−γc−/−) at 30 dpi, 2.5 ± 0.7 (Rag2−/−) and 1.6 ± 0.6 (Rag2−/−γc−/−) at 40 dpi and 2.3 ± 0.6 (Rag2−/−) and 1.3 ± 0.5 (Rag2−/−γc−/−) at 60 dpi. Results are presented as positive cells per mm2 of SVZ. n = 12 mice per group at each time point. Control, 0 dpi. P = 0.006, 30 dpi; P = 0.005, 40 dpi; P = 0.003, 60 dpi. F(3,88) = 4.64, two-way ANOVA. (g) Flow cytometry. Counts of SVZ NSCs (GFAP+EGFR+) are increased in wild-type EAE mice 30 dpi treated with anti-NK1.1 mAb. All gates were set using FMO controls (Supplementary Fig. 3). Control, 0 dpi. (h) Counts of SVZ NSCs were increased in wild-type EAE mice 30–60 dpi treated with anti-NK1.1 mAb. Absolute numbers of cells per SVZ are shown. Control, 0 dpi. Average EAE disease grade for mice used for tissue analysis at the time of tissue collection was 3.1 ± 0.6 (IgG) and 3.7 ± 0.8 (NK1.1 mAb) at 14 dpi, 2.3 ± 0.7 (IgG) and 1.6 ± 0.6 (NK1.1 mAb) at 30 dpi, 2.3 ± 0.5 (IgG) and 1.5 ± 0.6 (NK1.1 mAb) at 40 dpi and 2.2 ± 0.5 (IgG) and 1.3 ± 0.5 (NK1.1 mAb) at 60 dpi. n = 12 mice per group at each time point. P = 0.005, 30 dpi; P = 0.02, 40 dpi; P = 0.03, 60 dpi. F(3,88) = 3.39, two-way ANOVA. (i) Flow cytometry shows more NSCs in EAE SVZ (30 dpi) of Rag2−/−γc−/− mice than Rag2−/− mice. All gates were set using FMO controls (Supplementary Fig. 3). (j) There were significantly more NSCs in Rag2−/−γc−/− than in Rag2−/− EAE mice during the late stages of EAE (30–60 dpi), but not during the peak phase (14 dpi). Absolute numbers of cells per SVZ are shown. Average EAE disease grade for mice used for tissue analysis at the time of tissue collection was 3.0 ± 0.6 (Rag2−/−) and 3.2 ± 0.5 (Rag2−/−γc−/−) at 14 dpi, 2.5 ± 0.7 (Rag2−/−) and 1.6 ± 0.5 (Rag2−/−γc−/−) at 30 dpi, 2.3 ± 0.6 (Rag2−/−) and 1.5 ± 0.5 (Rag2−/−γc−/−) at 40 dpi and 2.2 ± 0.7 (Rag2−/−) and 1.3 ± 0.5 (Rag2−/−γc−/−) at 60 dpi. n = 12 mice per group at each time point. P = 0.007, 30 dpi; P = 0.03, 40 dpi; P = 0.02, 60 dpi. F(3,88) = 3.53, two-way ANOVA. Results (cj) are representative of three independent experiments. Error bars represent s.e.m.; *P < 0.05; **P < 0.01.
Figure 8
Figure 8
Altered expression of MHC class I molecules in NSPCs and effects of NK cell removal on EAE. (a) Heat map shows the expression profiles of MHC class I molecules in type B, C and A cells isolated from the SVZ of wild-type EAE mice at 0, 14, and 30 dpi. Expression of MHC class I molecules was measured by flow cytometry. Heat map was generated by normalizing the percentages of SVZ type B, C and A cells that express MHC class I molecules at 0, 14 or 30 dpi to those of naive controls. Red shades represent increased expression of proteins relative to naive controls; green shades, decreased. n = 6 mice per data plot. (b) Representative flow cytometry for Qa1+, RAE-1+ or MULT-1+ NSCs (type B cells) from SVZ of control and EAE mice at 0, 14 and 30 dpi. All gates were set using FMO controls. (c) Quantitation of Qa1+ NSCs shows reduced expression of Qa1, but not RAE-1 or MULT-1, in NSCs from EAE mice at 30, 40 and 60 dpi. n = 6 mice per data plot. P < 0.001, 14 dpi versus 0 dpi; P < 0.001, 30 dpi versus 0 dpi; P < 0.001, 40 dpi versus 0 dpi; P < 0.001, 60 dpi versus 0 dpi. F(4,25) = 33.74, one-way ANOVA. In ac, average EAE disease grade for mice used for tissue analysis at the time of tissue collection was 3.6 ± 1.0 at 14 dpi, 2.7 ± 0.9 at 30 dpi, 2.6 ± 0.7 at 40 dpi and 2.5 ± 0.6 at 60 dpi. (d) Qa1+GFAP+ (yellow) cells in control and EAE SVZ sections 30 dpi. Scale bar, 20 μm. (e) Immunofluorescence for Qa1 in sorted NSCs isolated from control and EAE SVZ 30 dpi. Scale bar, 20 μm. (f) Left, flow cytometry expression of NKG2A and NKG2D on NK cells isolated from SVZ at 14 or 30 dpi and spleen at 0 dpi. All gates were set using FMO controls. Right, expression 14, 30, 40 and 60 dpi. n = 6 mice per group. P = 0.001, 30 dpi versus 0 dpi; P = 0.003, 30 dpi versus 14 dpi. F(2,15) = 8.62, one-way ANOVA. In f, average EAE disease grade for mice used for tissue analysis at the time of tissue collection was 3.2 ± 0.8 at 14 dpi, 2.6 ± 0.8 at 30 dpi, 2.5 ± 0.9 at 40 dpi and 2.3 ± 0.8 at 60 dpi. Results in af are from three individual experiments. (g) Effects of NK cell depletion with anti-NK1.1 mAb on the recovery of EAE in Cd1d−/− mice. n = 15 mice per group. P < 0.001, F(1,1708) = 173.3, two-way ANOVA. (h) Absence of NK cells improves EAE outcome during the late stages of EAE. Rag2−/− and Rag2−/−γc−/− mice were injected with 5 × 10⁶ 2D2 T cells on day 0. Rag2−/−γc−/− mice exhibited faster recovery starting 25 d after transfer of 2D2 T cells. n = 15 mice per group. P < 0.001, F(1,1708) = 192.7, two-way ANOVA. (i) Overexpression of Qa1 by intracerebroventricular (i.c.v.) injection (20 dpi) of an adenovirus (Ad) encoding Qa1 promotes EAE recovery in Cd1d−/− mice. n = 15 mice per group. P < 0.001, F(1,1708) = 95.42, two-way ANOVA. (j) Overexpression of Qa1 by intraventricular injection (20 d after 2D2 T cell transfer) of an adenovirus encoding Qa1 promotes EAE recovery in Rag2−/− mice. n = 15 mice per group. P < 0.001, F(1,1708) = 88.5, two-way ANOVA. Data shown in gj were obtained from three independent experiments. Error bars represent s.e.m.; **P < 0.01.

Comment in

References

    1. Shi FD, Ljunggren HG, La Cava A, Van Kaer L. Organ-specific features of natural killer cells. Nat Rev Immunol. 2011;11:658–671. - PMC - PubMed
    1. Vivier E, et al. Innate or adaptive immunity? The example of natural killer cells. Science. 2011;331:44–49. - PMC - PubMed
    1. Sun JC, Lanier LL. NK cell development, homeostasis and function: parallels with CD8+ T cells. Nat Rev Immunol. 2011;11:645–657. - PMC - PubMed
    1. Yokoyama WM, Kim S, French AR. The dynamic life of natural killer cells. Annu Rev Immunol. 2004;22:405–429. - PubMed
    1. Schleinitz N, Vély F, Harlé JR, Vivier E. Natural killer cells in human autoimmune diseases. Immunology. 2010;131:451–458. - PMC - PubMed

Publication types

MeSH terms