. 2016 Feb;19(2):253-62.
doi: 10.1038/nn.4213. Epub 2016 Jan 11.

KIF1A inhibition immortalizes brain stem cells but blocks BDNF-mediated neuronal migration

Affiliations

KIF1A inhibition immortalizes brain stem cells but blocks BDNF-mediated neuronal migration

Aurelie Carabalona et al. Nat Neurosci. 2016 Feb.

Abstract

Brain neural stem cells (radial glial progenitors, RGPs) undergo a mysterious form of cell cycle-entrained interkinetic nuclear migration (INM) that is driven apically by cytoplasmic dynein and basally by the kinesin KIF1A, which has recently been implicated in human brain developmental disease. To understand the consequences of altered basal INM and the roles of KIF1A in disease, we performed constitutive and conditional RNAi and expressed mutant KIF1A in E16 to P7 rat RGPs and neurons. RGPs inhibited in basal INM still showed normal cell cycle progression, although neurogenic divisions were severely reduced. Postmitotic neuronal migration was independently disrupted at the multipolar stage and accompanied by premature ectopic expression of neuronal differentiation markers. Similar effects were unexpectedly observed throughout the layer of surrounding control cells, mimicked by Bdnf (brain-derived neurotrophic factor) or Dcx RNAi, and rescued by BDNF application. These results identify sequential and independent roles for KIF1A and provide an important new approach for reversing the effects of human disease.


Conflict of interest statement

Conflict of interest statement. None declared

Figures

Figure 1
Figure 1. Kif1a RNAi inhibition of basal nuclear migration in RGP cells has no effect on cell cycle progression
A–E. E16 rat embryonic brains were subjected to in utero electroporation with the pRNAT vector expressing either scrambled or Kif1a shRNAs. Brains were then fixed at E20, stained with cell cycle markers as indicated (A–E). There was no substantial change in the percent of cycling (Ki67), mitotic (PH3), G1 (CyclinD1), S (BrDU after 20 min pulse label) or G2 (Geminin) cells. Scale bars represent 15 μm. F. The percentage of BrDU-positive nuclei after 20-min pulse label located less than 10 μm from or at the ventricular surface (VS) greatly increased in RGP cells expressing Kif1a RNAi (<10 μm: scramble, 17.66 ± 4%, n = 3; Kif1a shRNA, 45.19 ± 4.2%, n = 4, P = 0.0079; at the VS: scramble, 1.58 ± 1.4%, n = 3; Kif1a shRNA, 14.4 ± 1.4%, n = 4, P = 0.0079). **P < 0.01. Error bars represent mean ± s.d.
Figure 2
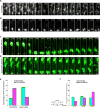
Figure 2. RGP cells exhibit persistent symmetric divisions despite basal migration arrest
Brain slices prepared following in utero electroporation with Kif1a or scrambled shRNAs were cultured at E19 and monitored by live imaging for 40–45 hrs. Time lapse duration shown (in hr:min) was varied as needed to include major INM events. A. Control RGP cell (arrow) undergoes two cycles of INM, each time exhibiting basal and then apical nuclear migration, followed by mitosis at the ventricular surface of the brain slice (1:45; 20:00). B. Nucleus of Kif1a knockdown RGP (arrow) initially undergoes apical INM and divides (2:00). The one nucleus which stays in the image focal plane remains at the ventricular surface for ~18 hr before dividing again (20:15; arrows). C and D. RGP cells co-expressing Kif1a shRNA and DsRed-centrin II were able to divide either symmetrically (C) to form two RGP cells or asymmetrically (D) to form a RGP cell and a neuron/neuronal progenitor. Daughter RGP cells were identified by presence of an apical process (arrows) and an apically-sequestered centrosome (arrowheads) at the ventricular surface of the brain slice. Newly-born neurons were identified by movement towards the SVZ (arrows), absence of an apical process, and centrosomal movement away from the ventricular surface (arrowheads). E. Quantification of the symmetric vs asymmetric RGP divisions based on the average of every recorded cell, pooled from multiple examples of live imaging (see panels C and D) revealed that Kif1a shRNA causes a severe shift toward symmetric divisions (symmetric: scramble 28%, Kif1a shRNA 68%; asymmetric: scramble 72%, Kif1a shRNA 32%; n=25 cells per condition). F. Quantification of cleavage plane orientation (based from the average of every recorded cell, pooled from multiple live imaging events) indicates a similarly marked shift to a horizontal cleavage plane orientation (0–30°: scramble 33.33%, Kif1a shRNA 16.66%; 30–60°: scramble 36.66%, Kif1a shRNA 30%; 60–90°: scramble 30%, Kif1a shRNA 53.33%; n=30 cells per condition). Scale bars 20μm (A–B), 15μm (C–D).
Figure 3
Figure 3. Cell-autonomous and non-autonomous effects in neuronal morphogenesis and gene expression
Histological analysis and live imaging of rat brains in utero electroporated with Kif1a and scrambled shRNA vectors at E16. A. Coronal sections of E20 rat brains showing an accumulation of multipolar neurons in the SVZ/lower IZ in Kif1a knockdown compared to control. B. Quantification of the number of multipolar vs bipolar E20 neurons in the cortex in Kif1a knockdown compared to control (multipolar: scramble 34.75±6.2%, Kif1a shRNA 75.15±9.5%, p< 0,0001; bipolar: scramble 62.25±6.2%, Kif1a shRNA 24.85± 9.5%, p< 0,0001; n=10 scramble and 9 Kif1a shRNA).C and D. E20 brain slices were cultured for ~40 hrs during which we monitored, within the SVZ-lower IZ, control multipolar cell converting to a bipolar morphology by 15 hours (C), and absence of the transition in Kif1a knockdown cells (D). E. Quantification of live analysis. During ~40 hrs of imaging, ~ 30% of all recorded control multipolar cells (pooled from multiple live imaging events), located in the IZ, converted to a polar migratory morphology, while none of the Kif1A knockdown cell showed this behavior (Scramble: n= 51 cells, 70,6% multipolar and 29,4% bipolar; and Kif1a shRNA= 16 cells, 100% multipolar). F and G. Low and high mag coronal sections of Kif1a vs. control rat brains immunostained at E20 for the neuronal marker Tbr1. As expected, Tbr1 staining is seen in bipolar neurons (arrows) within the upper IZ and CP (F). However, Kif1a RNAi resulted in ectopic Tbr1 staining in transfected as well as surrounding non-transfected cells in the SVZ/lower IZ. ***P<0.001; mean ± SD. Scale bars 100μm (A and low mag in F and G), 15μm (C, D and high mag in F and G).
Figure 4
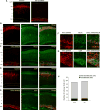
Figure 4. Cell autonomous and non-autonomous effects on neuronal markers at P7
E16 rat brains were electroporated in utero using pCAG-RFP alone as a control or with Kif1a shRNA subcloned into the U6 vector to ensure that expression would persist in postnatal pups. Histological analysis of brains was examined at postnatal day (P)7. A. Representative neocortical sections showing the laminar position of transfected cells. In control brain, RFP-positive cells are mainly found in layers II/III/IV of the neocortex. In contrast, in Kif1a shRNA brains, RFP-positive cells remained in the white matter (WM) located in a heterotopic band near the ventricular surface. B–E. Immunostaining for the neuronal marker NeuN (B) and the upper cortical layer marker CDP (D) was observed near the pial surface in control transfected brain, but near the ventricular surface in Kif1a knockdown brain (C and E). F and G. High-magnification views of the boxed sections in merged images for control vs. Kif1a knockdown brains show both transfected and non-transfected cells positive for NeuN (F) and CDP (G).H. Ratio of transfected to non-transfected NeuN+ and CDP+ neurons, in a surface area of 0.04 mm2 (transfected cells: NeuN 31.25, CDP 32.28; non-transfected cells: NeuN 244.25, CDP 259.57). Scale bars 100μm (A–E), 25μm (F and G).
Figure 5
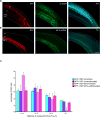
Figure 5. Sequential electroporation test for non-cell autonomous effects of Kif1a RNAi
A. E16 rat brains were electroporated with p CAG-RFP and30 min later with GFP-scrambled plasmid. Brain sections were prepared 4 days after electroporation and showed similar distributions of RFP+ and GFP+ cells through the cortex, and normal Tbr1 staining. B. In contrast, sequential electroporation of pCAG-RFP followed by GFP-Kif1a shRNA resulted in an accumulation of both RFP+ and GFP+ neurons in the SVZ and lower IZ. Immunostaining against Tbr1 revealed that neurons in the SVZ/lower IZ expressing only RFP were ectopically positive for Tbr1, similarly to the neighboring Kif1a-depleted cells. C. Quantification of the nuclear distance from the ventricular surface (VS) for RGP cells after electroporation of scrambled or Kif1a RNAi alone or RFP+ RGP cells after sequential electroporation of GFP-scrambled (scramble-sqtial) or Kif1a RNAi (Kif1a shRNA-sqtial). Nuclear distribution of RFP+ RGP cells was not significantly altered after sequential electroporation of GFP-Kif1a RNAi (0–10: scramble 30.14±2.4%, scramble-sqtial 29.96±8.7%, Kif1a shRNA 51.61±2%, Kif1a shRNA-sqtial 30.84±4.4%; 10–20: scramble 29.97±1%, scramble-sqtial 34.50±6%, Kif1a shRNA 27.09 ±6%, Kif1a shRNA-sqtial 32.94±4.5%; 20–30: scramble 23.52±1.4%, scramble-sqtial 20.86±6.3%, Kif1a shRNA 18.51±4.7%, Kif1a shRNA-sqtial 23.13±6.3%;>30: scramble 15.87±1.2%, scramble-sqtial 14.67±2.7%, Kif1a shRNA 1.7±1.2%, Kif1a shRNA-sqtial 13.07±2.2%; n=6 for each), suggesting Ki1a depletion does not have a non-cell autonomous effect on INM in neighboring RGP cells. 0–10: p=0,0022 for scramble vs Kif1a shRNA, and p= 0,9004 for scramble-sqtial vs Kif1a shRNA-sqtial; 10–20: p=0,0931 for scramble vs Kif1a shRNA, and p=0,6688 for scramble-sqtial vs Kif1a shRNA-sqtial; 20–30: p=0,0260 for scramble vs Kif1a shRNA, and p=0,7316 for scramble-sqtial vs Kif1a shRNA-sqtial; >30: p=0,0022 for scramble vs Kif1a shRNA, and p= 0,2229 for scramble-sqtial vs Kif1a shRNA-sqtial); mean ± SD. *P<0.05; **P < 0.01. Scale bars represent 100 μm (A,B).
Figure 6
Figure 6. Conditional, cell-stage-specific RNAi supports distinct sequential roles for Kif1a during brain development
A. Coronal section of E20 rat brains co-electroporated at E16 with a floxed mir30-based Kif1a shRNA and a Brain Lipid Binding Protein (BLBP)-cre vector for conditional expression in RGP cells. RGP-specific depletion of Kif1a leads to an accumulation of RGP nuclei close to the ventricular surface (boxed region, high mag), but had no effect on the morphology or Tbr1 expression in neuronal progeny cells expressing residual GFP, or on Tbr1 expression in nearby neuronal precursors. B. Quantification of the distance of RGP nuclei from the ventricular surface (VS) at E20 (0–10: scramble 30.14±2.4%, Kif1a shRNA 51.61±2%, BLBP-cre+EV 34.62±2%, BLBP-cre+Kif1a shRNA 48.85 ±4%; 10–20: scramble 29.97±1%, Kif1a shRNA 27.09±6%, BLBP-cre+EV 33.8±1.6%, BLBP-cre+Kif1a shRNA 34.35±8%; 20–30: scramble 23.52±1.4%, Kif1a shRNA 18.51± 4.7%, BLBP-cre+EV 19.5±0.8%, BLBP-cre+Kif1a shRNA 13.28±6.5%; >30: scramble 15.87±1.2%, Kif1a shRNA 1.7±1.2, BLBP-cre+EV 12.06±0.8%, BLBP-cre+Kif1a shRNA 4.03±3.1%; n=6 scramble, Kif1a shRNA, BLBP-cre GFP and 4 BLBP-cre GFP+Kif1a shRNA) showing a significant accumulation of Kif1a knockdown cells at the VS. C. Coronal section of E20 rat brains co-electroporated with a floxed mir30-based Kif1a shRNA and a NeuroD-cre vector for conditional expression in neurons. Neuron-specific depletion of Kif1a leads to an accumulation of the majority of transfected neurons at the multipolar stage within the SVZ/lower IZ. The non-cell autonomous effect of Kif1a RNAi on surrounding cells was similarly preserved as determined by anti-Tbr1 staining. D. Quantification of RFP-positive cell distribution in the cortex at E20 (VZ/SVZ: NeuroD-cre+EV 19.12±3.7%, NeuroD-cre+Kif1a shRNA 67.15±2.6%; IZ: NeuroD-cre+EV 37.66 ±6.1%, NeuroD-cre+Kif1a shRNA 31.21±1.3%;CP: NeuroD-cre+EV 43.21±7.4%, NeuroD-cre+Kif1a shRNA 1.63±2%; n=6 NeuroD-cre+EVand 5 NeuroD-cre+Kif1a shRNA) showing a significant increase of Kif1a knockdown cells in SVZ/lower IZ. *P<0.05,**P<0.01 (0–10: p=0,0022 for scramble vs Kif1a shRNA, and p=0,0095 for BLBP-cre GFP vs BLBP-cre GFP+Kif1a shRNA; 10–20: p=0,0931 for scramble vs Kif1a shRNA, and p>0,9999 for BLBP-cre GFP vs BLBP-cre GFP+Kif1a shRNA; 20–30: p=0,2333 for scramble vs Kif1a shRNA, and p=0,0260 for BLBP-cre GFP vs BLBP-cre GFP+Kif1a shRNA; >30: p=0,0022 for scramble vs Kif1a shRNA, and p=0,0190 for BLBP-cre GFP vs BLBP-cre GFP+Kif1a shRNA; VZ/SVZ: p=0,0043: IZ: p=0,0823; CP: p=0,0043); mean ±SD. Scale bars 100μm (A and C), 15μm (high mag in A).
Figure 7
Figure 7. Effect of KIF1A R18W human mutation on INM and neuronal migration
A and B. Coronal sections of E20 rat brains electroporated at E16 with cDNAs encoding the human wild-type, KIF1A-FL (A), or the human mutant form of KIF1A, KIF1A-R18W (B). Expression of KIF1A-R18W results in a defect in INM as evidenced by the close proximity of nuclei to the ventricular surface (see high mag panel), in neuronal migration, as indicated by the accumulation of neurons in the SVZ/lower IZ, and a non-cell autonomous effect on neighboring cells as revealed by ectopic Tbr1 staining in these regions (high mag). C. Quantification of cell distribution in the cortex at E20 (VZ/SVZ: KIF1A-FL 26.18±3.3%, KIF1A-R18W 65.48±7.4%; IZ: KIF1A-FL 36.91±2.6%, KIF1A-R18W 31.32±9%;CP:KIF1A-FL 36.89±0.7%, KIF1A-R18W 3.1±3.1%; n=5 KIF1A-FL and 6 KIF1A-R18W) showing a significant increase of mutant cells in SVZ/lower IZ. D. Quantification of the distance of RGP nuclei from the ventricular surface (VS) at E20 (0–10: KIF1A-FL 25.76±5.5%, KIF1A-R18W 55.2±5.4%; 10–20: KIF1A-FL 33.37±2.2%, KIF1A-R18W 28.75±3.3%; 20–30: KIF1A-FL 21.47±2%, KIF1A-R18W 11.74±7.6%; >30: KIF1A-FL 19.17±4.4%, KIF1A-R18W 4.3±1.3%; n=5 KIF1A-FL and 6 KIF1A-R18W), revealing accumulation at this site for the mutant, but not wild-type, KIF1A. *P<0.05, **P<0.01 (VZ/SVZ: p=0,0043: IZ: p=0,329; CP: p=0,0043; 0–10: p=0,0043; 10–20: p=0,0303; 20–30: p=0,0087; >30: p=0,0043); mean ± SD. Scale bars 100μm (A and B), 15μm (high mag in A and B).
Figure 8
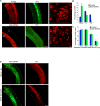
Figure 8. Role of BDNF in KIF1A pathway
A. E20 coronal sections of rat brains electroporated at E16 with Bdnf shRNA. BDNF knockdown resulted in a potent accumulation of neurons in the SVZ and lower IZ (high magnification), as well as ectopic expression of Tbr1 throughout this region, comparable to the effects of Kif1a RNAi. B. Quantification of data in A (VZ/SVZ: control, 22.54 ± 2.3%; Bdnf shRNA, 68.12 ± 4.7%; IZ: control, 45.91 ± 4.1%; Bdnf shRNA, 30.13 ± 5%; CP: control, 31.54 ± 3.2%; Bdnf shRNA, 1.7 ± 2.5%; n = 6). C Quantification of the distance of RGP nuclei from the VS at E20 (0–10: control, 33.17 ± 3%; Bdnf shRNA, 34.6 ± 1.1%; 10–20: control, 34.04 ± 1.5%; Bdnf shRNA, 33.5 ± 2.1%; 20–30: control, 23.8 ± 1.4%; Bdnf shRNA, 24.12 ± 2.4%; >30: control, 9 ± 4%; Bdnf shRNA 7.75 ± 3.2%; n = 4 control and 7 Bdnf shRNA), revealing no INM defect after Bdnf depletion. D. E19 coronal rat brain slices cultured for 24 h in the presence of recombinant BDNF (50 ng ml–1) in phosphate-buffered saline (PBS), or control vehicle alone, and then fixed and examined by microscopy. BDNF treatment rescued the non–cell autonomous effect caused by Kif1a shRNA, as evidenced by restoration of migration in non-transfected cells and normal Tbr1 distribution. **P < 0.01 (VZ/SVZ, IZ and CP: P = 0.0022; 0–10: P = 0.3818; 10–20: P = 0.7818; 20–30: P > 0.9999; >30: P = 0.4424). Error bars represent mean ± s.d. Scale bars represent 100 μm (A,D) and 15 μm (high magnification in A).

References

    1. Kosodo Y. Interkinetic nuclear migration: beyond a hallmark of neurogenesis. Cell Mol Life Sci. 2012;69:2727–2738. - PMC - PubMed
    1. Taverna E, Huttner WB. Neural progenitor nuclei IN motion. Neuron. 2010;67:906–914. - PubMed
    1. Spear PC, Erickson CA. Interkinetic nuclear migration: A mysterious process in search of a function. Develop Growth Differ. 2012;54:306–316. - PMC - PubMed
    1. Kriegstein A, Alvarez-Buylla A. The glial nature of embryonic and adult neural stem cells. Annu Rev Neurosci. 2009;32:149–184. - PMC - PubMed
    1. Noctor SC, Flint AC, Weissman TA, Dammerman RS, Kriegstein AR. Neurons derived from radial glial cells establish radial units in neocortex. Nature. 2001;409:714–720. - PubMed

Publication types

MeSH terms