. 2016 Feb;22(2):163-74.
doi: 10.1038/nm.4021. Epub 2016 Jan 11.

Mitochondrial iron chelation ameliorates cigarette smoke-induced bronchitis and emphysema in mice

Affiliations

Mitochondrial iron chelation ameliorates cigarette smoke-induced bronchitis and emphysema in mice

Suzanne M Cloonan et al. Nat Med. 2016 Feb.

Abstract

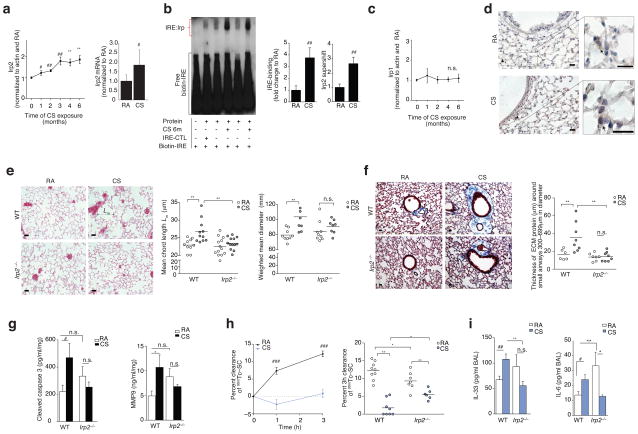
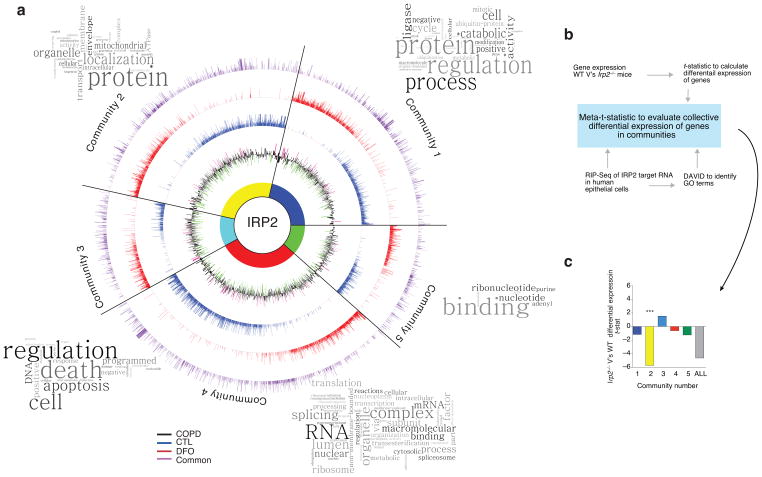
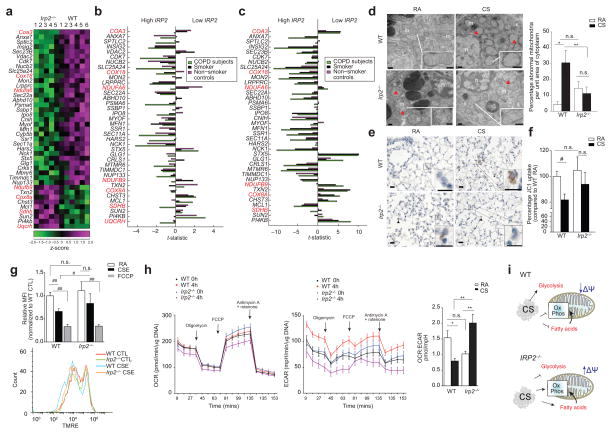
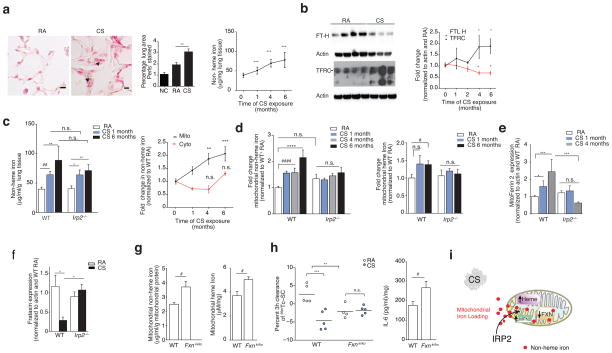
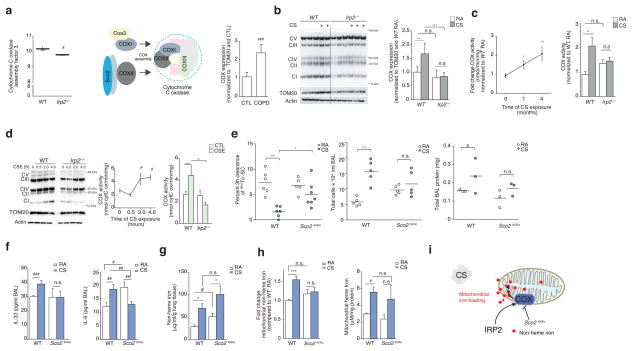
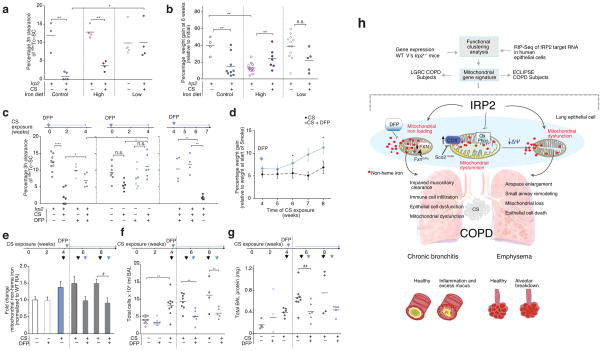
Chronic obstructive pulmonary disease (COPD) is linked to both cigarette smoking and genetic determinants. We have previously identified iron-responsive element-binding protein 2 (IRP2) as an important COPD susceptibility gene and have shown that IRP2 protein is increased in the lungs of individuals with COPD. Here we demonstrate that mice deficient in Irp2 were protected from cigarette smoke (CS)-induced experimental COPD. By integrating RNA immunoprecipitation followed by sequencing (RIP-seq), RNA sequencing (RNA-seq), and gene expression and functional enrichment clustering analysis, we identified Irp2 as a regulator of mitochondrial function in the lungs of mice. Irp2 increased mitochondrial iron loading and levels of cytochrome c oxidase (COX), which led to mitochondrial dysfunction and subsequent experimental COPD. Frataxin-deficient mice, which had higher mitochondrial iron loading, showed impaired airway mucociliary clearance (MCC) and higher pulmonary inflammation at baseline, whereas mice deficient in the synthesis of cytochrome c oxidase, which have reduced COX, were protected from CS-induced pulmonary inflammation and impairment of MCC. Mice treated with a mitochondrial iron chelator or mice fed a low-iron diet were protected from CS-induced COPD. Mitochondrial iron chelation also alleviated CS-induced impairment of MCC, CS-induced pulmonary inflammation and CS-associated lung injury in mice with established COPD, suggesting a critical functional role and potential therapeutic intervention for the mitochondrial-iron axis in COPD.


Conflict of interest statement

COMPETING FINANCIAL INTERETS

In the past three years, Edwin K. Silverman received honoraria and consulting fees from Merck and grant support and consulting fees from GlaxoSmithKline.

Figures

Figure 1
Figure 1
Irp2 is pathogenic in experimental COPD. (a) Irp2 protein (left), mRNA (right) (n = 8 per group), (b) representative (n = 4) EMSA (left) with quantification of total-Irp (n = 5 per group) and specific-Irp2 activity (n = 3 per group), (c) Irp1 protein expression (n = 3 per group) and (d) representative Irp2 immunostaining (arrows indicate Irp2) in WT mouse lungs exposed to room air (RA) or CS (1–6 months). (e) Representative Hematoxylin-Eosin stained lung-sections (left), (n= 3 mice per group) mean chord length (middle), weighted mean diameters (right) and (f) representative trichrome stained lung-sections (left) and ECM protein thickness around small airways (right) in WT and Irp2−/− mice exposed to RA or CS (6 months), staining; n = 2 technical replicates. (g) Cleaved caspase 3 (left) (ELISA, n = 7 per group) and MMP-9 (right) (ELISA, WTRA n = 5; WTCS n = 3; Irp2−/− RA, CS n = 6) levels in whole lung of WT and Irp2−/− mice exposed to RA or CS (6 months), n = 2 technical replicates. (h) 99mTc-SC clearance over 1–3 hours (left) in WT mouse lungs exposed to RA (n = 9) or CS (n = 10) (1 month). 3 hour 99mTc-SC clearance (right), (i) BALF IL-33 (left, ELISA; WTRA n = 3; WTCS n = 5; Irp2−/− RA n = 5; Irp2−/−C n = 6) and BALF IL-6 protein concentrations (right, ELISA, n = 3 per group) in WT and Irp2−/− mice exposed to RA or CS (1 month). (df) Scale bars, 50 μm. All data are mean ± s.e.m. *P < 0.05, **P < 0.01, ***P < 0.005 by one-way ANOVA with Bonferroni correction. #P < 0.05, ##P < 0.01, ###P < 0.005 by student’s unpaired t-test. n.s., not significant.
Figure 2
Figure 2
Novel targets of IRP2 in the lung. (a) Circos plot of communities of genes and GO terms to demonstrate gene transcripts and pathways enriched and/or altered in the RIP-Seq data set. CTL-specific (blue), DFO-specific (red) and common (purple) peak data sets are represented by individual rings, with the height of bars corresponding to the peak score (n = 2 biological replicates). Gene expression data (mRNA) from the LGRC (n = 121 COPD subjects, n = 20 non-smokers and n = 18 smokers) represented on inner black ring. The height of these bars corresponds to the log2 fold-change (FC) in gene expression levels between subjects with COPD and controls. Green denotes lower expression in COPD and magenta denotes higher expression in COPD. Word Clouds representing GO terms in each community with the size of each word reflecting its frequency among the names of the pathways in the community. Community 1 shows enrichment for the cell cycle, metabolism of RNA, the proteasome and immune system; community 2 for metabolism, mitochondria and membrane trafficking; community 3 for DNA repair, apoptosis, the cell cycle and signal transduction; community 4 for metabolism of proteins, transcription and translation; community 5 for nucleotide/purine metabolism pathways. (b) Functional enrichment clustering analysis workflow to evaluate collective differential expression of genes in “communities” of RIP-Seq and in Irp2−/− versus WT gene expression data. (c) Results of functional enrichment clustering analysis. ***P = 1.08 x10⁻⁸ by a two-tailed unpaired t-test.
Figure 3
Figure 3
Irp2−/− mice resist CS-induced mitochondrial dysfunction. (a) Community 2 genes that annotated to ‘mitochondria’ GO categories. Red text indicates mitochondrial OXPHOS genes. (bc) Differential-expression of genes from (a) in the human COPD cohorts (b) LGRC (n = 121 COPD, n = 18 smokers and n = 20 non-smokers) and (c) ECLIPSE (n = 136 COPD, n = 84 smokers, n = 6 non-smokers) related to low or high IRP2 expression. (d) Representative TEM images (n=20 images per mouse) (left) and quantification (right) of WT or Irp2−/− mouse airways exposed to RA or CS (4 months)(15 EM fields, n = 1 per group). Scale bar: 500 nm. Arrows indicate ‘abnormal’ mitochondria. n; nuclei; m; mitochondria. (e) Representative cytochrome c immunostaining (n=3 mice per group) (arrows indicate staining, scale bar, 50 μm) and (f) percentage JC1 uptake (mitochondrial-enriched fractions, n = 3 technical replicates) of WT or Irp2−/− mouse lungs exposed to RA or CS (4 (e) or 6 months (f)). (g) Representative TMRE staining (n=3 experiments) (bottom) (n = 2 technical replicates) with fold change mean fluorescent intensity (top) of TMRE, (h) OCR (left) and ECAR (right) normalized to Hoechst (n = 12 technical replicates) of WT and Irp2−/− primary lung epithelial cells treated with 20% CSE (4 hours) or FCCP (30 mins). (i) Schematic of the role of IRP2 in mitochondrial responses to CS. All data are mean ± s.e.m.: #P < 0.05. ##P < 0.01 by student’s unpaired t-test. *P < 0.05, **P < 0.01 by one-way ANOVA with Bonferroni correction.
Figure 4
Figure 4
IRP2-associated mitochondrial iron loading and CS. (a) Representative Perls’ stained lung sections (n=3 mice per group) (left) (n = 2 technical replicates) with quantification (middle) (n = 10 images per mouse, n = 3 per group) and non-heme iron levels (right, n = 4 mice per group, n = 4 technical replicates) in WT mice exposed to RA or CS (1–6 months). Scale bars, 50 μm. Arrows indicate staining. n.c.; negative control. (b) Representative immunoblot (n=3 experiments) (left) with quantification (right) of transferrin and ferritin expression (n = 5 per group, n = 2 technical replicates), (c) total non-heme iron (left, n = 5 mice per group, n = 4 technical replicates) and fold change mitochondrial (RA n = 11; CS 1 month n = 6, 4 months n = 8, 6 months n = 9) and cytosolic non-heme (RA n = 6; CS 1 month n = 11, 4 months n = 3, 6 months n = 5) iron (right) in WT mouse lungs exposed to RA or CS, n = 2 technical replicates. (d) Fold change non-heme iron (left, WT and Irp2−/−; RA n = 13, CS 1 and 6 months n =5, CS 4 months n =3) and heme-iron (right, WT and Irp2−/−; RA n = 10, CS 1–6 months n =5) in mitochondrial fractions from WT mouse lungs exposed to RA or CS, n = 2 technical replicates. (e) Mitoferrin 2 (WT and Irp2−/−; RA n = 8; CS 1 month n = 3, 4 months n = 6), (f) frataxin expression (WT RA n = 5; CS n = 3; Irp2−/− RA n = 6; CS n = 6) in whole lung of mice exposed to RA or CS. (g) Mitochondrial non-heme (left, n = 4 per group), mitochondrial heme iron (right, n = 4 per group), (h) 3 hour 99mTc-SC clearance (left) and IL-6 protein concentrations (right, n = 4 per group) in the lungs of WT and Fxnki/ko mice exposed to RA or CS (1 month). (i) Schematic of mitochondrial iron loading regulated by Irp2. All data are mean ± s.e.m. *P < 0.05. **P < 0.01, ***P < 0.005 by one-way ANOVA followed by Bonferroni correction. #P < 0.05 by student’s unpaired t-test.
Figure 5
Figure 5
COX is pathogenic in experimental COPD. (a) Coa3 expression (left) in WT (n = 6) and Irp2−/− (n = 5) mouse lungs, schematic of COX assembly (middle) and COX expression by immunoblot analysis (right) in lung tissue from individuals with COPD (n = 5) and controls (n = 5), n = 2 technical replicates. (b) Representative immunoblot (n=3 experiments) expression (left) of OXPHOS complexes I-V in mitochondrial-enriched fractions from WT and Irp2−/− mouse lungs exposed to RA or CS (4 months), with quantification of Complex IV expression (right), n = 3 technical replicates. (c) Time course of COX activity (left) and total COX activity (4 months CS) in mitochondrial fractions of WT or Irp2−/− mice exposed to RA or CS (n = 3 per group, n = 3 technical replicates). (d) Representative immunoblot (n=3 experiments) (left) as in (b), time course of COX activity (middle) and COX activity at 4 hours (right) in primary lung epithelial cells from WT or Irp2−/− mice exposed to 20% CSE, n = 2 per group, n = 2 technical replicates. (e) 3 hour 99mTc-SC clearance (left), total BALF leukocytes (middle), total protein levels (right), (f) BALF IL-33 (left, ELISA; WT RA n = 4; CS n = 5; Sco2ki/ko RA n = 5, CS n = 4), BALF IL-6 (right, ELISA; WT RA n = 4; CS n = 5; Sco2ki/ko RA n = 5, CS n = 4),) protein concentration, (g) total lung non-heme iron (n = 4 per group), (h) mitochondrial non-heme iron (left, n = 3 per group) and mitochondrial-heme iron (right, n =3 per group) levels in WT and Sco2ki/ko mice exposed to RA or CS (1 month), (f, g) n = 3 technical replicates. (i) Schematic of the role of COX Irp2-associated mitochondrial iron loading. All data are mean ± s.e.m. *P < 0.05. **P < 0.01, ***P < 0.005 by one-way ANOVA followed by Bonferroni correction. #P < 0.05, ##P < 0.01, ###P < 0.005 by unpaired student’s t-test.
Figure 6
Figure 6
Targeting mitochondrial iron in experimental COPD. (a) 3 hour 99mTc-SC clearance and (b) percentage weight gain of WT mice exposed to RA or CS (1 month) on a control (300 ppm iron), low iron (6 ppm iron) or high iron (2% carbonyl iron) diet. (c) 3 hour 99mTc-SC clearance in WT and Irp2−/− mice exposed to RA or CS (1 month) and treated with DFP as a prophylactic dosing strategy or as a therapeutic dosing strategy; blue arrows indicate point of DFP addition. (d) Percentage weight gain (relative to initial weight at the start of smoke exposure) (4 weeks CS n = 17; 5 weeks CS n = 12; 6 weeks CS n = 12; 7 weeks CS n = 4; 8 weeks CS n = 4; 4 weeks + DFP n = 11; 5 weeks + DFP n = 11; 6 weeks + DFP n = 11; 7 weeks + DFP n = 5; 8 weeks + DFP n = 4), (e) fold change in lung mitochondrial non-heme iron (control n = 8;DFP control n = 8; 1 month CS n = 10; 6 weeks CS n = 4; 6 weeks +DFP n = 4; 8 weeks CS n = 4; 8 weeks CS +DFP n = 4; n = 2 technical replicates), (f) total BAL leukocytes and (g) total BALF protein in WT mice treated with DFP using a therapeutic dosing strategy as in (c), but continued for 2 or 4 weeks of CS exposures. Black arrows indicate time of CS exposure and blue arrows indicate time of DFP addition. (h) Schematic of the major findings of this study. All data are mean ± s.e.m. *P < 0.05. **P < 0.01, ***P < 0.005 by one-way ANOVA followed by Bonferroni correction.

Comment in

References

    1. Barnes PJ, Shapiro SD, Pauwels RA. Chronic obstructive pulmonary disease: molecular and cellular mechanisms. Eur Respir J. 2003;22:672–688. - PubMed
    1. Hogg JC, et al. The nature of small-airway obstruction in chronic obstructive pulmonary disease. N Engl J Med. 2004;350:2645–2653. - PubMed
    1. Siedlinski M, et al. Dissecting direct and indirect genetic effects on chronic obstructive pulmonary disease (COPD) susceptibility. Hum Genet. 2013;132:431–441. - PMC - PubMed
    1. DeMeo DL, et al. Integration of genomic and genetic approaches implicates IREB2 as a COPD susceptibility gene. Am J Hum Genet. 2009;85:493–502. - PMC - PubMed
    1. Qiu W, et al. Genetics of sputum gene expression in chronic obstructive pulmonary disease. PLoS One. 2011;6(9):e24395. - PMC - PubMed

Publication types

MeSH terms

Grants and funding