. 2016 Feb;126(2):611-26.
doi: 10.1172/JCI80997. Epub 2016 Jan 11.

Rho-A prenylation and signaling link epithelial homeostasis to intestinal inflammation

Rho-A prenylation and signaling link epithelial homeostasis to intestinal inflammation

Rocío López-Posadas et al. J Clin Invest. 2016 Feb.

Abstract

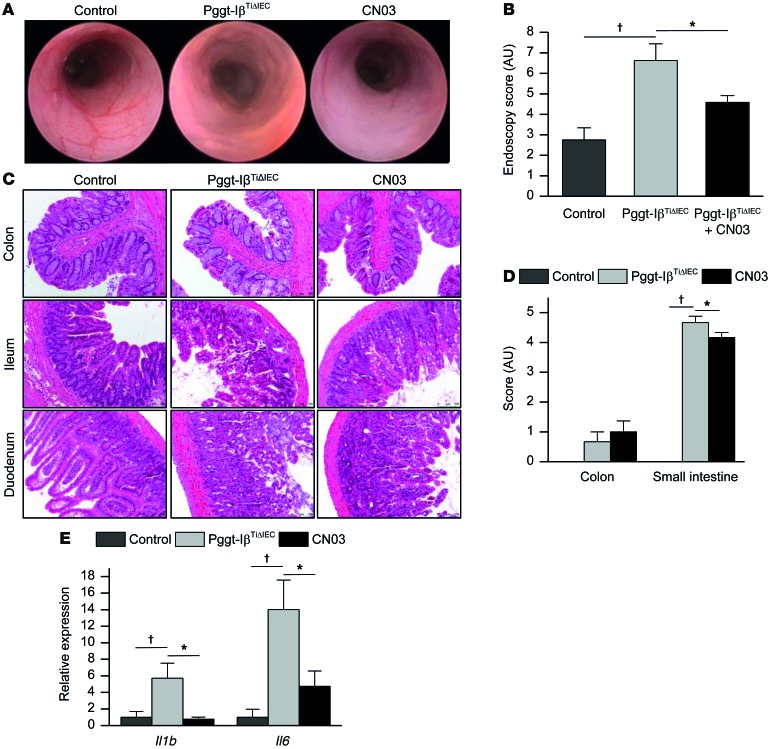
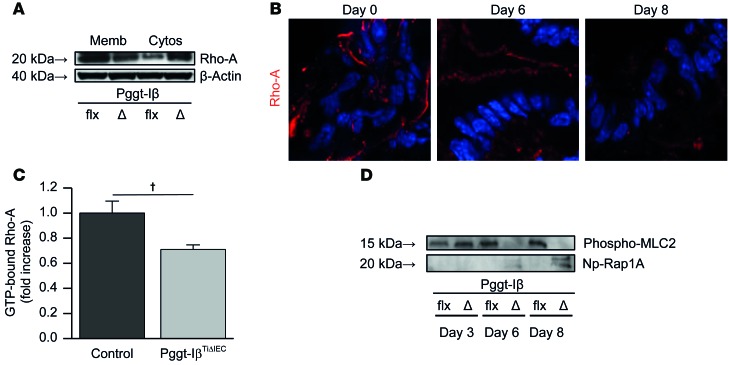
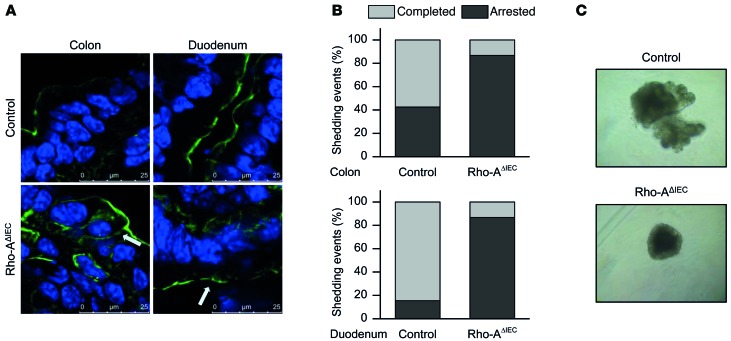
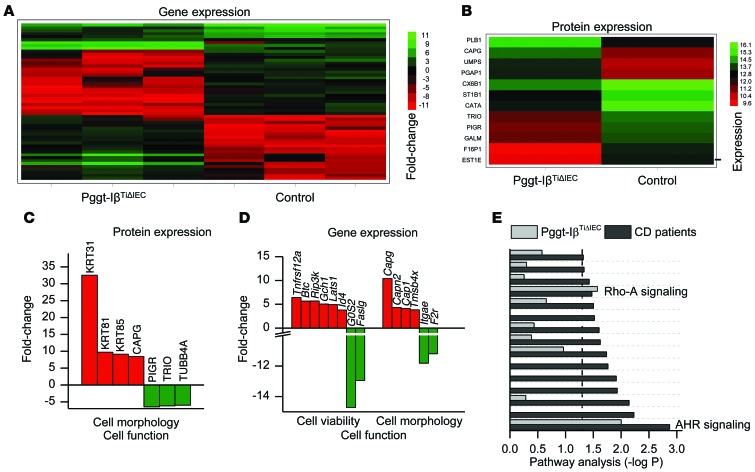
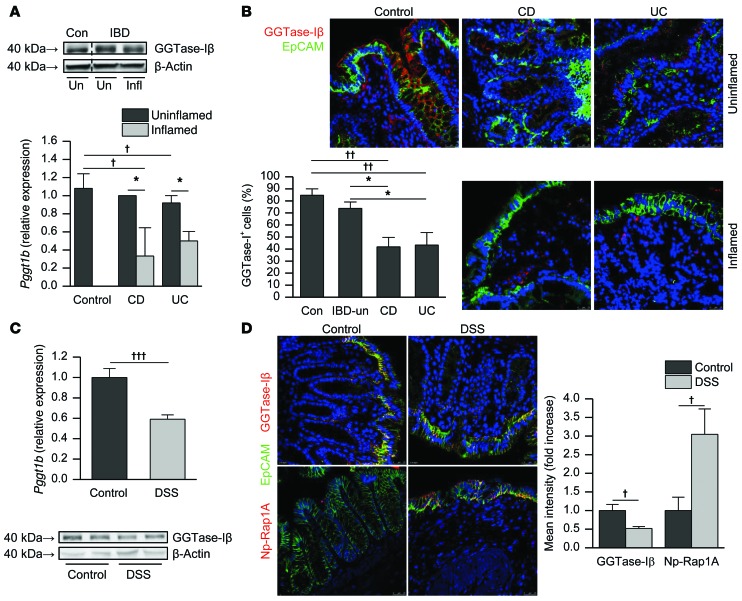
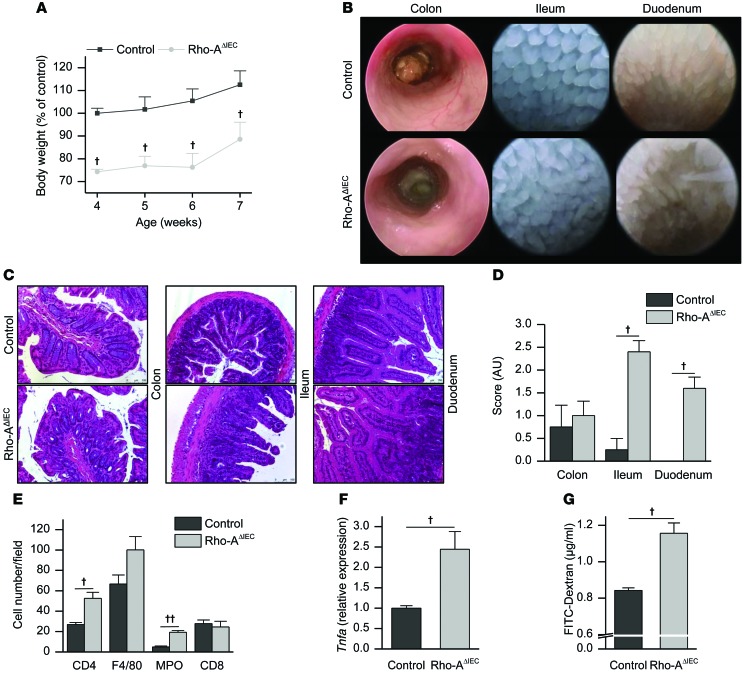
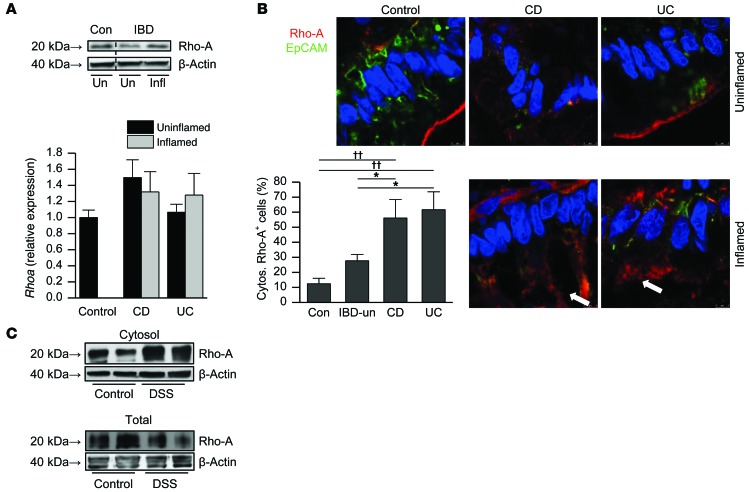
Although defects in intestinal barrier function are a key pathogenic factor in patients with inflammatory bowel diseases (IBDs), the molecular pathways driving disease-specific alterations of intestinal epithelial cells (IECs) are largely unknown. Here, we addressed this issue by characterizing the transcriptome of IECs from IBD patients using a genome-wide approach. We observed disease-specific alterations in IECs with markedly impaired Rho-A signaling in active IBD patients. Localization of epithelial Rho-A was shifted to the cytosol in IBDs, and inflammation was associated with suppressed Rho-A activation due to reduced expression of the Rho-A prenylation enzyme geranylgeranyltransferase-I (GGTase-I). Functionally, we found that mice with conditional loss of Rhoa or the gene encoding GGTase-I, Pggt1b, in IECs exhibit spontaneous chronic intestinal inflammation with accumulation of granulocytes and CD4+ T cells. This phenotype was associated with cytoskeleton rearrangement and aberrant cell shedding, ultimately leading to loss of epithelial integrity and subsequent inflammation. These findings uncover deficient prenylation of Rho-A as a key player in the pathogenesis of IBDs. As therapeutic triggering of Rho-A signaling suppressed intestinal inflammation in mice with GGTase-I-deficient IECs, our findings suggest new avenues for treatment of epithelial injury and mucosal inflammation in IBD patients.


Figures

Figure 14
Figure 14. Treatment of Pggt-IβTiΔIEC mice with the Rho activator CN03.
Three independent experiments. (A) Representative colonic endoscopy pictures. (B) Endoscopy score. (C) Histologic analysis: representative pictures from H&E staining. Original magnification, ×20. (D) Damage score quantification. (E) Il1b and Il6 expression in duodenum measured by qPCR. Mean values ± SEM from 3 independent experiments; (control, n = 4; Pggt-IβTiΔIEC, n = 6; CN03, n = 6 per group) in B, D, and E. P ≤ 0.05 vs. control mice; *P ≤ 0.05 vs. Pggt-IβTiΔIEC mice; 1-way ANOVA with LSD multiple comparisons test in B, D, and E.
Figure 13
Figure 13. Rho-A dysfunction in Pggt-IβTiΔIEC mice.
(A) Western blot of Rho-A in membrane-bound and cytosolic proteins from IECs of Pggt-IβTiΔIEC and control mice; blots are representative of 3 experiments. (B) Representative Rho-A immunostaining (red) in colon from Pggt-IβTiΔIEC mice (2 independent experiments). Nuclei were counterstained with Hoechst. Original magnification, ×63. (C) GTP-bound Rho-A in IECs from control and Pggt-IβTiΔIEC mice. Mean values ± SEM; n = 5 samples/group; P ≤ 0.05 vs. control; independent samples t test. (D) Western blot of phosphorylated MLC-2 and Np-Rap1A in IECs from control and Pggt-IβTiΔIEC mice; blots are representative of 2 experiments.
Figure 12
Figure 12. Epithelial integrity and turnover within Rho-A–deficient epithelium.
(A) Cytoskeleton rearrangement within Rho-A–deficient IECs. Representative pictures from phalloidin staining of F-actin fibers (green) (3 experiments). Nuclei were counterstained with Hoechst. Arrows indicate redistribution of actin fibers. Original magnification, ×63, zoom ×3. (B) Quantification of arrested vs. completed shedding events in colon and duodenum, expressed as percentage of total shedding events. Mean values ± SEM; n = 3 per group. (C) Development of organoids generated from small intestinal crypts isolated from control and Rho-AΔIEC mice; representative pictures out of 2 experiments.
Figure 11
Figure 11. Molecular consequence of diminished protein prenylation in IECs.
(A) Heat map of genes significantly regulated in IECs from Pggt-IβTiΔIEC vs. control mice (n = 3 per group; fold-change ≥ 10; P ≤ 0.05; independent samples t test). (B) Heat map of proteins significantly regulated in IECs from Pggt-IβTiΔIEC vs. control mice (n = 3 for control and n = 2 for Pggt-IβTiΔIEC mice; fold-change ≥ 5; P ≤ 0.05; independent samples t test). (C and D) GO analysis. Representation of selected genes (C) and proteins (D) from Top 10 list clustered in groups related to their cellular function (fold-change). (E) Pathway analysis comparison between gene expression profiles in IECs from CD patients and Pggt-IβTiΔIEC mice (P ≤ 0.05). Independent sample t test.
Figure 10
Figure 10. Cytoskeleton rearrangement and cell shedding within GGTase-Iβ–deficient epithelium.
(A) Representative electron microscopic pictures from duodenum of Pggt-IβTiΔIEC and control mice. Arrows indicate invaginations (red), apical network fibers (blue), and filamentous ultrastructure (yellow) (2 independent experiments). Original magnification, ×5,000; insets ×20,000. (B) Representative pictures from phalloidin staining of F-actin fibers (green) in colon and duodenum from Pggt-IβTiΔIEC mice (3 independent experiments). Nuclei were counterstained with Hoechst. Arrows indicate redistribution of actin fibers. Original magnification, ×63. (C) Quantification of arrested vs. completed shedding events, expressed as percentage of total shedding events. Mean values ± SEM; n = 11 (colon); n = 7 (duodenum).
Figure 9
Figure 9. Epithelial turnover and integrity within GGTase-Iβ–deficient epithelium.
(A) Representative in vivo images of small intestinal villi stained with acriflavine (green) (3 independent experiments). Arrows indicate epithelial gaps. Original magnification, ×40. (B) Live imaging of cell shedding in the small intestine from control and Pggt-IβTiΔIEC mice; acriflavine (green), and luminal rhodamine-dextran (red). Representative pictures out of 2 experiments. Original magnification, ×20. (C) Representative pictures and quantification of leakage entry points (red arrow) and permeable IECs (white arrow). Original magnification, ×40. Mean ± SEM; n = 8/group. P ≤ 0.05 and †††P ≤ 0.0001 vs. control mice; independent samples t test.
Figure 8
Figure 8. Development and survival of GGTase-Iβ–deficient organoids.
Small intestinal crypts isolated from control and Pggt-IβTiΔIEC mice were treated with tamoxifen in vitro. (A) Representative microscopic pictures out of 3 independent experiments. Original magnification, ×10. (B and C) Cell death staining measured by propidium iodide incorporation (red) as described in Methods. Nuclei were counsterstained with Hoechst (blue). Representative pictures; original magnification, ×20 (n = 17) (B). Quantification of normalized mean fluorescence intensity (red/blue). Bars show mean values ± SEM (n = 17) (C). P ≤ 0.05 vs. control; independent sample t test.
Figure 7
Figure 7. Phenotype of Pggt-IβTiΔIEC mice.
(A) Body weight of control and Pggt-IβTiΔIEC mice (percentage of mean body weight on day 0). n = 6/group; P ≤ 0.05 and ††P ≤ 0.001 vs. control. (B) Macroscopic pictures of whole gut (3 experiments). (C) Mini-endoscopic pictures (3 experiments). (D) H&E pictures. Original magnification, ×10; insets, ×40. (E) Histological score quantification of different gut segments (n = 6/group). P ≤ 0.05 and †††P ≤ 0.0001 vs. control. (F) Quantification of cell infiltration in duodenum (immunofluorescence staining). n = 6/group. (G) TNF-α expression in duodenum measured by qPCR. n = 2/group; representative of 3 experiments. (H) Serum concentration of orally administered FITC-Dextran (n = 4). Mean ± SEM in A and EH. P ≤ 0.05 vs. control in FH. Independent samples t test, in A and EH. Duoden, duodenum.
Figure 6
Figure 6. Validation of tamoxifen-induced Pggt1b deletion in IECs (Pggt-IβTiΔIEC mice).
Pggt-IβTiΔIEC mice were treated for 3 consecutive days with tamoxifen by i.p. injection. Day 0 was defined as the day of the first tamoxifen injection. (A) Western blot of GGTase-Iβ and Np-Rap1A in isolated IECs; blots are representative of 3 independent experiments. (B) Representative pictures of GGTase-Iβ (red) and Np-Rap1A (red) immunostainings in duodenum (n = 4/group). Sections were counterstained with EpCAM (green) and Hoechst (blue). Original magnification, ×63.
Figure 5
Figure 5. Regulation of GGTase-Iβ and Rho-A expression in intestinal epithelium.
(A) Pggt1b and Rhoa mRNA expression (measured by qPCR) in cytokine-treated intestinal organoids from unchallenged WT mice (20 ng/ml of the cytokine, 8 hours stimulation) (n = 3/group). P ≤ 0.05 vs. control; independent samples t test. (B) Pggt1b and Rhoa mRNA expression in IECs isolated from different gut segments from unchallenged WT mice (n = 4/group). P ≤ 0.05; 1-way ANOVA with LSD multiple comparisons test. Bars show mean ± SEM in A and B.
Figure 4
Figure 4. GGTase-Iβ profile in human and murine colitis.
(A) GGTase-Iβ protein expression in IECs isolated from human gut; blots are representative of 2 experiments. The same samples are shown in Figure 2A (top); Pggt1b mRNA expression (bottom) in IECs isolated from human gut. (control, n = 3; IBD uninflamed, n = 7; CD, n = 3; UC, n = 4). P ≤ 0.05 vs. control; *P ≤ 0.05 vs. IBD uninflamed. (B) Representative pictures and quantification of GGTase-Iβ immunostaining (red) in human gut samples. (control, n = 6; IBD uninflamed, n = 7; CD, n = 7; UC, n = 5). Bars show percentage of cells expressing GGTase-Iβ (2 villi or crypts/sample; 60 IECs/sample). ††P ≤ 0.001 vs. control; *P ≤ 0.05 vs. IBD uninflamed. Original magnification, ×63. (C) GGTase-Iβ expression in IECs from DSS-exposed mice: mRNA expression, measured by qPCR (n = 8/group). †††P ≤ 0.0001 vs. control (top); representative blot out of 3 experiments (bottom). (D) GGTase-Iβ immunostaining (red) in colon from DSS-treated mice. Mean intensity quantification (n = 8/group). Original magnification, ×63. P ≤ 0.05 vs. control. Immunostainings were counterstained with EpCAM (green) and Hoechst (blue) in B and D. Mean values ± SEM are shown in AD. One-way ANOVA with LSD multiple comparisons test were used in A and B. Independent samples t test was used in C and D. Con, control; un, uninflamed; infl, inflamed.
Figure 3
Figure 3. Phenotype of Rho-AΔIEC mice.
(A) Body weight of control and Rho-AΔIEC mice; percentage is calculated over the mean body weight of control mice on week 4. (n = 9). (B) Representative miniendoscopy pictures of different gut segments (3 experiments). (C) Representative H&E pictures (3 experiments). Original magnification, ×20. (D) Histological score quantification of different gut segments (n = 9). (E) Quantification of cell infiltration in ileum (immunofluorescence staining). n = 6/group. (F) Tnfa expression in ileum measured by qPCR. (n = 6/group). (G) Serum concentration of orally administered FITC-Dextran. n = 4/group. Data represent mean ± SEM in A and DG. P ≤ 0.05 and ††P ≤ 0.001 vs. control, independent samples t test, in A, D, F, and G.
Figure 2
Figure 2. Rho-A profile in human and murine colitis.
(A) Rho-A protein expression in IECs isolated from human gut; blots are representative of 2 experiments (top); and Rhoa mRNA expression (bottom) in IECs isolated from human gut. Mean values ± SEM are shown (controls, n = 4; IBD uninflamed, n = 9; CD, n = 5; UC, n = 4). No statistical significance, 1-way ANOVA with LSD multiple comparisons test. (B) Representative pictures and quantification from Rho-A immunostaining (red) in human gut samples. Sections were counterstained with EpCAM (green) and Hoechst (blue). Arrows indicate cytosolic accumulation of Rho-A. Bars show percentage of cells with cytosolic Rho-A (2 villi or crypts/sample; 30 IEC/sample). Mean values ± SEM (controls, n = 5; IBD uninflamed, n = 7; CD, n = 3; UC, n = 3). ††P ≤ 0.001 vs. control; *P ≤ 0.05 vs. IBD-uninflamed; 1-way ANOVA with LSD multiple comparisons test. Original magnification, ×63, zoom ×4. (C) Western blot analysis of Rho-A in cytosolic and total proteins from colonic IECs from DSS-exposed and unchallenged mice. Blots are representative of 2 experiments (n = 4/group). Con, control; un, uninflamed; infl, inflamed.
Figure 1
Figure 1. Gene expression array comparing IECs isolated from uninflamed and inflamed gut areas of CD patients.
(A) Heat map showing differentially expressed genes in IECs (fold-change ≥ 1.5; P ≤ 0.05). (B) Top 20 regulated canonical pathways. Data are expressed as –log (P value). P value was obtained by independent sample t test (Ingenuity analysis). n = 9.

Similar articles

Cited by

References

    1. Turner JR. Intestinal mucosal barrier function in health and disease. Nat Rev Immunol. 2009;9(11):799–809. doi: 10.1038/nri2653. - DOI - PubMed
    1. van der Flier LG, Clevers H. Stem cells, self-renewal, and differentiation in the intestinal epithelium. Annu Rev Physiol. 2009;71:241–260. doi: 10.1146/annurev.physiol.010908.163145. - DOI - PubMed
    1. Watson AJ, Duckworth CA, Guan Y, Montrose MH. Mechanisms of epithelial cell shedding in the Mammalian intestine and maintenance of barrier function. Ann N Y Acad Sci. 2009;1165:135–142. doi: 10.1111/j.1749-6632.2009.04027.x. - DOI - PubMed
    1. Gunther C, et al. Caspase-8 regulates TNF-α-induced epithelial necroptosis and terminal ileitis. Nature. 2011;477(7364):335–339. doi: 10.1038/nature10400. - DOI - PMC - PubMed
    1. Watson AJ, et al. Epithelial barrier function in vivo is sustained despite gaps in epithelial layers. Gastroenterology. 2005;129(3):902–912. doi: 10.1053/j.gastro.2005.06.015. - DOI - PubMed

Publication types

MeSH terms