

doi: 10.1038/nmeth.3728.
Epub 2016 Jan 11.
Parallel single-cell sequencing links transcriptional and epigenetic heterogeneity
Affiliations
- PMID: 26752769
- PMCID: PMC4770512
- DOI: 10.1038/nmeth.3728
Item in Clipboard
Parallel single-cell sequencing links transcriptional and epigenetic heterogeneity
Nat Methods.
2016 Mar.
Abstract
We report scM&T-seq, a method for parallel single-cell genome-wide methylome and transcriptome sequencing that allows for the discovery of associations between transcriptional and epigenetic variation. Profiling of 61 mouse embryonic stem cells confirmed known links between DNA methylation and transcription. Notably, the method revealed previously unrecognized associations between heterogeneously methylated distal regulatory elements and transcription of key pluripotency genes.
Figures
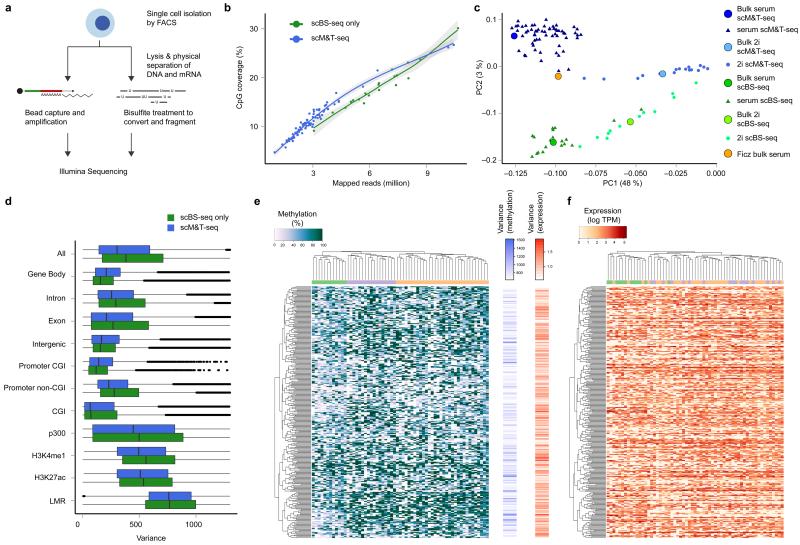
a) Schematic overview of the scM&T-seq protocol. b) CpG coverage of single cells as a function of the number of mapped sequencing reads. Green: stand-alone scBS-seq, Blue: scM&T-seq. c) Joint principal component analysis of the methylomes (gene body methylation) of 61 serum ESCs (dark blue) and 16 2i ESCs (light blue) obtained using scM&T-seq, as well as 20 serum ESCs (green) and 12 2i ESCs (yellow) sequenced using stand-alone scBS-seq. The solid circles correspond to synthetic bulk datasets form the same cells. For comparison, we also included a bulk serum ESC DNA methylation dataset (orange). Cell type explained a substantially larger proportion of variance (PC1, 48%) than protocol (PC2, 3%). d) Comparison of epigenetic heterogeneity in different genomic context, either considering 61 serum ESCs obtained using scM&T-seq (blue), or 20 serum ESCs sequenced using stand-alone scBS-seq (green). e, f) Clustering analysis of transcriptome and methylation data from 61 serum ESCs, considering gene body methylation (e) and gene expression (f) for the 300 most heterogeneous genes (based on gene body methylation). The order of genes was taken from an individual clustering analysis based on gene body methylation whereas cells were clustered separately either using DNA methylation or expression data, and coloured by methylation cluster. The bar plots in the center show the heterogeneity in DNA methylation (left) and gene expression (right).
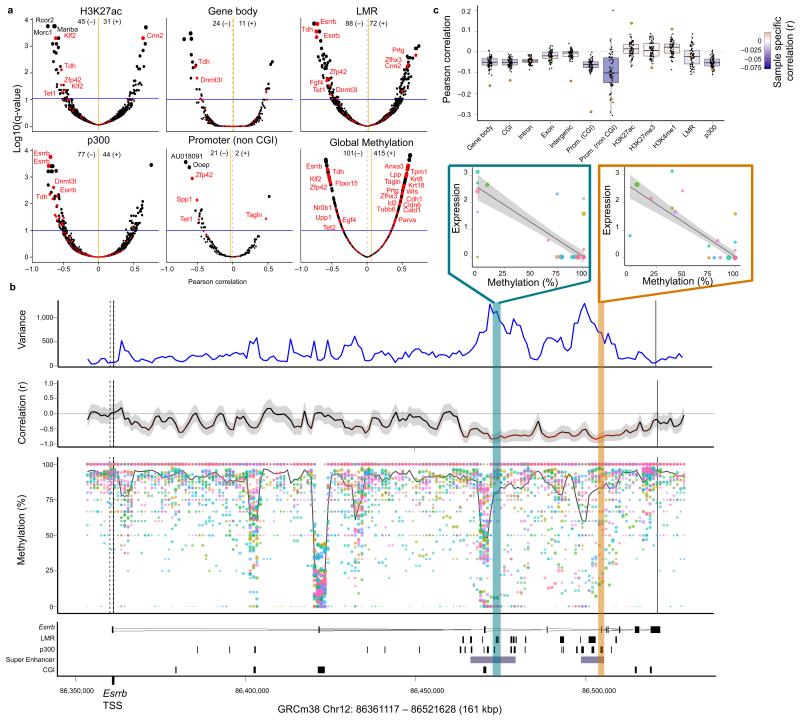
a) Volcano plots of correlation coefficients (Pearson r2) from association tests between gene expression heterogeneity of individual genes and DNA methylation heterogeneity in alternative genomic contexts. Shown is the correlation coefficient for every gene (x-axis) versus the adjusted p-value (using Benjamini-Hochberg correction; y-axis). The size of dots corresponds to the adjusted p-value. A set of 86 known pluripotency and differentiation genes are highlighted in red. The blue horizontal line corresponds to the FDR 10% significance threshold. The total number of significant positive (+) and negative (−) correlations (FDR < 10%) for each annotation is shown in the header of each panel. The orange vertical bar corresponds to the average correlation coefficient across all genes for a given context. b) Representative zoom-in view for the gene Esrrb. From bottom to top, shown is: the annotation of the Esrrb locus with LMR, p300, super enhancer and CGI sites indicated; the estimated methylation rate of 3kb windows for each cell with the size of dots representing the CpG coverage and the solid line indicating the weighted mean methylation rate across all cells; the correlation between the methylation rate and Esrrb expression for each region coloured by the strength of the correlation and with the shaded area corresponding to the 95% confidence interval of the correlation coefficient; and the estimated weighted DNA methylation variance between cells. The top two scatter plots depict the association between DNA methylation at a p300 region (yellow) and an LMR (blue) and Esrrb expression. c) Gene-specific association analysis, assessing correlations between DNA methylation in different genomic contexts and gene expression in individual cells. For each annotation, shown are box plots of methylation-expression correlations for all variable genes in single cells, with the correlation obtained from matched RNA-seq and BS-seq of a bulk cell population superimposed (orange circles).
Comment in
-
Epigenomics: Parallel single-cell sequencing.Nat Rev Genet. 2016 Mar;17(3):125. doi: 10.1038/nrg.2016.5. Epub 2016 Jan 25. Nat Rev Genet. 2016. PMID: 26806414 No abstract available.
References
Publication types
MeSH terms
Substances
Grants and funding
LinkOut - more resources
Full Text Sources
Other Literature Sources
Molecular Biology Databases
