. 2016 Jan 8:9:1.
doi: 10.1186/s13072-015-0049-x. eCollection 2016.

Roles of cofactors and chromatin accessibility in Hox protein target specificity

Affiliations

Roles of cofactors and chromatin accessibility in Hox protein target specificity

Ching Yew Beh et al. Epigenetics Chromatin. .

Abstract

Background: The regulation of specific target genes by transcription factors is central to our understanding of gene network control in developmental and physiological processes yet how target specificity is achieved is still poorly understood. This is well illustrated by the Hox family of transcription factors as their limited in vitro DNA-binding specificity contrasts with their clear in vivo functional specificity.

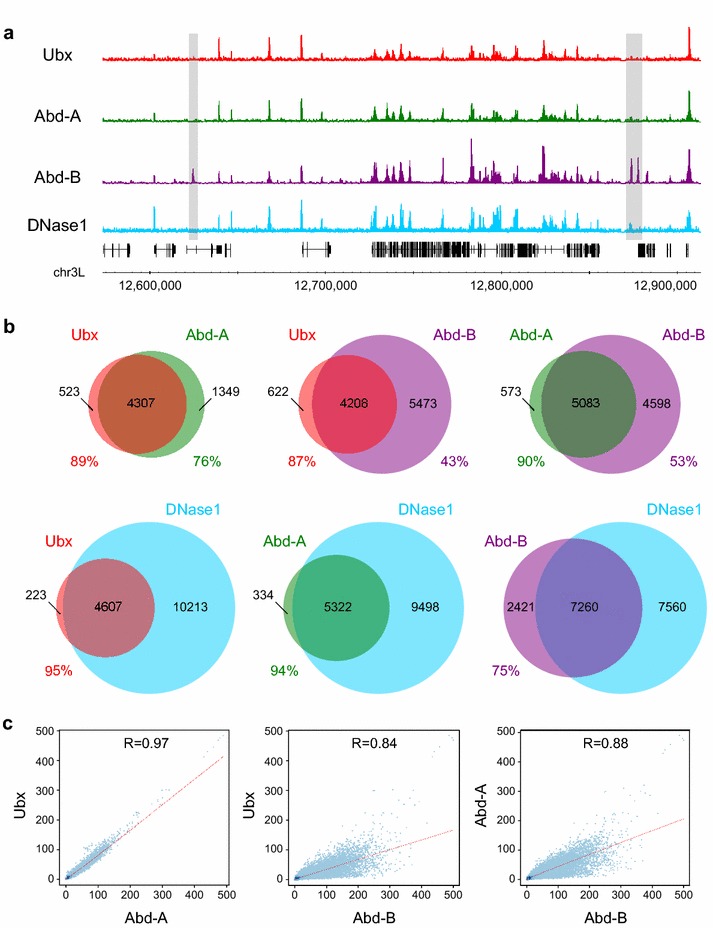
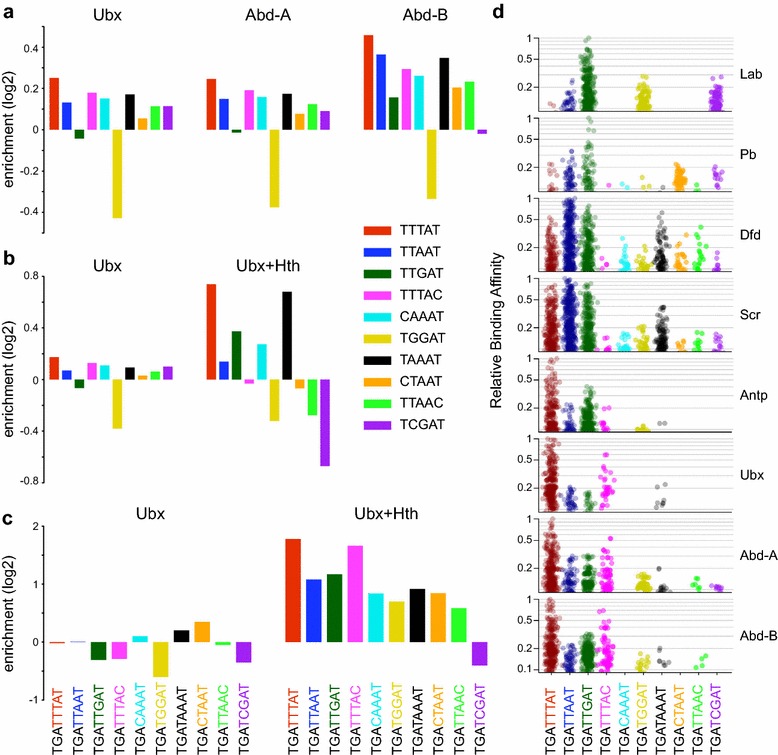
Results: We generated genome-wide binding profiles for three Hox proteins, Ubx, Abd-A and Abd-B, following transient expression in Drosophila Kc167 cells, revealing clear target specificity and a striking influence of chromatin accessibility. In the absence of the TALE class homeodomain cofactors Exd and Hth, Ubx and Abd-A bind at a very similar set of target sites in accessible chromatin, whereas Abd-B binds at an additional specific set of targets. Provision of Hox cofactors Exd and Hth considerably modifies the Ubx genome-wide binding profile enabling Ubx to bind at an additional novel set of targets. Both the Abd-B specific targets and the cofactor-dependent Ubx targets are in chromatin that is relatively DNase1 inaccessible prior to the expression of Hox proteins/Hox cofactors.

Conclusions: Our experiments demonstrate a strong role for chromatin accessibility in Hox protein binding and suggest that Hox protein competition with nucleosomes has a major role in Hox protein target specificity in vivo.

Keywords: Chromatin accessibility; Hox proteins; Transcription factor.


Figures

Fig. 1
Fig. 1
Hox protein binding and chromatin accessibility in Kc167 cells. a Comparison of binding profiles of the three Bithorax complex Hox proteins (Ubx, Abd-A and Abd-B) and DNase1 accessibility in Kc167 cells. Examples of Abd-B specific peaks are highlighted in grey. b Venn diagrams showing overlap analysis of binding peaks. Hox peaks are q-value 1e−10 and DNase1 peaks are q-value 1e−2. Percentage overlap is indicated. The overlap of Abd-A and Ubx is reinforced by stringent versus relaxed analysis (i.e. overlap of q-value 1e−10 peaks with q-value 1e−2 peaks); for example, Abd-A stringent almost completely overlaps Ubx relaxed (99.6 %), whereas Abd-B stringent only has 75 % overlap with Ubx relaxed. c Scatter plots showing Pearson’s correlations between the Hox protein binding profiles based on binding score per 1 kb window. The Ubx and Abd-A profiles are highly correlated, while the correlations with Abd-B are lower and the binding scores more scattered
Fig. 2
Fig. 2
Binding of the Hox-GFP fusion proteins in Kc167 cells is mainly dependent on direct interaction with DNA. a The homeodomain sequence of Ubx protein. The Arg3, Arg5, Ile47, Gln50 and Asn51 residues, mediating DNA contacts in the major and minor groves (red in Ubx wild type) were mutated to Ala3, Ala5, Ala47, Lys50 and Ala51 (grey in Ubx mutant), abolishing the ability to bind DNA. The Ubx motif sequence logo is from the JASPAR database (MA0094.2). b Comparison of the binding profiles (with fragment pileup signal normalized per million reads) of wild type and mutant Ubx (Experiment 2), with the mutant showing a strong reduction in binding. c Venn diagram showing the overlap of binding peaks (q-value 1e−10) between Ubx wild type and mutant. About 66 % of Ubx wild type peaks do not overlap with Ubx mutant peaks
Fig. 3
Fig. 3
Hox cofactors Exd and Hth alter the binding profile of Ubx. a The pMT-Hth2AGFPUbx bicistronic expression vector used to co-express Hth and Ubx-GFP in Kc167 cells. The construct contains the Drosophila metallothionein (MT) promoter, Hth cDNA isoform A, Thosea asigna 2A self-cleaving peptide (T2A), enhanced Green Fluorescent Protein (eGFP) fused to Ubx cDNA isoform E, C-terminal peptide (containing V5 and polyhistidine tags and SV40 polyadenylation signal), and an ampicillin resistance gene. b Exd immunolabelling (red) was used to confirm that transfection of Kc167 cells with pMT-Hth2AGFPUbx results in the expression of functional Hth with Hth-dependant recruitment of Exd into the nucleus. Left: In non-transfected cells (Hth−), Exd is excluded from the nucleus (arrowhead). Middle: In transfected cells (Hth+), Hth induces nuclear accumulation of Exd protein (arrowhead). Right: Same as ‘Middle’ but also showing Ubx-GFP (green). Hth +/− cells were separated by FACS following transfection (Additional file 1: Figure S1). c Comparison of binding profiles of Ubx and Ubx in the presence of Hth (Experiment 2). Examples of cofactor-dependent binding are highlighted in grey. d Venn diagram showing the overlap of binding peaks (q-value 1e–10) between Ubx and Ubx + Hth. 51 % of the Ubx + Hth peaks are novel. e Venn diagram showing the overlap of binding peaks between Ubx + Hth and DNase1 (q-value 1e–10 for Ubx + Hth and 1e–2 for DNase1). 17 % of the Ubx + Hth peaks are in DNase1 inaccessible chromatin
Fig. 4
Fig. 4
Motif enrichment analysis of the DNA sequences underpinning the binding profiles. Motif enrichment analysis was performed using PWMEnrich for the Hox and Hox cofactor PWM motifs in the MotifDb database. Enrichment scores [log10(1/p-value)] for individual motifs are indicated (grey dots) together with median for each motif set (coloured bar). a Comparing motif enrichments for DNase1 (1000 random q-value 1e–2 peaks) and Ubx (1000 q-value 1e–2 peaks with highest Ubx versus DNase1 differential signal; Experiment 1) reveals that DNase1 peaks in general are not enriched for Hox PWMs, whereas Ubx peaks show clear enrichment with the posterior Hox gene PWMs showing the highest enrichment. Little or no enrichment is observed for Hox cofactor PWMs. b Comparing Ubx wild type (1000 q-value 1e−10 peaks with highest Ubx versus DNase1 differential signal; Experiment 2) and Ubx mutant (1000 q-value 1e−10 peaks with highest Ubx mutant versus DNase1 differential signal), reveals lack of Hox and Hox cofactor PWM enrichment in Ubx mutant peaks. c Comparing Ubx (1000 q-value 1e–2 peaks with highest Ubx versus DNase1 differential signal; Experiment 1) and Abd-B (1000 q-value 1e–2 peaks with highest Abd-B versus DNase1 differential signal), demonstrates that Abd-B peaks have markedly higher enrichments for Hox PWMs but otherwise a similar enrichment profile (cf. Ubx in a). d Comparing Ubx (328 random q-value 1e–2 peaks common to Ubx Experiment 2 and Ubx + Hth) and Ubx + Hth (328 q-value 1e–2 peaks specific to Ubx + Hth); in the presence of Exd and Hth, the enrichment of Exd and Hth PWMs in the Ubx peaks is increased and the enrichment of Hox PWMs is shifted towards a greater relative preference for Abd-B motifs
Fig. 5
Fig. 5
Preferential Hox DNA-binding fingerprints. An enrichment score based on k-mer frequency per kb, in selected peak sets versus background sequence, is plotted for 5-mer and 8-mer sequences derived from the Slattery et al. in vitro SELEX-Seq study on Hox protein binding [9]. a Enrichment of a set of Hox monomer binding 5-mers for Ubx (all q-value 1e–2 peaks, Experiment 1), Abd-A (all q-value 1e–2 peaks) and Abd-B (all q-value 1e–2 peaks). Although the Abd-B peaks show higher enrichments, overall the three Hox proteins have very similar 5-mer enrichment profiles. b Comparative 5-mer enrichment analysis between Ubx (all q-value 1e–2 peaks, Experiment 2) and Ubx + Hth (328 peaks specific to Ubx + Hth, using q-value 1e–2 peaks) reveals specific changes in the enrichment profile; in the Ubx + Hth peaks, the TTGAT (dark green) 5-mer containing the core Exd motif ‘TGAT’ [13] is preferentially enriched, and the TTTAT (red) 5-mer containing the core Hox motif ‘TTAT’ is more enriched relative to the TTAAT (dark blue) 5-mer containing the core ‘TAAT’ motif. c Enrichment of a set of Exd-Hox dimer binding 8-mers for Ubx (all q-value 1e–2 peaks, Experiment 2) and Ubx + Hth (highest 1000 peaks specific to Ubx + Hth from the overlap between Ubx + Hth and Ubx alone, using q-value 1e–2 peaks, Experiment 2). The 8-mer fingerprint of Ubx in the presence of Exd and Hth strongly resembles the posterior Hox class fingerprints from the SELEX-Seq study (see Fig. 5d). The TGATTTAT (red) and TGATTTAC (magenta) 8-mers clearly relate the in vivo fingerprint to the in vitro posterior Hox fingerprints. d Strip charts showing the distribution of relative binding affinities for each of the eight Exd-Hox dimers to a set of core Exd-Hox binding 8-mers. Image was reproduced from the SELEX-Seq study [9], with permission from Elsevier
Fig. 6
Fig. 6
Abd-B specific and cofactor-dependent Ubx peaks in DNase1-inaccessible chromatin. a Comparative overlap analysis between Abd-B/Ubx common and Abd-B specific peaks with DNase1 peaks. Almost all (97 %) of the Abd-B/Ubx common peaks overlap with DNase1, while only 58 % of the Abd-B specific peaks overlap with DNase1. Hox peak sets were derived by the overlap analysis of Abd-B and Ubx Experiment 1; using q-value 1e−10 peaks. DNase1 peaks are q-value 1e–2. b Comparative overlap analysis between Ubx + Hth/Ubx common and Ubx + Hth specific peaks with DNase1 peaks. Almost all (96 %) of the Ubx + Hth/Ubx common peaks overlap with DNase1, while only 71 % of the Ubx + Hth specific peaks overlap with DNase1. Hox peak sets were derived by the overlap analysis of Ubx + Hth and Ubx Experiment 2; using q-value 1e−10 peaks. DNase1 peaks are q-value 1e–2. c For each selected peak set, the median bedGraph score per peak was calculated and the distribution plotted, showing that Abd-B specific and cofactor-dependent Ubx (Ubx + Hth specific) peaks have markedly reduced DNase1 accessibility. Hox peak sets were derived by overlap analysis as described in a and b but using q-value 1e–2 peaks. d Using the colour-coded chromatin state classification scheme described in Kc cells [25], the plot shows the prevalence of different chromatin states across the Kc cell genome. e Chromatin state prevalence plots for DNase1 (all q-value 1e–2 peaks), Ubx (all q-value 1e–2 peaks, Experiment 1), Abd-A (all q-value 1e–2 peaks) and Abd-B (all q-value 1e–2 peaks). f Chromatin state prevalence plots for Abd-B/Ubx common (highest 1000 peaks) and Abd-B specific (highest 1000 peaks). Peak sets were derived as described in c. The Abd-B specific peaks are strongly shifted towards the ‘repressed’ blue and black states. g Chromatin state prevalence plots for cofactor-independent Ubx peaks (Ubx + Hth/Ubx common; highest 1000 peaks) and cofactor-dependent Ubx peaks (Ubx + Hth specific; highest 1000 peaks). Peak sets were derived as described in c. The cofactor-dependent Ubx peaks are strongly shifted towards the ‘repressed’ states
Fig. 7
Fig. 7
Characteristics of Abd-B peaks in DNase1-inaccessible chromatin. a Enrichment of a set of core Hox binding 5-mers (as described in Fig. 5) in Abd-B peaks in accessible (Abd-B and DNase1) and inaccessible (Abd-B not DNase1) chromatin. Peak sets were derived by the overlap analysis of Abd-B and DNase1; using q-value 1e–2 peaks. Although the DNase1-inaccessible peaks generally have higher 5-mer enrichments, the profiles are similar. b Density analysis of matches to the Abd-B PWM (MA0165.1, JASPAR database) on the left and to the Ubx PWM (MA0094.2, JASPAR database) on the right. The Abd-B peaks in inaccessible chromatin (AbdBnotDNase1) and the Abd-B specific peaks (AbdBnotUbx) have a higher density of matches to the Abd-B PWM compared to peaks in accessible chromatin (AbdBandDNase1) or Abd-B/Ubx common peaks (AbdBandUbx). Similarly, the cofactor-dependent Ubx peaks (UbxHthnotUbx) have a higher density of matches to the Ubx PWM compared to cofactor-independent peaks (UbxHthandUbx). Peak sets were derived by the overlap analysis of Abd-B and DNase1, Abd-B and Ubx Experiment 1, Ubx + Hth and DNase1, and Ubx + Hth and Ubx Experiment 2; using q-value 1e–2 peaks. c Comparative DNA shape analysis, showing that the average predicted minor groove width for Abd-B peaks in inaccessible chromatin (Abd-B not DNase1) is narrower in a region of 200 bp centred on the peak summit, compared to the Abd-B peaks in accessible chromatin (Abd-B and DNase1) where the average predicted minor groove width is wider. This narrowing in the minor groove width is not observed in the Ubx + Hth peaks occurring in inaccessible chromatin. DNase1 peak summits have a local increase in minor groove width. Peak sets were derived as described in b. DNase1 peaks are q-value 1e−2. d Comparative GC composition analysis, showing that Abd-B peaks in inaccessible chromatin (Abd-B not DNase1) are associated with a lower GC content compared to Abd-B peaks in accessible chromatin (Abd-B and DNase1). This lower GC content is not observed in the Ubx + Hth peaks occurring in inaccessible chromatin. DNase1 peak summits have a prominent local increase in GC content. Peak sets are the same as in c

Similar articles

Cited by

References

    1. Mann RS, Lelli KM, Joshi R. Hox specificity: unique roles for cofactors and collaborators. Curr Top Dev Biol. 2009;88:63–101. doi: 10.1016/S0070-2153(09)88003-4. - DOI - PMC - PubMed
    1. Rezsohazy R, Saurin AJ, Maurel-Zaffran C, Graba Y. Cellular and molecular insights into Hox protein action. Development. 2015;142(7):1212–1227. doi: 10.1242/dev.109785. - DOI - PubMed
    1. Chan S-K, Jaffe L, Capovilla M, Botas J, Mann RS. The DNA binding specificity of Ultrabithorax is modulated by cooperative interactions with extradenticle, another homeoprotein. Cell. 1994;78(4):603–615. doi: 10.1016/0092-8674(94)90525-8. - DOI - PubMed
    1. Chang CP, Shen WF, Rozenfeld S, Lawrence HJ, Largman C, Cleary ML. Pbx proteins display hexapeptide-dependent cooperative DNA binding with a subset of Hox proteins. Genes Dev. 1995;9(6):663–674. doi: 10.1101/gad.9.6.663. - DOI - PubMed
    1. van Dijk MA, Murre C. Extradenticle raises the DNA binding specificity of homeotic selector gene products. Cell. 1994;78(4):617–624. doi: 10.1016/0092-8674(94)90526-6. - DOI - PubMed