

Profiling olfactory stem cells from living patients identifies miRNAs relevant for autism pathophysiology
- PMID: 26753090
- PMCID: PMC4705753
- DOI: 10.1186/s13229-015-0064-6
Profiling olfactory stem cells from living patients identifies miRNAs relevant for autism pathophysiology
Abstract
Background: Autism spectrum disorders (ASD) are a group of neurodevelopmental disorders caused by the interaction between genetic vulnerability and environmental factors. MicroRNAs (miRNAs) are key posttranscriptional regulators involved in multiple aspects of brain development and function. Previous studies have investigated miRNAs expression in ASD using non-neural cells like lymphoblastoid cell lines (LCL) or postmortem tissues. However, the relevance of LCLs is questionable in the context of a neurodevelopmental disorder, and the impact of the cause of death and/or post-death handling of tissue likely contributes to the variations observed between studies on brain samples.
Methods: miRNA profiling using TLDA high-throughput real-time qPCR was performed on miRNAs extracted from olfactory mucosal stem cells (OMSCs) biopsied from eight patients and six controls. This tissue is considered as a closer tissue to neural stem cells that could be sampled in living patients and was never investigated for such a purpose before. Real-time PCR was used to validate a set of differentially expressed miRNAs, and bioinformatics analysis determined common pathways and gene targets. Luciferase assays and real-time PCR analysis were used to evaluate the effect of miRNAs misregulation on the expression and translation of several autism-related transcripts. Viral vector-mediated expression was used to evaluate the impact of miRNAs deregulation on neuronal or glial cells functions.
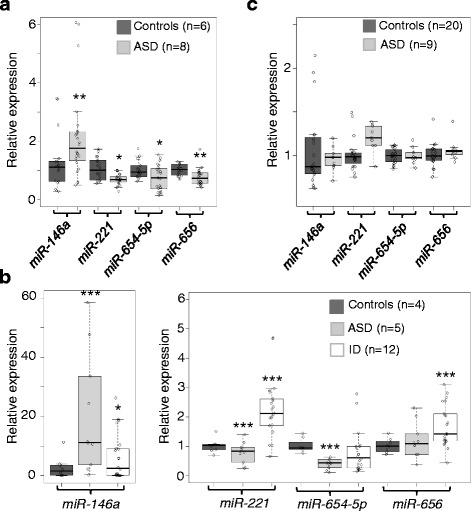
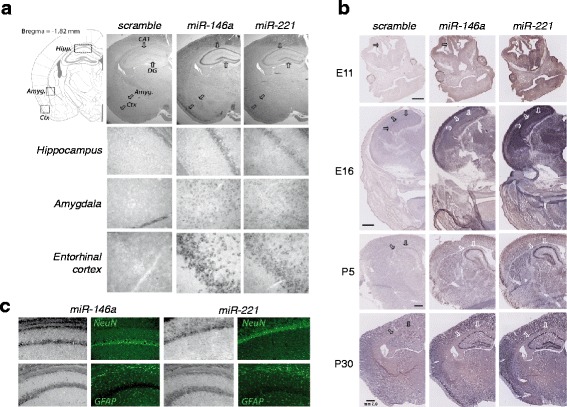
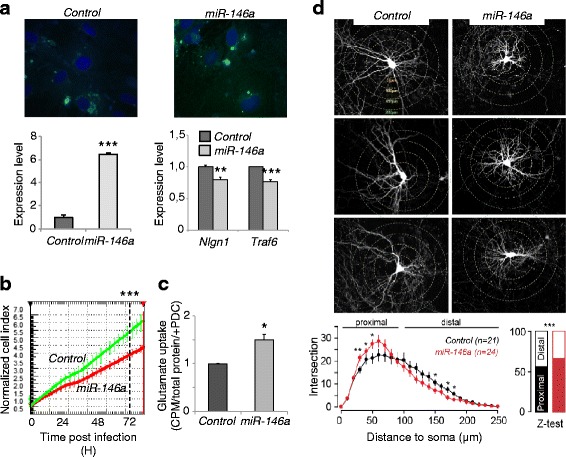
Results: We identified a signature of four miRNAs (miR-146a, miR-221, miR-654-5p, and miR-656) commonly deregulated in ASD. This signature is conserved in primary skin fibroblasts and may allow discriminating between ASD and intellectual disability samples. Putative target genes of the differentially expressed miRNAs were enriched for pathways previously associated to ASD, and altered levels of neuronal transcripts targeted by miR-146a, miR-221, and miR-656 were observed in patients' cells. In the mouse brain, miR-146a, and miR-221 display strong neuronal expression in regions important for high cognitive functions, and we demonstrated that reproducing abnormal miR-146a expression in mouse primary cell cultures leads to impaired neuronal dendritic arborization and increased astrocyte glutamate uptake capacities.
Conclusions: While independent replication experiments are needed to clarify whether these four miRNAS could serve as early biomarkers of ASD, these findings may have important diagnostic implications. They also provide mechanistic connection between miRNA dysregulation and ASD pathophysiology and may open up new opportunities for therapeutic.
Keywords: Astrocyte; Autism spectrum disorders; MicroRNA; Neuron; Olfactory mucosa stem cells.
Figures

Similar articles
-
Role of miR-146a in neural stem cell differentiation and neural lineage determination: relevance for neurodevelopmental disorders.Mol Autism. 2018 Jun 19;9:38. doi: 10.1186/s13229-018-0219-3. eCollection 2018. Mol Autism. 2018. PMID: 29951184 Free PMC article.
-
Profiling of Circulating Serum MicroRNAs in Children with Autism Spectrum Disorder using Stem-loop qRT-PCR Assay.Folia Med (Plovdiv). 2017 Mar 1;59(1):43-52. doi: 10.1515/folmed-2017-0009. Folia Med (Plovdiv). 2017. PMID: 28384108
-
Post-transcriptional regulation of SHANK3 expression by microRNAs related to multiple neuropsychiatric disorders.Mol Brain. 2015 Nov 16;8(1):74. doi: 10.1186/s13041-015-0165-3. Mol Brain. 2015. PMID: 26572867 Free PMC article.
-
Systematic Review and Bioinformatic Analysis of microRNA Expression in Autism Spectrum Disorder Identifies Pathways Associated With Cancer, Metabolism, Cell Signaling, and Cell Adhesion.Front Psychiatry. 2021 Oct 21;12:630876. doi: 10.3389/fpsyt.2021.630876. eCollection 2021. Front Psychiatry. 2021. PMID: 34744804 Free PMC article.
-
MicroRNAs as biomarkers for psychiatric disorders with a focus on autism spectrum disorder: Current progress in genetic association studies, expression profiling, and translational research.Autism Res. 2017 Jul;10(7):1184-1203. doi: 10.1002/aur.1789. Epub 2017 Apr 17. Autism Res. 2017. PMID: 28419777 Review.
Cited by
-
miRNAs as biomarkers of autism spectrum disorder: a systematic review and meta-analysis.Eur Child Adolesc Psychiatry. 2024 Sep;33(9):2957-2990. doi: 10.1007/s00787-023-02138-3. Epub 2023 Feb 3. Eur Child Adolesc Psychiatry. 2024. PMID: 36735095 Free PMC article.
-
A Comparative Review of microRNA Expression Patterns in Autism Spectrum Disorder.Front Psychiatry. 2016 Nov 4;7:176. doi: 10.3389/fpsyt.2016.00176. eCollection 2016. Front Psychiatry. 2016. PMID: 27867363 Free PMC article.
-
Role of miR-146a in neural stem cell differentiation and neural lineage determination: relevance for neurodevelopmental disorders.Mol Autism. 2018 Jun 19;9:38. doi: 10.1186/s13229-018-0219-3. eCollection 2018. Mol Autism. 2018. PMID: 29951184 Free PMC article.
-
Integration of structural MRI and epigenetic analyses hint at linked cellular defects of the subventricular zone and insular cortex in autism: Findings from a case study.Front Neurosci. 2023 Feb 3;16:1023665. doi: 10.3389/fnins.2022.1023665. eCollection 2022. Front Neurosci. 2023. PMID: 36817099 Free PMC article.
-
miRNA regulation of social and anxiety-related behaviour.Cell Mol Life Sci. 2020 Nov;77(21):4347-4364. doi: 10.1007/s00018-020-03542-7. Epub 2020 May 14. Cell Mol Life Sci. 2020. PMID: 32409861 Free PMC article. Review.
References
-
- Hu VW, Frank BC, Heine S, Lee NH, Quackenbush J. Gene expression profiling of lymphoblastoid cell lines from monozygotic twins discordant in severity of autism reveals differential regulation of neurologically relevant genes. BMC Genomics. 2006;7:118. doi: 10.1186/1471-2164-7-118. - DOI - PMC - PubMed
Publication types
MeSH terms
Substances
LinkOut - more resources
Full Text Sources
Other Literature Sources
Medical
