Cells Comprising the Prostate Cancer Microenvironment Lack Recurrent Clonal Somatic Genomic Aberrations
- PMID: 26753621
- PMCID: PMC5582956
- DOI: 10.1158/1541-7786.MCR-15-0330
Cells Comprising the Prostate Cancer Microenvironment Lack Recurrent Clonal Somatic Genomic Aberrations
Abstract
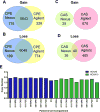
Prostate cancer-associated stroma (CAS) plays an active role in malignant transformation, tumor progression, and metastasis. Molecular analyses of CAS have demonstrated significant changes in gene expression; however, conflicting evidence exists on whether genomic alterations in benign cells comprising the tumor microenvironment (TME) underlie gene expression changes and oncogenic phenotypes. This study evaluates the nuclear and mitochondrial DNA integrity of prostate carcinoma cells, CAS, matched benign epithelium and benign epithelium-associated stroma by whole-genome copy-number analyses, targeted sequencing of TP53, and FISH. Array comparative genomic hybridization (aCGH) of CAS revealed a copy-neutral diploid genome with only rare and small somatic copy-number aberrations (SCNA). In contrast, several expected recurrent SCNAs were evident in the adjacent prostate carcinoma cells, including gains at 3q, 7p, and 8q, and losses at 8p and 10q. No somatic TP53 mutations were observed in CAS. Mitochondrial DNA (mtDNA) extracted from carcinoma cells and stroma identified 23 somatic mtDNA mutations in neoplastic epithelial cells, but only one mutation in stroma. Finally, genomic analyses identified no SCNAs, LOH, or copy-neutral LOH in cultured cancer-associated fibroblasts, which are known to promote prostate cancer progression in vivo
Implications: The gene expression changes observed in prostate cancer-adjacent stroma and the attendant contribution of the stroma to the development and progression of prostate cancer are not due to frequent or recurrent genomic alterations in the TME.
©2016 American Association for Cancer Research.
Conflict of interest statement
Figures

 ) from the same tumor region before (E) and after (F) LCM. (G–H), Patient-matched benign epithelium (G) and stromal (H) areas microdissected from regions away from the tumor or from other tissue blocks (preferentially). Delineated areas in black and marked (+) are the benign epithelium and stromal adjacent to benign epithelium areas, immediately after LCM but before lifting the cap from the whole tissue section.


References
Publication types
MeSH terms
Substances
Grants and funding
- U01CA164188/CA/NCI NIH HHS/United States
- U54CA126540/CA/NCI NIH HHS/United States
- P30 CA015704/CA/NCI NIH HHS/United States
- P50 CA097186/CA/NCI NIH HHS/United States
- CA097186/CA/NCI NIH HHS/United States
- U01 CA164188/CA/NCI NIH HHS/United States
- P30CA125123/CA/NCI NIH HHS/United States
- P30CA015704-40/CA/NCI NIH HHS/United States
- P30 CA125123/CA/NCI NIH HHS/United States
- R01CA165573/CA/NCI NIH HHS/United States
- R01 CA165573/CA/NCI NIH HHS/United States
- U54 CA126540/CA/NCI NIH HHS/United States
- R01 CA108646/CA/NCI NIH HHS/United States
- I01 BX001040/BX/BLRD VA/United States
LinkOut - more resources
Full Text Sources
Other Literature Sources
Medical
Molecular Biology Databases
Research Materials
Miscellaneous

