

Understanding the effects of different HIV transmission models in individual-based microsimulation of HIV epidemic dynamics in people who inject drugs
- PMID: 26753627
- PMCID: PMC5322479
- DOI: 10.1017/S0950268815003180
Understanding the effects of different HIV transmission models in individual-based microsimulation of HIV epidemic dynamics in people who inject drugs
Abstract
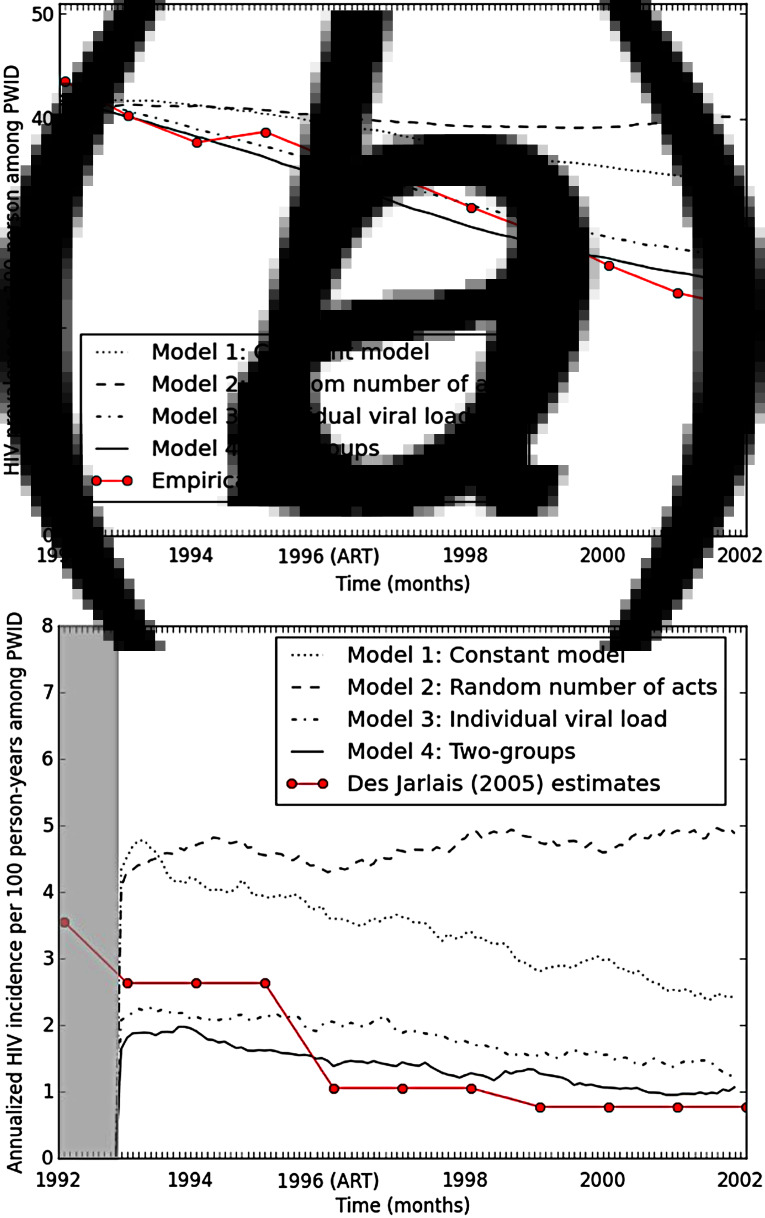
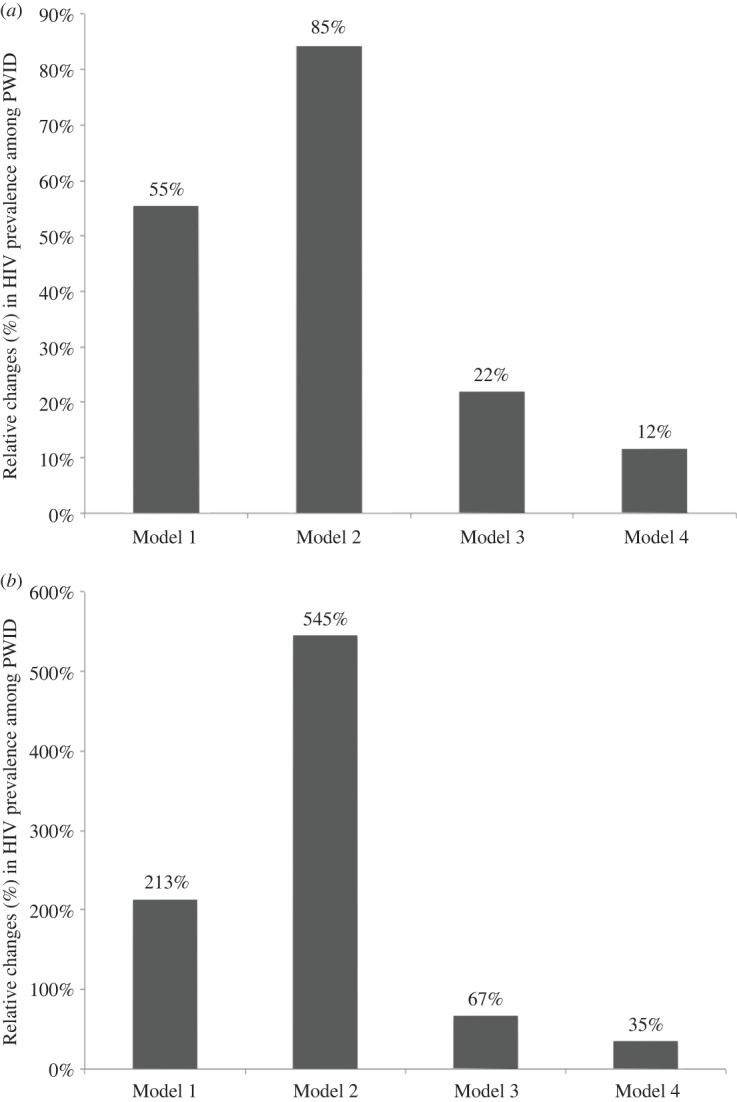
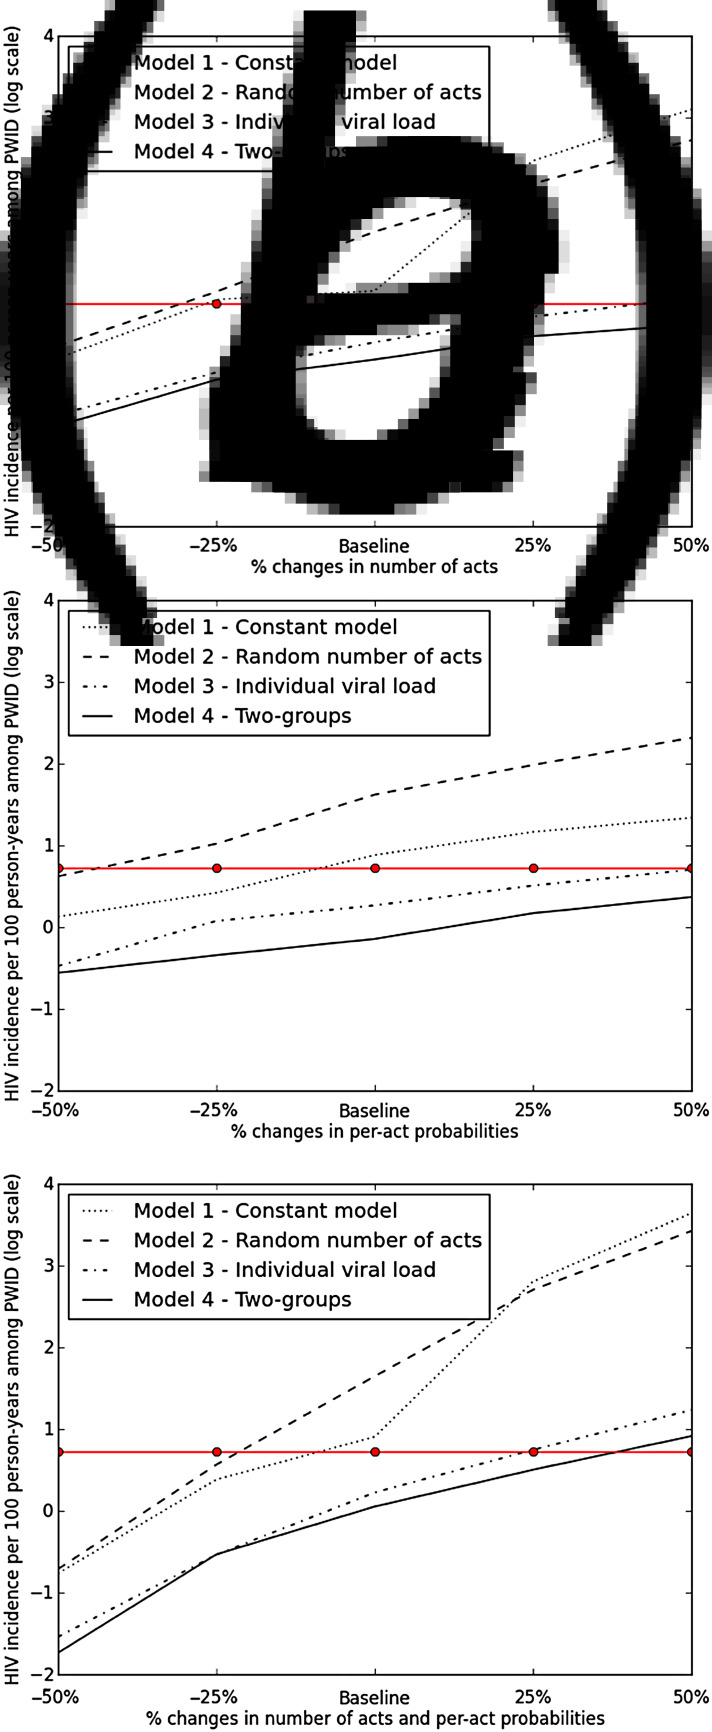
We investigated how different models of HIV transmission, and assumptions regarding the distribution of unprotected sex and syringe-sharing events ('risk acts'), affect quantitative understanding of HIV transmission process in people who inject drugs (PWID). The individual-based model simulated HIV transmission in a dynamic sexual and injecting network representing New York City. We constructed four HIV transmission models: model 1, constant probabilities; model 2, random number of sexual and parenteral acts; model 3, viral load individual assigned; and model 4, two groups of partnerships (low and high risk). Overall, models with less heterogeneity were more sensitive to changes in numbers risk acts, producing HIV incidence up to four times higher than that empirically observed. Although all models overestimated HIV incidence, micro-simulations with greater heterogeneity in the HIV transmission modelling process produced more robust results and better reproduced empirical epidemic dynamics.
Keywords: Condom use; HIV; Monte Carlo simulation; individual-based model.
Figures
Similar articles
-
Acute HIV infection transmission among people who inject drugs in a mature epidemic setting.AIDS. 2016 Oct 23;30(16):2537-2544. doi: 10.1097/QAD.0000000000001218. AIDS. 2016. PMID: 27490641 Free PMC article.
-
The risk of HIV transmission at each step of the HIV care continuum among people who inject drugs: a modeling study.BMC Public Health. 2017 Jul 25;17(1):614. doi: 10.1186/s12889-017-4528-9. BMC Public Health. 2017. PMID: 28738861 Free PMC article.
-
Characteristics of HIV epidemics driven by men who have sex with men and people who inject drugs.Curr Opin HIV AIDS. 2011 Mar;6(2):94-101. doi: 10.1097/COH.0b013e328343ad93. Curr Opin HIV AIDS. 2011. PMID: 21505382 Review.
-
Male-to-male sex among men who inject drugs in Delhi, India: overlapping HIV risk behaviours.Int J Drug Policy. 2015 Apr;26(4):404-11. doi: 10.1016/j.drugpo.2014.08.007. Epub 2014 Aug 24. Int J Drug Policy. 2015. PMID: 25440911
-
Key harm reduction interventions and their impact on the reduction of risky behavior and HIV incidence among people who inject drugs in low-income and middle-income countries.Curr Opin HIV AIDS. 2012 Jul;7(4):362-8. doi: 10.1097/COH.0b013e328354a0b5. Curr Opin HIV AIDS. 2012. PMID: 22647588 Review.
Cited by
-
Introducing CASCADEPOP: an open-source sociodemographic simulation platform for us health policy appraisal.Int J Microsimul. 2020 Summer;13(2):21-60. doi: 10.34196/ijm.00217. Int J Microsimul. 2020. PMID: 33884027 Free PMC article.
-
Predicting the Effectiveness of Endemic Infectious Disease Control Interventions: The Impact of Mass Action versus Network Model Structure.Med Decis Making. 2021 Aug;41(6):623-640. doi: 10.1177/0272989X211006025. Epub 2021 Apr 24. Med Decis Making. 2021. PMID: 33899563 Free PMC article.
-
Structural Sensitivity in HIV Modeling: A Case Study of Vaccination.Infect Dis Model. 2017 Nov;2(4):399-411. doi: 10.1016/j.idm.2017.08.002. Epub 2017 Nov 11. Infect Dis Model. 2017. PMID: 29532039 Free PMC article.
-
Extent and implications of omitted ties on network measures in a longitudinal social network survey of people who use drugs.Drug Alcohol Depend. 2022 Sep 1;238:109554. doi: 10.1016/j.drugalcdep.2022.109554. Epub 2022 Jul 4. Drug Alcohol Depend. 2022. PMID: 35850026 Free PMC article.
-
The role of depression in secondary HIV transmission among people who inject drugs in Vietnam: A mathematical modeling analysis.PLoS One. 2022 Oct 14;17(10):e0275995. doi: 10.1371/journal.pone.0275995. eCollection 2022. PLoS One. 2022. PMID: 36240142 Free PMC article.
References
-
- Kaplan EH. Modeling HIV infectivity: must sex acts be counted? Journal of Acquired Immune Deficiency Syndromes 1990; 3: 55–61. - PubMed
-
- Greenhalgh D, Lewis F. The general mixing of addicts and needles in a variable-infectivity needle-sharing environment. Journal of Mathematical Biology 2002; 44: 561–598. - PubMed
-
- Blower SM, Boe C. Sex acts, sex partners, and sex budgets: implications for risk factor analysis and estimation of HIV transmission probabilities. Journal of Acquired Immune Deficiency Syndromes 1993; 6: 1347–1352. - PubMed
-
- Garnett GP, Anderson RM. Strategies for limiting the spread of HIV in developing countries: Conclusions based on studies of the transmission dynamics of the virus. Journal of Acquired Immune Deficiency Syndromes and Human Retrovirology 1995; 9: 500–513. - PubMed
-
- Jewell NP, Shiboski SC. Statistical analysis of HIV infectivity based on partner studies. Biometrics 1990; 46: 1133–1150. - PubMed
Publication types
MeSH terms
Grants and funding
LinkOut - more resources
Full Text Sources
Other Literature Sources
Medical
