

An MRI-defined measure of cerebral lesion severity to assess therapeutic effects in multiple sclerosis
- PMID: 26754005
- PMCID: PMC4785194
- DOI: 10.1007/s00415-015-8009-8
An MRI-defined measure of cerebral lesion severity to assess therapeutic effects in multiple sclerosis
Abstract
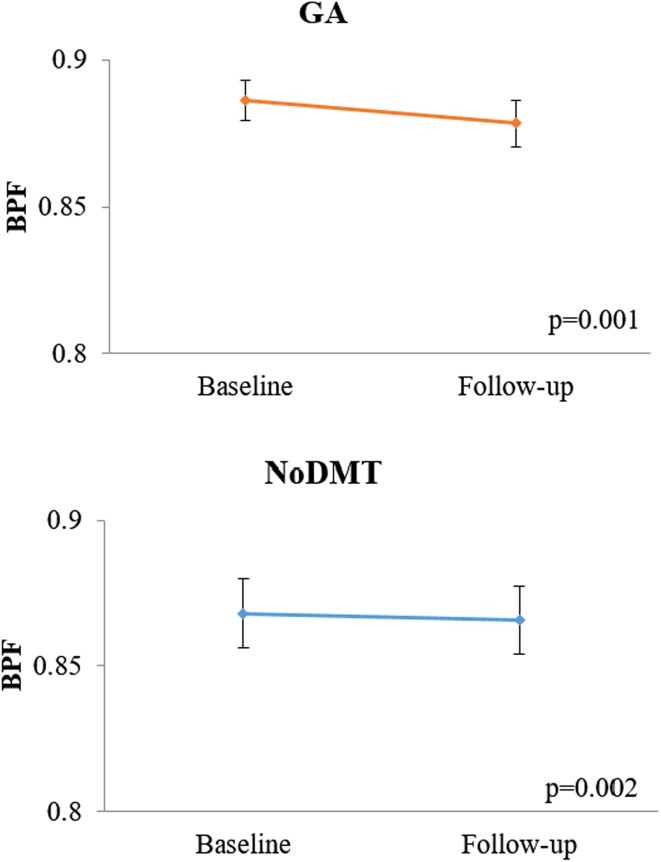
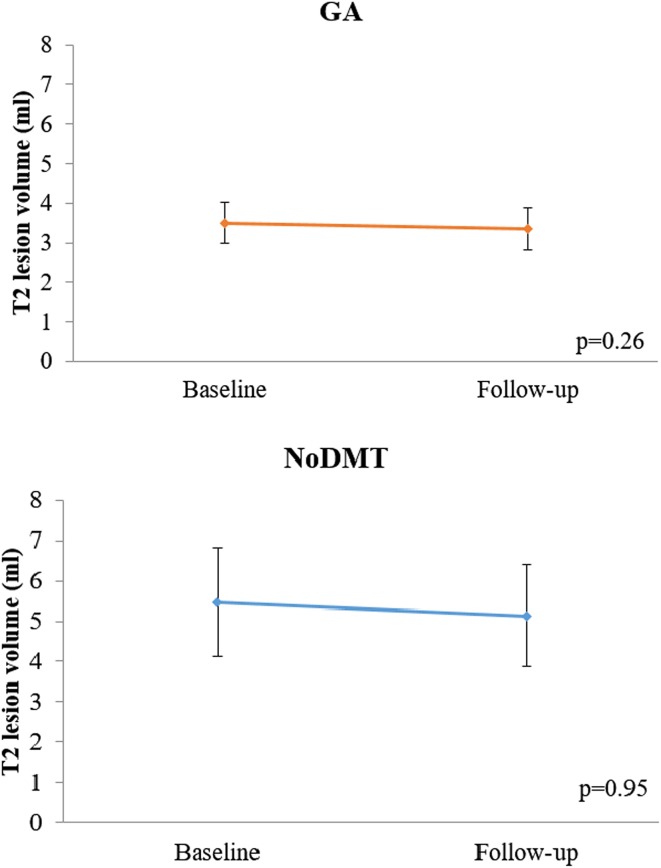
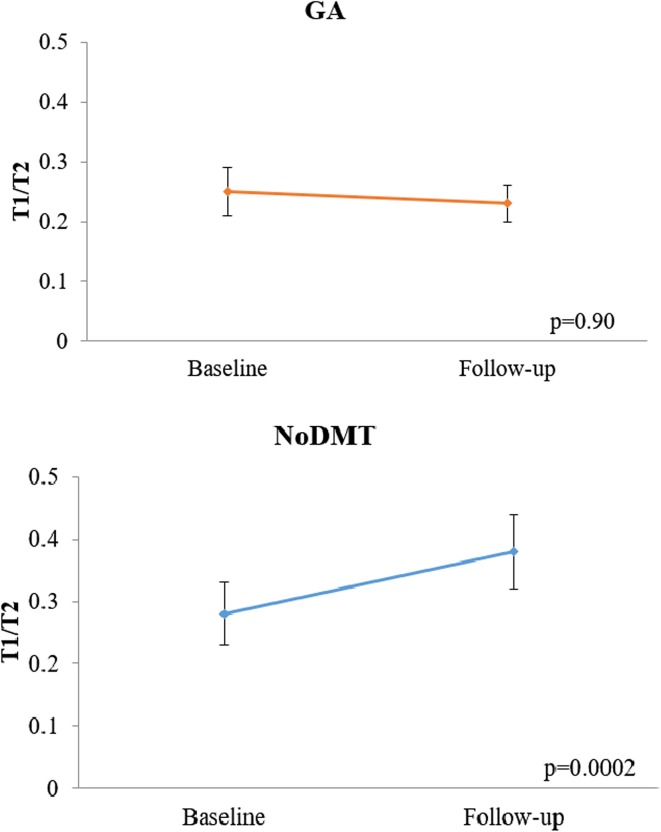
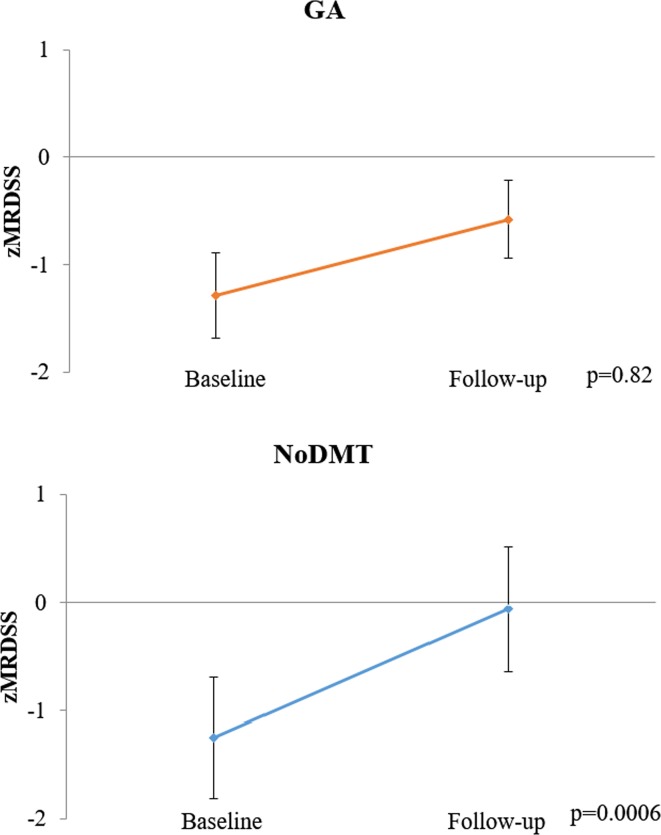
Assess the sensitivity of the Magnetic Resonance Disease Severity Scale (MRDSS), based on cerebral lesions and atrophy, for treatment monitoring of glatiramer acetate (GA) in relapsing-remitting multiple sclerosis (MS). This retrospective non-randomized pilot study included patients who started daily GA [n = 23, age (median, range) 41 (26.2, 53.1) years, Expanded Disability Status Scale (EDSS) score 1.0 (0, 3.5)], or received no disease-modifying therapy (noDMT) [n = 21, age 44.8 (28.2, 55.4), EDSS 0 (0, 2.5)] for 2 years. MRDSS was the sum of z-scores (normalized to a reference sample) of T2 hyperintense lesion volume (T2LV), the ratio of T1 hypointense LV to T2LV (T1/T2), and brain parenchymal fraction (BPF) multiplied by negative 1. The two groups were compared by Wilcoxon rank sum tests; within group change was assessed by Wilcoxon signed rank tests. Glatiramer acetate subjects had less progression than noDMT on T1/T2 [(median z-score change (range), 0 (-1.07, 1.20) vs. 0.41 (-0.30, 2.51), p = 0.003)] and MRDSS [0.01 (-1.33, 1.28) vs. 0.46 (-1.57, 2.46), p = 0.01]; however, not on BPF [0.12 (-0.18, 0.58) vs. 0.10 (-1.47,0.50), p = 0.59] and T2LV [-0.03 (-0.90, 0.57) vs. 0.01 (-1.69, 0.34), p = 0.40]. While GA subjects worsened only on BPF [0.12 (-0.18, 0.58), p = 0.001], noDMT worsened on BPF [0.10 (-1.47, 0.50), p = 0.002], T1/T2 [0.41 (-0.30, 2.51), p = 0.0002], and MRDSS [0.46 (-1.57, 2.46), p = 0.0006]. These preliminary findings show the potential of two new cerebral MRI metrics to track MS therapeutic response. The T1/T2, an index of the destructive potential of lesions, may provide particular sensitivity to treatment effects.
Keywords: Brain atrophy; Composite scale; Glatiramer acetate; MRI; Multiple sclerosis.
Figures
Similar articles
-
Exploring the effect of glatiramer acetate on cerebral gray matter atrophy in multiple sclerosis.J Neurol Sci. 2023 Jan 15;444:120501. doi: 10.1016/j.jns.2022.120501. Epub 2022 Nov 18. J Neurol Sci. 2023. PMID: 36481574
-
Predicting clinical progression in multiple sclerosis with the magnetic resonance disease severity scale.Arch Neurol. 2008 Nov;65(11):1449-53. doi: 10.1001/archneur.65.11.1449. Arch Neurol. 2008. PMID: 19001162 Free PMC article.
-
Quantitative MRI analysis of cerebral lesions and atrophy in post-partum patients with multiple sclerosis.J Neurol Sci. 2018 Sep 15;392:94-99. doi: 10.1016/j.jns.2018.06.025. Epub 2018 Jun 30. J Neurol Sci. 2018. PMID: 30031994
-
Management of worsening multiple sclerosis with mitoxantrone: a review.Clin Ther. 2006 Apr;28(4):461-74. doi: 10.1016/j.clinthera.2006.04.013. Clin Ther. 2006. PMID: 16750460 Review.
-
Two decades of glatiramer acetate: From initial discovery to the current development of generics.J Neurol Sci. 2017 May 15;376:255-259. doi: 10.1016/j.jns.2017.03.030. Epub 2017 Mar 21. J Neurol Sci. 2017. PMID: 28431621 Review.
Cited by
-
Brain MRI Predicts Worsening Multiple Sclerosis Disability over 5 Years in the SUMMIT Study.J Neuroimaging. 2020 Mar;30(2):212-218. doi: 10.1111/jon.12688. Epub 2020 Jan 29. J Neuroimaging. 2020. PMID: 31994814 Free PMC article.
-
The Contribution of Cortical Lesions to a Composite MRI Scale of Disease Severity in Multiple Sclerosis.Front Neurol. 2016 Jun 29;7:99. doi: 10.3389/fneur.2016.00099. eCollection 2016. Front Neurol. 2016. PMID: 27445966 Free PMC article.
-
A dual modeling approach to automatic segmentation of cerebral T2 hyperintensities and T1 black holes in multiple sclerosis.Neuroimage Clin. 2018;20:1211-1221. doi: 10.1016/j.nicl.2018.10.013. Epub 2018 Oct 16. Neuroimage Clin. 2018. PMID: 30391859 Free PMC article.
-
Neuroimaging markers and disability scales in multiple sclerosis: A systematic review and meta-analysis.PLoS One. 2024 Dec 5;19(12):e0312421. doi: 10.1371/journal.pone.0312421. eCollection 2024. PLoS One. 2024. PMID: 39637162 Free PMC article.
-
Association Between Serum MicroRNAs and Magnetic Resonance Imaging Measures of Multiple Sclerosis Severity.JAMA Neurol. 2017 Mar 1;74(3):275-285. doi: 10.1001/jamaneurol.2016.5197. JAMA Neurol. 2017. PMID: 28114622 Free PMC article.
References
Publication types
MeSH terms
Substances
LinkOut - more resources
Full Text Sources
Other Literature Sources
Medical
