

Streptomycin treatment alters the intestinal microbiome, pulmonary T cell profile and airway hyperresponsiveness in a cystic fibrosis mouse model
- PMID: 26754178
- PMCID: PMC4709690
- DOI: 10.1038/srep19189
Streptomycin treatment alters the intestinal microbiome, pulmonary T cell profile and airway hyperresponsiveness in a cystic fibrosis mouse model
Abstract
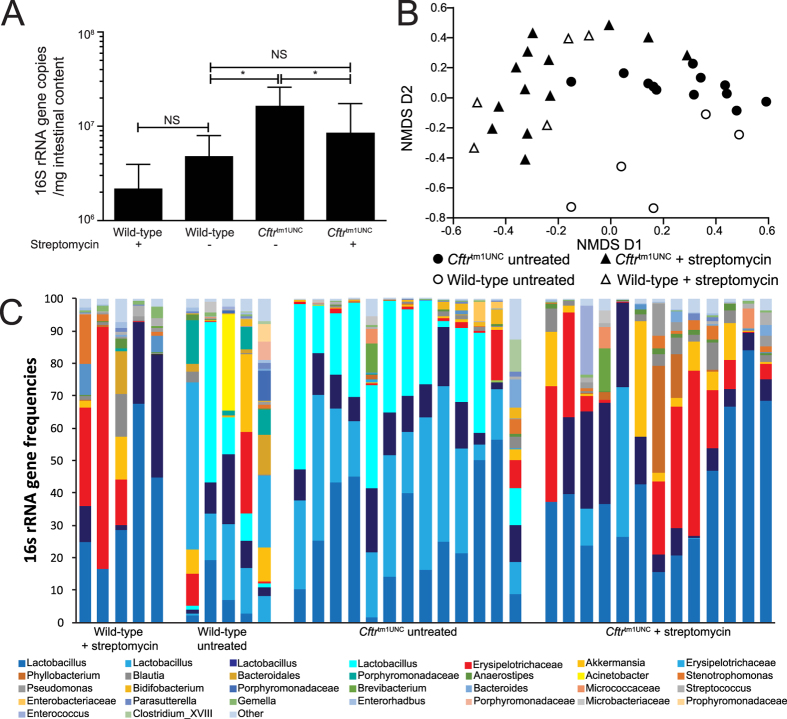
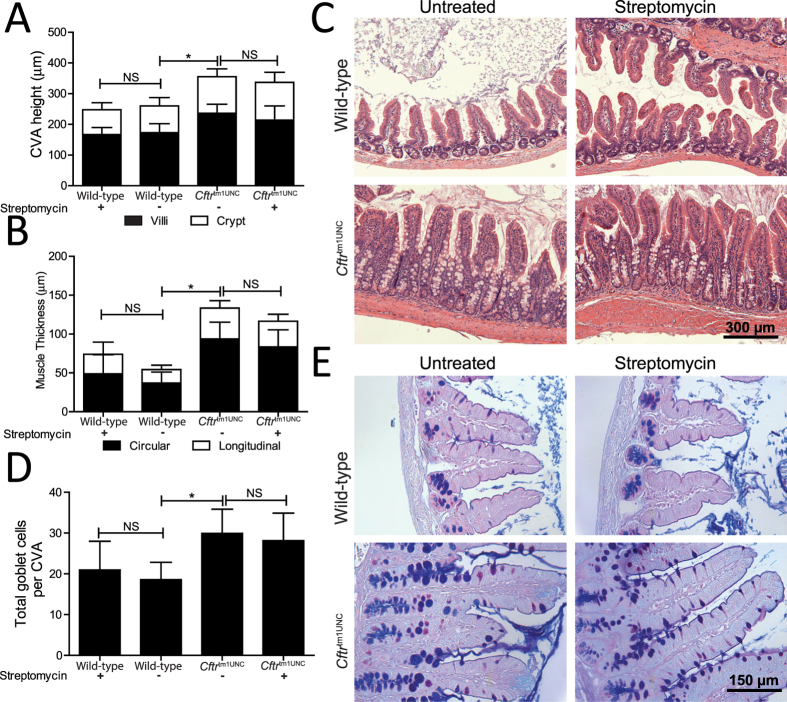
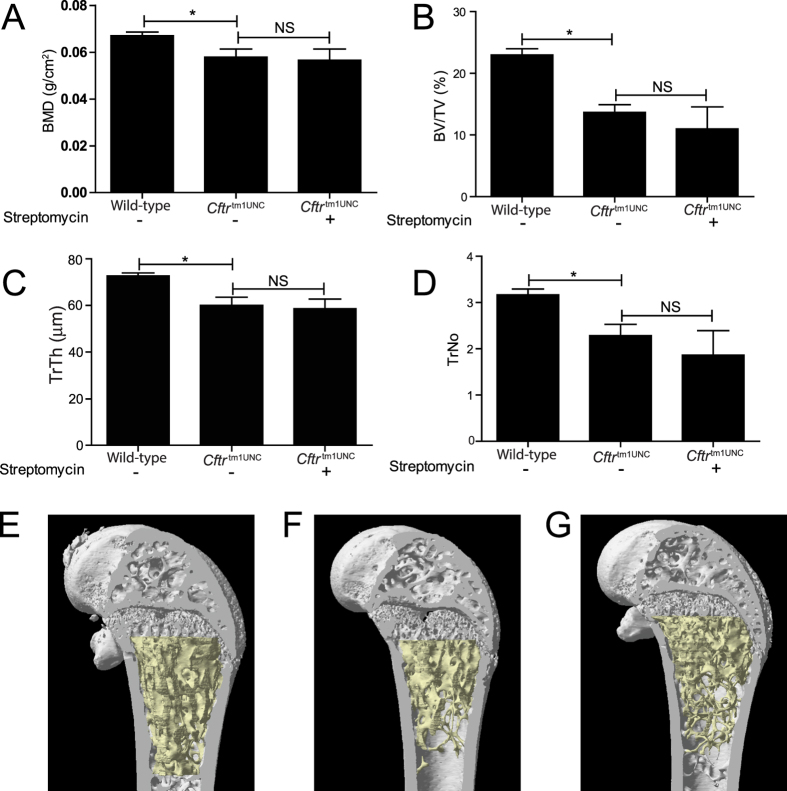
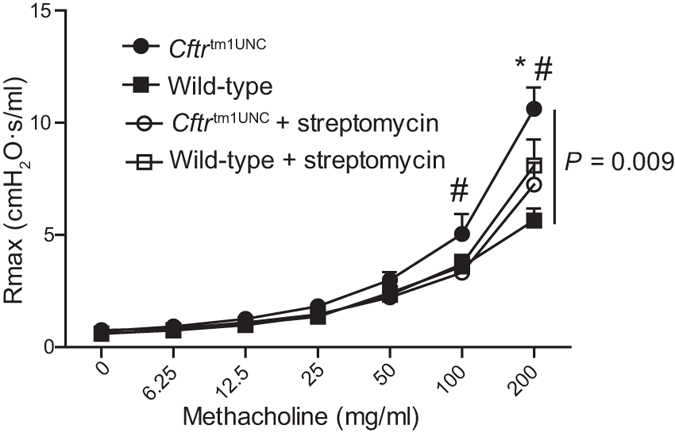
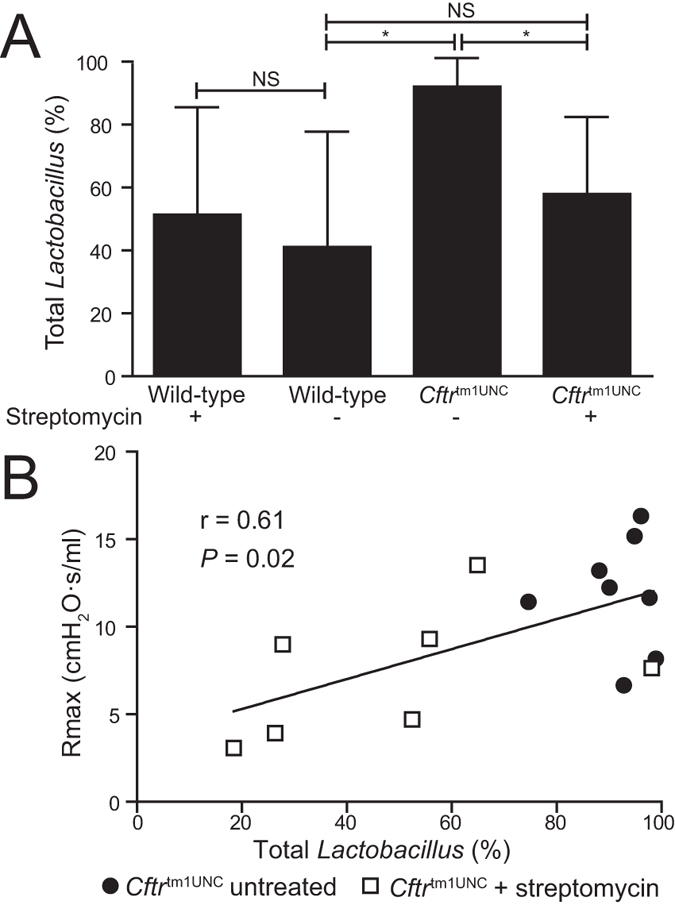
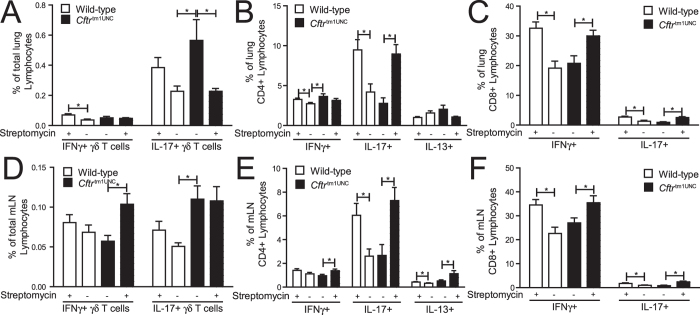
Cystic fibrosis transmembrane conductance regulator deficient mouse models develop phenotypes of relevance to clinical cystic fibrosis (CF) including airway hyperresponsiveness, small intestinal bacterial overgrowth and an altered intestinal microbiome. As dysbiosis of the intestinal microbiota has been recognized as an important contributor to many systemic diseases, herein we investigated whether altering the intestinal microbiome of BALB/c Cftr(tm1UNC) mice and wild-type littermates, through treatment with the antibiotic streptomycin, affects the CF lung, intestinal and bone disease. We demonstrate that streptomycin treatment reduced the intestinal bacterial overgrowth in Cftr(tm1UNC) mice and altered the intestinal microbiome similarly in Cftr(tm1UNC) and wild-type mice, principally by affecting Lactobacillus levels. Airway hyperresponsiveness of Cftr(tm1UNC) mice was ameliorated with streptomycin, and correlated with Lactobacillus abundance in the intestine. Additionally, streptomycin treated Cftr(tm1UNC) and wild-type mice displayed an increased percentage of pulmonary and mesenteric lymph node Th17, CD8 + IL-17+ and CD8 + IFNγ+ lymphocytes, while the CF-specific increase in respiratory IL-17 producing γδ T cells was decreased in streptomycin treated Cftr(tm1UNC) mice. Bone disease and intestinal phenotypes were not affected by streptomycin treatment. The airway hyperresponsiveness and lymphocyte profile of BALB/c Cftr(tm1UNC) mice were affected by streptomycin treatment, revealing a potential intestinal microbiome influence on lung response in BALB/c Cftr(tm1UNC) mice.
Figures
Similar articles
-
Cystic fibrosis mouse model-dependent intestinal structure and gut microbiome.Mamm Genome. 2015 Jun;26(5-6):222-34. doi: 10.1007/s00335-015-9560-4. Epub 2015 Feb 27. Mamm Genome. 2015. PMID: 25721416 Free PMC article.
-
Strain-dependent airway hyperresponsiveness and a chromosome 7 locus of elevated lymphocyte numbers in cystic fibrosis transmembrane conductance regulator-deficient mice.J Immunol. 2012 Mar 1;188(5):2297-304. doi: 10.4049/jimmunol.1102425. Epub 2012 Jan 27. J Immunol. 2012. PMID: 22287709
-
Toll-like receptor-4 genotype influences the survival of cystic fibrosis mice.Am J Physiol Gastrointest Liver Physiol. 2010 Aug;299(2):G381-90. doi: 10.1152/ajpgi.00003.2010. Epub 2010 Jun 3. Am J Physiol Gastrointest Liver Physiol. 2010. PMID: 20522639
-
The Intestinal Microbiome and Cystic Fibrosis Transmembrane Conductance Regulator Modulators: Emerging Themes in the Management of Gastrointestinal Manifestations of Cystic Fibrosis.Curr Gastroenterol Rep. 2021 Aug 27;23(10):17. doi: 10.1007/s11894-021-00817-2. Curr Gastroenterol Rep. 2021. PMID: 34448955 Review.
-
The Microbiome in Cystic Fibrosis Pulmonary Disease.Genes (Basel). 2020 May 11;11(5):536. doi: 10.3390/genes11050536. Genes (Basel). 2020. PMID: 32403302 Free PMC article. Review.
Cited by
-
Impact of Altered Gut Microbiota and Its Metabolites in Cystic Fibrosis.Metabolites. 2021 Feb 22;11(2):123. doi: 10.3390/metabo11020123. Metabolites. 2021. PMID: 33671639 Free PMC article. Review.
-
The Gut Microbiota and Respiratory Diseases: New Evidence.J Immunol Res. 2020 Jul 31;2020:2340670. doi: 10.1155/2020/2340670. eCollection 2020. J Immunol Res. 2020. PMID: 32802893 Free PMC article. Review.
-
Microbiome effects on immunity, health and disease in the lung.Clin Transl Immunology. 2017 Mar 10;6(3):e133. doi: 10.1038/cti.2017.6. eCollection 2017 Mar. Clin Transl Immunology. 2017. PMID: 28435675 Free PMC article. Review.
-
Night shift work and the risk of metabolic syndrome: Findings from an 8-year hospital cohort.PLoS One. 2021 Dec 13;16(12):e0261349. doi: 10.1371/journal.pone.0261349. eCollection 2021. PLoS One. 2021. PMID: 34898652 Free PMC article.
-
Exploring the impact of intestinal ion transport on the gut microbiota.Comput Struct Biotechnol J. 2020 Dec 16;19:134-144. doi: 10.1016/j.csbj.2020.12.008. eCollection 2021. Comput Struct Biotechnol J. 2020. PMID: 33425246 Free PMC article. Review.
References
-
- O’Sullivan B. P. & Freedman S. D. Cystic fibrosis. Lancet 373, 1891–1904, (2009). - PubMed
-
- Kent B. D. et al. Asthma and cystic fibrosis: a tangled web. Pediatr. Pulmonol. 49, 205–213, (2014). - PubMed
-
- Mitchell I., Corey M., Woenne R., Krastins I. R. & Levison H. Bronchial hyperreactivity in cystic fibrosis and asthma. J. Pediatr. 93, 744–748, (1978). - PubMed
Publication types
MeSH terms
Substances
LinkOut - more resources
Full Text Sources
Other Literature Sources
Medical
Molecular Biology Databases
Research Materials
