. 2016 Jan 12:14:9.
doi: 10.1186/s12967-016-0763-6.

Discrimination of cirrhotic nodules, dysplastic lesions and hepatocellular carcinoma by their vibrational signature

Affiliations

Discrimination of cirrhotic nodules, dysplastic lesions and hepatocellular carcinoma by their vibrational signature

Chengyuan Peng et al. J Transl Med. .

Abstract

Background: Hepatocarcinogenesis is a multistep process characterized in patients with chronic liver diseases by a spectrum of hepatic nodules that mark the progression from regenerative nodules to dysplastic lesions followed by hepatocellular carcinoma (HCC). The differential diagnosis between precancerous dysplastic nodules and early HCC still represents a challenge for both radiologists and pathologists. We addressed the potential of Fourier transform-infrared (FTIR) microspectroscopy for grading cirrhotic nodules on frozen tissue sections.

Methods: The study was focused on 39 surgical specimens including normal livers (n = 11), dysplastic nodules (n = 6), early HCC (n = 1), progressed HCC on alcoholic cirrhosis (n = 10) or hepatitis C virus cirrhosis (n = 11). The use of the bright infrared source emitted by the synchrotron radiation allowed investigating the biochemical composition at the cellular level. Chemical mapping on whole tissue sections was further performed using a FTIR microscope equipped with a laboratory-based infrared source. The variance was addressed by principal component analysis.

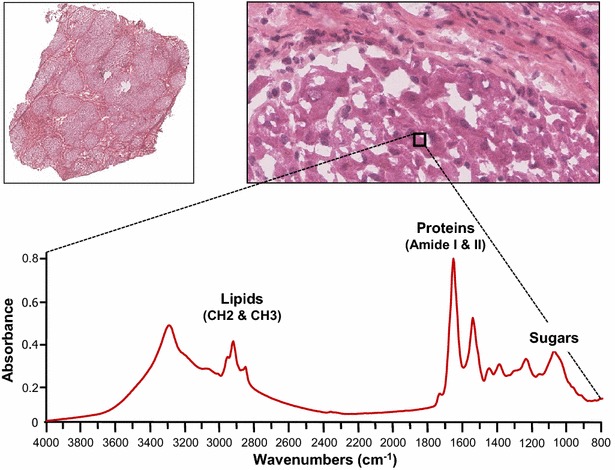
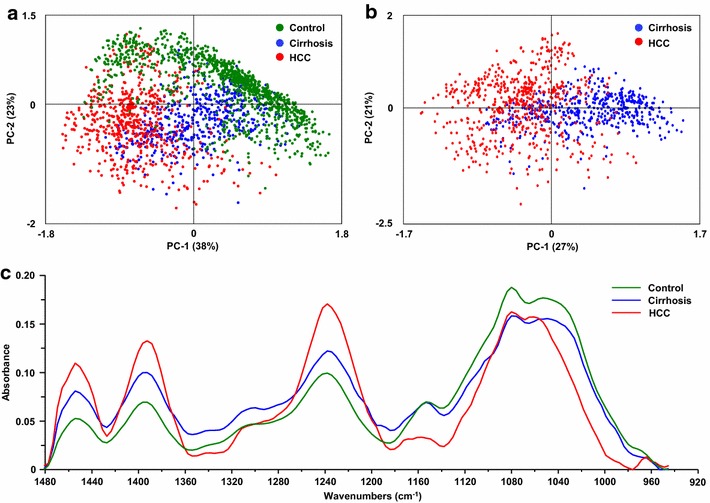
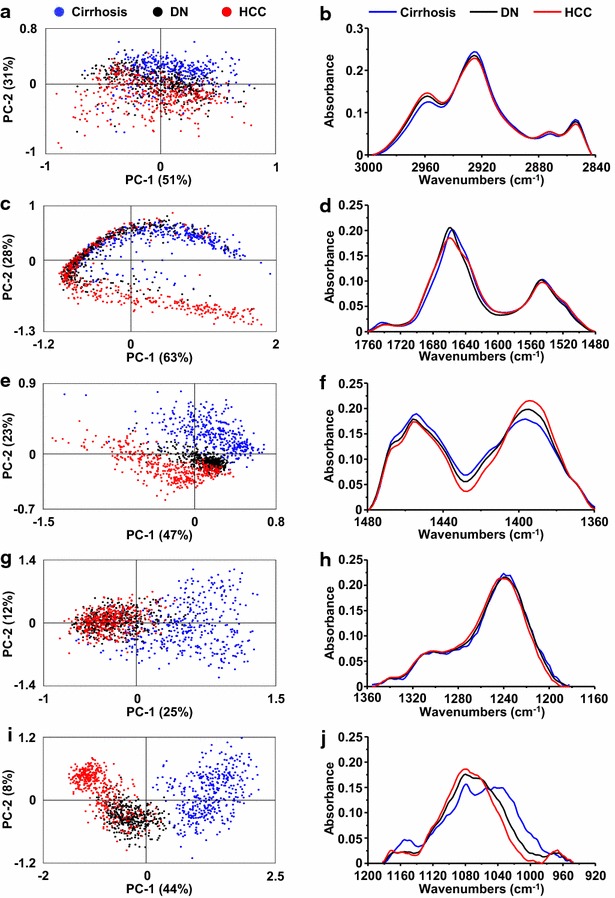
Results: Profound alterations of the biochemical composition of the pathological liver were demonstrated by FTIR microspectroscopy. Indeed, dramatic changes were observed in lipids, proteins and sugars highlighting the metabolic reprogramming in carcinogenesis. Quantifiable spectral markers were characterized by calculating ratios of areas under specific bands along the infrared spectrum. These markers allowed the discrimination of cirrhotic nodules, dysplastic lesions and HCC. Finally, the spectral markers can be measured using a laboratory FTIR microscope that may be easily implemented at the hospital.

Conclusion: Metabolic reprogramming in liver carcinogenesis can constitute a signature easily detectable using FTIR microspectroscopy for the diagnosis of precancerous and cancerous lesions.


Figures

Fig. 1
Fig. 1
SR-FTIR analysis on cirrhotic liver. Tissue sections of 5 µm thickness were performed from cirrhosis and stained with HES (hematoxylin, eosin and safran). Cirrhosis exhibiting nodules surrounded by fibrosis are shown at ×40 magnification (upper left). Synchrotron-FTIR was performed on tissue section of cirrhosis at the resolution 10 µm × 10 µm (black square on upper right). The infrared spectrum is shown
Fig. 2
Fig. 2
Spectroscopic and statistical analysis on lipids. Spectra were acquired using SR-FTIR on normal livers as controls (n = 5), cirrhosis and their corresponding HCC (n = 3). All spectra were baseline corrected within the 3000–2840 cm−1 region. Principal component analysis (PCA) was performed on spectra from a normal livers, cirrhosis and HCC or b only from cirrhosis and HCC. The score plot based on PC1 and PC2 is shown where each point represents one spectrum. c The average spectra corresponding to normal liver, cirrhosis and HCC tissues were extracted. d The ratio of two main peak areas corresponding to C–H asymmetric stretch of CH2/CH3 within each group of tissue was calculated and plotted as boxplot. Unpaired Student t test was applied between control and cirrhosis/HCC. *: unpaired t test, p < 0.05
Fig. 3
Fig. 3
Spectroscopic and statistical analysis on proteins. Spectra were acquired using SR-FTIR on normal livers as controls (n = 5), cirrhosis and their corresponding HCC (n = 3). All spectra were baseline corrected within the 1760–1480 cm−1 region. Principal component analysis (PCA) was performed on spectra from a normal livers, cirrhosis and HCC or b only from cirrhosis and HCC. The score plot based on PC1 and PC2 is shown where each point represents one spectrum. c The average spectra corresponding to normal liver, cirrhosis and HCC tissues were extracted. d The ratio of two areas of Amide I band was calculated and plotted as boxplot highlighting the Amide I peak position shifts within each group. Unpaired Student t test was applied between control and cirrhosis/HCC. *: unpaired t test, p < 0.05
Fig. 4
Fig. 4
Spectroscopic and statistical analysis on the fingerprinting region. Spectra were acquired using SR-FTIR on normal livers as controls (n = 5), cirrhosis and their HCC (n = 3). All spectra were baseline corrected within the 1480–950 cm−1 region. Principal component analysis (PCA) was performed on spectra from a normal liver, cirrhosis and HCC or b only from cirrhosis and HCC. The score plot based on PC1 and PC2 is shown where each point represents one spectrum. c The average spectra corresponding to normal liver, cirrhosis and HCC tissues were extracted and superimposed
Fig. 5
Fig. 5
Spectroscopic and statistical analysis on a patient exhibiting hyperplastic nodules, dysplastic lesions and hepatocellular carcinoma. Spectra were acquired using SR-FTIR on frozen tissue sections from the patient #37 and principal component analysis (PCA) was performed on the frequency domains a 3000–2840 cm−1, c 1760–1480 cm−1, e 1480–1360 cm−1, g 1360–1180 cm−1 and i 1180–950 cm−1. The average spectra corresponding to cirrhotic, dysplastic (DN) and tumor nodules (HCC) were extracted and superimposed (b, d, f, h, j)
Fig. 6
Fig. 6
FTIR microspectroscopy on tissue section from cirrhosis and hepatocellular carcinoma. a Mosaic optical image on cirrhosis from patient #37. The small area probed with SR-FTIR (red rectangle) has been magnified several times (b) to investigate chemical composition at high spatial resolution (c). d, e Chemical images obtained mapping whole specimen with globar-FTIR. Contour plots represent the quantitative 2D distribution of collagen (d) and lipids (e) obtained integrating IR signals within the 1300–1200 cm−1 and the 3000–2800 cm−1 spectral domains, respectively (blue low; red high). f, h PC score plots (each point represents one spectrum) and g, i the corresponding average spectra in samples probed with SR-FTIR (f, g) and globar-FTIR (h, i), respectively
Fig. 7
Fig. 7
Discrimination between various cirrhotic nodules using synchrotron radiation or a laboratory-based infrared source. Spectra were acquired on frozen tissue sections from the patient #37 using SR-FTIR (a, b, e, f) or using a Globar-FTIR microscope (c, d, g, h). Principal component analysis (PCA) was performed on the frequency domain 1180–950 cm−1. The score plot based on PC1 and PC2 is shown where each point represents one spectrum (a, c, e, g) and the average spectra were extracted and superimposed (b, d, f, h). DN dysplastic nodules, HCC hepatocellular carcinoma
Fig. 8
Fig. 8
Characterization of band ratios as quantifiable spectral markers. Spectra were acquired on frozen tissue sections using a laboratory microscope FTIR (iN10Mx) equipped with an internal infrared source. Analysis were performed from normal livers as controls (n = 11), a alcoholic cirrhosis with their corresponding HCC (n = 10) or b HCV cirrhosis and their corresponding HCC (n = 11) (b). Ratios of two peaks area were calculated and boxplots are shown. Statistical analysis were performed on all patients with unpaired t test (*p < 0.05) or paired t test (p < 0.05)
Fig. 9
Fig. 9
Discrimination between cirrhosis, dysplastic lesions and hepatocellular carcinoma using quantifiable spectral markers. Seven patients exhibiting benign or dysplastic nodules were investigated by FTIR microspectroscopy using a FTIR microscope equipped with an internal infrared source. For each patient, acquisitions were performed on 5 maps with about 200 spectra per map. a Boxplots of ratio calculated by two areas (1050–1010 cm−1/1180–950 cm−1), baseline of 1180–950 cm−1. b Boxplots of ratio calculated by two areas (1280–1200 cm−1/1180–950 cm−1), baseline of 1360–950 cm−1. c Boxplots of ratio calculated by two main peak areas (1410–1380 cm−1/1470–1430 cm−1), baseline of 1480–1360 cm−1. Statistical analysis was performed on each individual patient with paired t test (*p < 0.05). C cirrhosis, HG high grade dysplastic nodule, LG low grade dysplastic nodule, eHCC early hepatocellular carcinoma, P patient

Similar articles

Cited by

References

    1. El-Serag HB. Hepatocellular carcinoma. N Engl J Med. 2011;365:1118–1127. doi: 10.1056/NEJMra1001683. - DOI - PubMed
    1. Forner A, Llovet JM, Bruix J. Hepatocellular carcinoma. Lancet. 2012;379:1245–1255. doi: 10.1016/S0140-6736(11)61347-0. - DOI - PubMed
    1. International Working Party Terminology of nodular hepatocellular lesions. Hepatology. 1995;22:983–993. doi: 10.1002/hep.1840220341. - DOI - PubMed
    1. Kim SR, Ikawa H, Ando K, Mita K, Fuki S, Sakamoto M, et al. Multistep hepatocarcinogenesis from a dysplastic nodule to well-differentiated hepatocellular carcinoma in a patient with alcohol-related liver cirrhosis. World J Gastroenterol. 2007;13:1271–1274. doi: 10.3748/wjg.v13.i8.1271. - DOI - PMC - PubMed
    1. International Consensus Group for Hepatocellular Neoplasia Pathologic diagnosis of early hepatocellular carcinoma: a report of the International Consensus Group for Hepatocellular Neoplasia. Hepatology. 2009;49:658–664. doi: 10.1002/hep.22709. - DOI - PubMed

Publication types