. 2016 Jan 12:7:10318.
doi: 10.1038/ncomms10318.

Identification of p62/SQSTM1 as a component of non-canonical Wnt VANGL2-JNK signalling in breast cancer

Affiliations

Identification of p62/SQSTM1 as a component of non-canonical Wnt VANGL2-JNK signalling in breast cancer

Tania M Puvirajesinghe et al. Nat Commun. .

Abstract

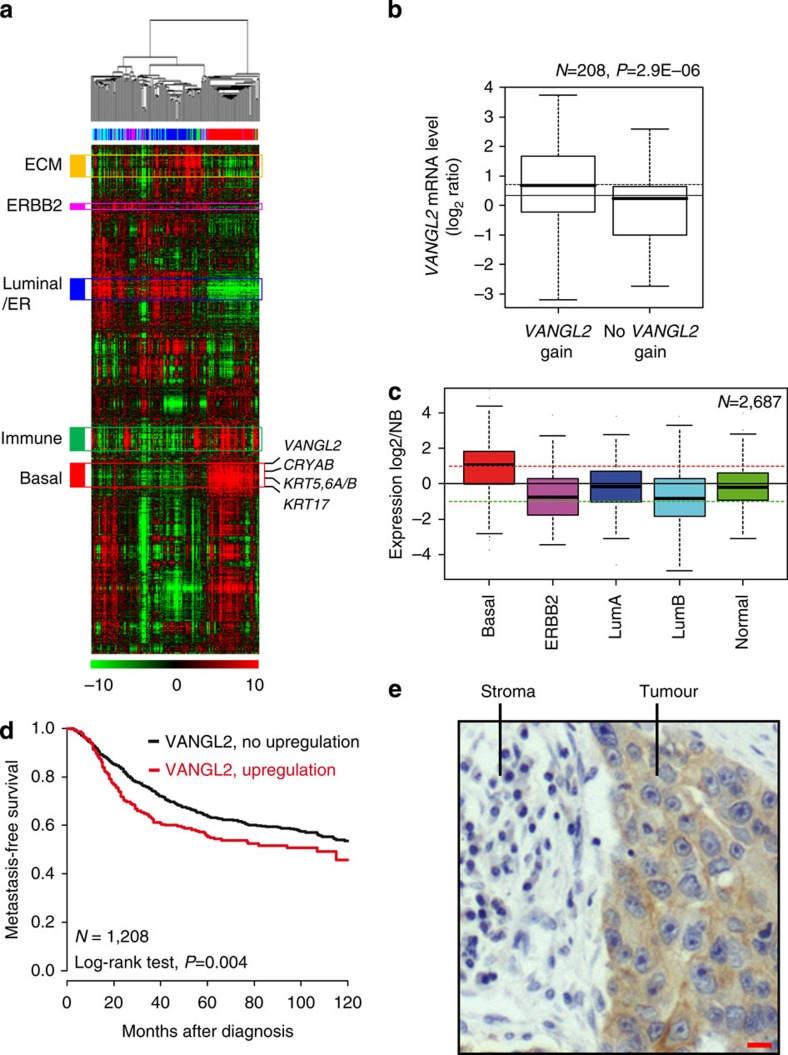
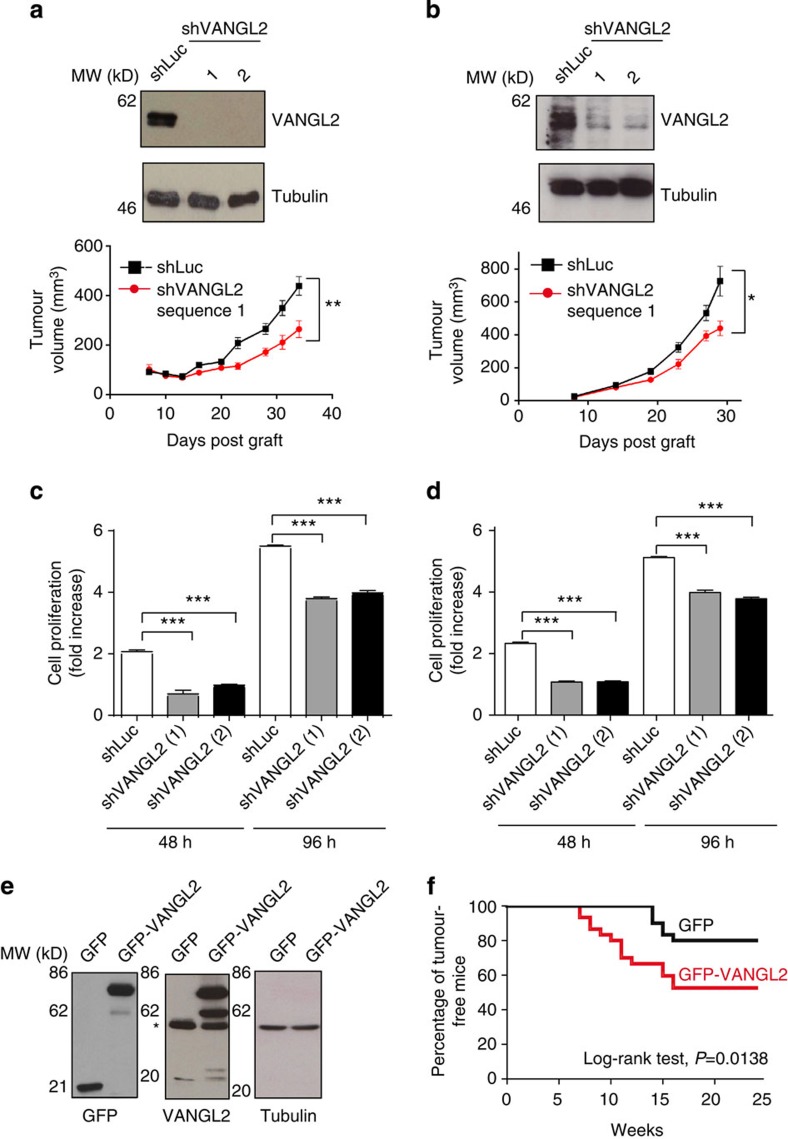
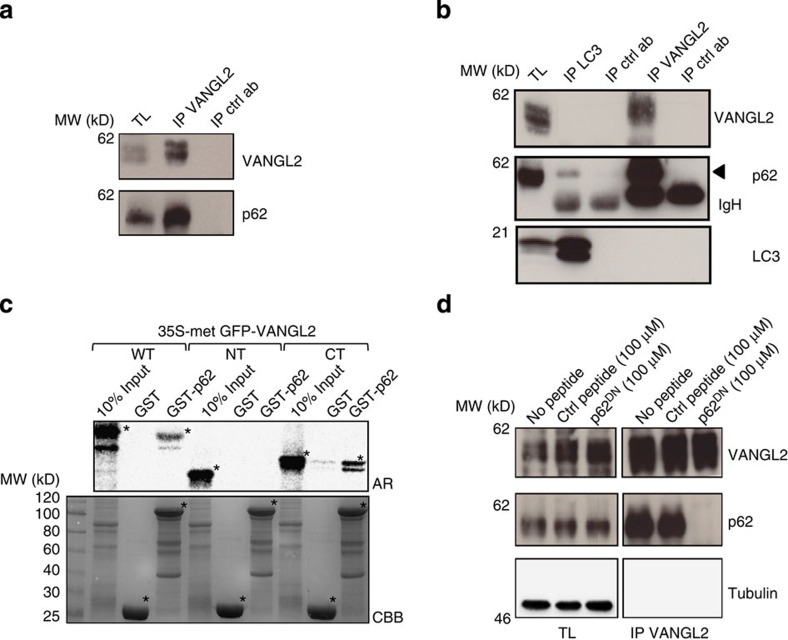
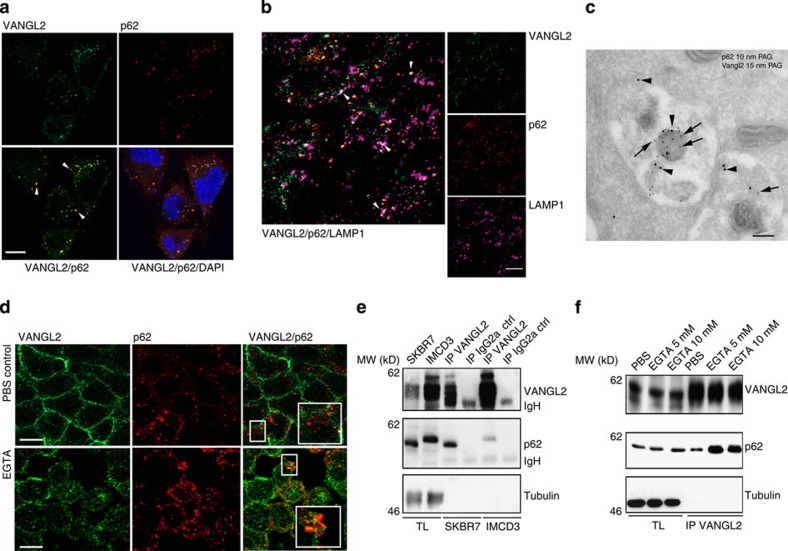
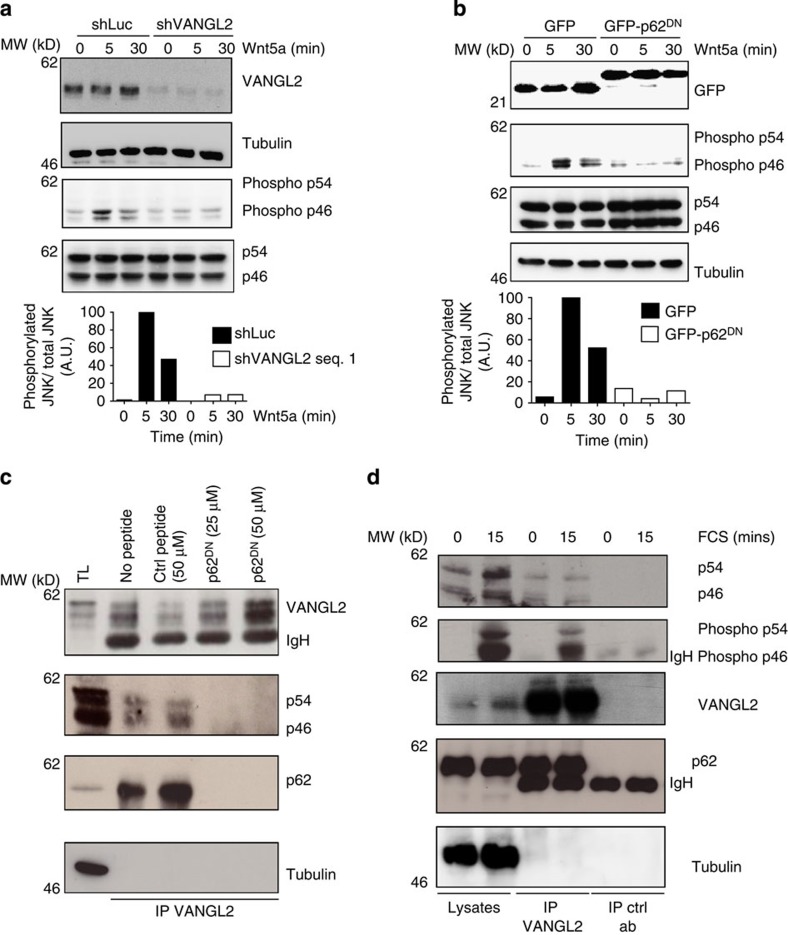
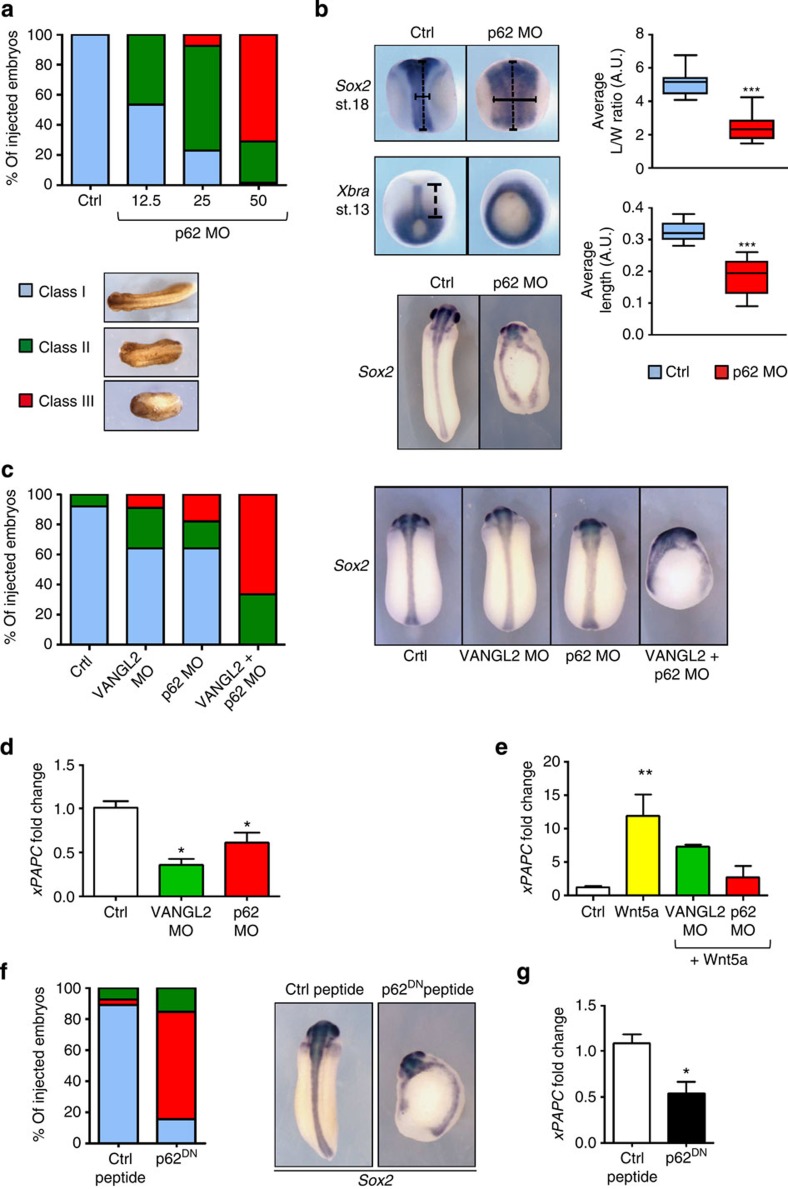
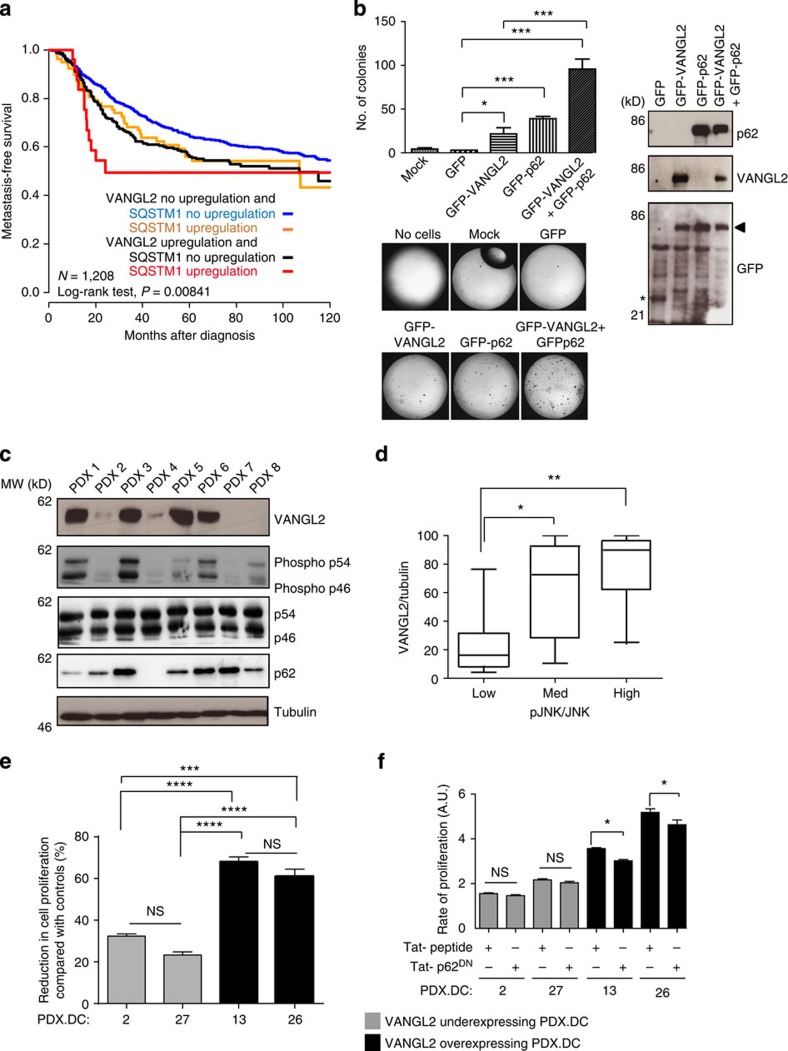
The non-canonical Wnt/planar cell polarity (Wnt/PCP) pathway plays a crucial role in embryonic development. Recent work has linked defects of this pathway to breast cancer aggressiveness and proposed Wnt/PCP signalling as a therapeutic target. Here we show that the archetypal Wnt/PCP protein VANGL2 is overexpressed in basal breast cancers, associated with poor prognosis and implicated in tumour growth. We identify the scaffold p62/SQSTM1 protein as a novel VANGL2-binding partner and show its key role in an evolutionarily conserved VANGL2-p62/SQSTM1-JNK pathway. This proliferative signalling cascade is upregulated in breast cancer patients with shorter survival and can be inactivated in patient-derived xenograft cells by inhibition of the JNK pathway or by disruption of the VANGL2-p62/SQSTM1 interaction. VANGL2-JNK signalling is thus a potential target for breast cancer therapy.


Figures

Figure 1
Figure 1. Overexpression of VANGL2 in breast cancer.
(a) Hierarchical clustering of the 208 breast cancers and 4 NB samples (columns) and the 12,304 most variable genes (rows). According to a log2 pseudocolour scale (bottom), red indicates a high level of mRNA expression compared with the median value across all samples, whereas green indicates a low level of expression. The magnitude of deviation from the median is represented by the colour saturation. The dendrogram of samples (above matrices) represents overall similarities in gene expression profiles. To the left of the colour matrix are represented some biologically relevant gene clusters (orange: extracellular matrix cluster (ECM); pink: ERBB2 cluster; blue: luminal/ER cluster; green: immune cluster; red: basal cluster). A few genes of the basal cluster are shown, including VANGL2, as well as classical basal genes (KRT5, KRT6, KRT17 and CRYAB). (b) Box and whisker plots of VANGL2 expression across 208 breast cancer samples profiled by both expression DNA arrays and aCGH, and according to (Student's t-test) VANGL2 genomic status: with (left, 104 samples) versus without (right, 104 samples) gain defined as a DNA copy number ratio tumour/NB⩾1.5). (c) Box and whisker plots of VANGL2 expression across 2,687 breast cancer samples according to molecular subtypes. Expression values are NB-centred. The horizontal black line represents the level of expression of VANGL2 in NB tissue. Differences between the subtypes were tested for significance using one-way analysis of variance (ANOVA). For each box and whisker plot, the median value and interquartile ranges are indicated. (d) Kaplan–Meier MFS curves in breast cancer patients according to VANGL2 mRNA expression. The 5-year MFS are 55% (upregulation; N=296) and 64% (absence of upregulation; N=912). (e) Immunohistochemistry experiment using anti-VANGL2 2G4 monoclonal antibody (mAb) shows that VANGL2 is more expressed in tumour cells (tumour) than in the stromal tissue (stroma) in basal breast cancer. Scale bar, 10 μM.
Figure 2
Figure 2. VANGL2 participates in tumour growth in cell culture and murine experiments.
(a) Basal cell lines chosen for their high basal score/correlation were SUM149 r=0.36 (a) and HCC1806 (b) r=0.28 and threshold was 0.15. Expression of two short hairpin RNAs abrogated VANGL2 expression in SUM149 cells by western blot analysis (upper panels). SUM149 cells (5 × 10⁶) were subcutaneously inoculated into the right flank of 4–6-week-old female NSG mice. Tumoral volume was measured at different times (lower panels). The mean and s.e.m. values (n=6, for shLuc and shVANGL2-transfected cells). The statistical significance between the data sets was determined using a two-way ANOVA test. *P≤0.05, **P≤0.005. (b) Same as a using HCC1806 cells, except that 1 × 10⁶ cells were inoculated into NSG mice. (c,d) Downregulation of VANGL2 with two different shRNAs led to a decreased proliferation of SUM149 (c) and HCC1806 (d) cells. Error bars represent mean±s.d. (e) COMMA-D cells were transduced with lentiviral supernatants allowing expression of GFP or GFP–VANGL2. Cell extracts were probed by western blot analysis with anti-GFP, -VANGL2 and -tubulin antibodies. An asterisk pinpoints endogenous VANGL2. (f) Kaplan–Meier curve of tumour-free status of mice transplanted with COMMA-D cells overexpressing GFP or GFP–VANGL2 (n=30). The statistical significance between the data sets was determined using a log-rank test.
Figure 3
Figure 3. Identification of the signalling adapter p62/SQSTM1 as a direct binding partner of VANGL2.
(a) Endogenous interaction between VANGL2 and p62/SQSTM1 is revealed by western blot analysis after immunoprecipitation using SKBR7 cell extracts. TL is total lysate. Crtl ab is an isotype-matched antibody. (b) The VANGL2–p62/SQSTM1 interaction occurs independently of LC3. Proteins were extracted from SUM149 cells and co-immunoprecipitations were carried out with the indicated antibodies. LC3 co-precipitates with p62/SQSTM1 but not with VANGL2. Reciprocally, VANGL2 co-immunoprecipitates with p62/SQSTM1 but not with LC3. IP control antibodies (IP crtl ab) are a polyclonal rabbit (for IP LC3) and a monoclonal rat antibody (for IP VANGL2). IgHs are immunoglobulin heavy chains. (c) GST pulldown assays of in vitro translated GFP–VANGL2 (full length: WT, N-terminal 1–102: NT, C-terminal 242–521: CT) showed that VANGL2 WT and CT directly bind to GST–p62/SQSTM1 (GST-p62) but not to GST. Asterisks indicate in vitro translated VANGL2 (top panel) and GST (bottom panel) proteins. AR, autoradiography; CBB, Coomassie Brilliant Blue. (d) A p62/SQSTM1 peptide (p62DN) disrupts the endogenous VANGL2–p62/SQSTM1 complex. SUM149 cell protein extracts were incubated with the indicated peptides p62DN or scrambled control peptide (Ctrl peptide) at 100 μM. VANGL2 was then immunoprecipitated (IP VANGL2) and bound proteins were immunoblotted with the indicated antibodies. TLs showed that equal amounts of proteins were present in each condition.
Figure 4
Figure 4. Colocalization of VANGL2 and p62/SQSTM1 in late endosomes.
(a) Immunofluorescence staining of SKBR7 cells showed colocalization of endogenous VANGL2 (green) and p62/SQSTM1 (red) in discrete cytoplasmic puncta. Scale bar, 10 μm. The mean Pearson correlation for VANGL2 and p62/SQSTM1 is 0.62, calculated using the Image J software for ∼15 cells per field of view and from 10 images. (b) Partial colocalization of VANGL2 and p62/SQSTM1 in late endosomes of SKBR7 cells stained with the LAMP1 marker. Scale bar, 20 μm. (c) SKBR7 ells were cultured in a nutrient-deprived medium and treated with 100 nM bafilomycin A1 (6 h) before fixation. Double labelling against VANGL2 (arrowheads) and p62/SQSTM1 (arrows), as described in Methods, showed accumulations of both markers in vesicular structures probably resembling endosomes/amphisomes. Scale bar, 200 nm. (d) IMCD3 cells were treated with PBS or EGTA (5 mM) for 30 min. Immunofluorescence and confocal analysis were performed using the indicated antibodies. Scale bar, 10 μm. Inserts show colocalized VANGL2 and p62/SQSTM1. (e) The VANGL2–p62/SQSTM1 complex was recovered in confluent SKBR7 or IMCD3 cells with 2G4 mAb (IP VANGL2) but not a control antibody (IP IgG2a ctrl) as seen using western blot analysis with the indicated antibodies. The complex was more abundant in cancer cells (SKBR7) than in polarized cells (IMCD3). Note that human (SKBR7 cells) and murine (IMCD3 cells) p62/SQSTM1 run at different molecular weights. (f) Lysates of confluent IMCD3 cells treated for 30 min with PBS or EGTA were subjected to 2G4 mAb immunoprecipitation (IP VANGL2). Immunoprecipitated proteins were probed by western blot analysis with the indicated antibodies. Increased amounts of VANGL2–p62/SQSTM1 complexes were recovered after EGTA treatment.
Figure 5
Figure 5. The VANGL2–p62/SQSTM1 complex regulates JNK phosphorylation.
(a) Downregulation of VANGL2 in SUM149 cells using a specific shRNA led to reduced JNK phosphorylation induced by Wnt5a (100 ng ml−1 for the indicated times). JNK is represented by two isoforms: p54 and p46. Wnt5a led to p46 (phospho-p46) and not p54 (phospho-54) phosphorylation. Relative quantification of immunoblots (phosphorylated JNK/total JNK) is representative from three independent experiments and use of two different shRNAs. (b) Expression of GFP-p62DN, but not GFP, in SUM149 cells led to decreased p46 JNK phosphorylation (phospho-46) induced by 100 ng ml−1 of Wnt5a at the indicated times. Relative quantification of immunoblots (phosphorylated JNK/total JNK) is representative from three independent experiments. (c) SUM149 cell extracts were added with the control peptide (Ctrl peptide) or the p62/SQSTM1 peptide (p62DN) that inhibited recruitment of JNK and p62/SQSTM1 to VANGL2. (d) Proteins extracted from SUM149 cells treated or not with serum were immunoprecipitated with anti-VANGL2 antibody and blotted with the indicated antibodies. p62/SQSTM1, JNK and phosphorylated JNK (phospho-p54 and phospho-p46) were present in the VANGL2 complex.
Figure 6
Figure 6. p62/SQSTM1 is necessary for VANGL2 pathway-mediated in vivo morphogenesis.
(a) Two-cell embryos were injected in each blastomere with 12.5 (n=15), 25 (n=13) and 50 (n=104) ng of p62 MO. Morphology was analysed at tailbud stage. (b) Embryos injected with 50 ng of p62 MO were processed for WISH analysis at mid-neurula and late gastrula stages. Convergence extension in the neural tube of late neurula embryos was evaluated by the average length/width ratio of the Sox2 domain (n=17). Convergence extension in the axial mesoderm of late gastrula embryos was evaluated by the average length of the Xbra domain (n=16). Tailbud embryos were stained with the Sox2 probe to highlight neural tube defect (bottom panel, n=30 control, n=104 morphants). (c) Two-cell embryos were injected in each blastomere with 11.5 ng of VANGL2 MO (n=27), 8 ng of p62 MO (n=26) or 11.5 ng of VANGL2+8 ng of p62 MO (n=32). Morphology was analysed at the tailbud stage using criteria of a. These embryos were processed for analysis of Sox2 expression at the tailbud stage (n=3). (d) Ten embryos injected as in b or with 34.5 ng of VANGL2 MO in each blastomere were collected at stage 13 and processed for RT–qPCR. (e) Four-cell embryos injected with Wnt5a mRNA (30 pg per cell) in the animal pole received a second injection of VANGL2 (11.5 ng per cell), or p62 (12.5 ng per cell) in all animal blastomeres at eight-cell stage. Fifteen animal caps per condition were isolated at the blastula stage, cultured for 4 h (at 23 °C) and then processed for RT–qPCR. (f) Two-cell embryos were injected in each blastomere with 4.5 ng of control peptide (n=27) or p62DN peptide (n=26). Morphology was analysed as in a and processed for analysis of Sox2 expression at the tailbud stage. (g) Ten embryos injected as in f were collected at stage 13 and processed for RT–qPCR. For qPCR graphs, error bars represent s.e.m. values of three or more independent experiments with two technical duplicates. Statistical analyses used unpaired Student's t-test, except in e where one-way ANOVA with Dunnett's test (99.9% confidence intervals) were applied. *P≤0.05; **P≤0.005; ***P≤0.0005; Ctrl, control; MO, morpholino; mRNA, messenger RNA; RT–qPCR, reverse transcriptase–quantitative PCR; WISH, whole-mount in situ hybridization.
Figure 7
Figure 7. Disruption of the VANGL2–p62/SQSTM1 interaction in breast cancer cells.
(a) Kaplan–Meier MFS curves of breast cancer patients according to concomitant VANGL2 and p62/SQSTM1 mRNA expression. The 5-year MFS are 49% (both upregulated; N=27), 64% (both not upregulated; N=833) and 56% (one upregulated, the other not upregulated; N=79 and N=269). (b) Soft agar colony formation of T47D cells overexpressing GFP, GFP–VANGL2 and GFP–p62/SQSTM1 (right). Protein expression was revealed with anti-p62/SQSTM1, anti-VANGL2 and anti-GFP antibodies by western blot analysis (right). In anti-GFP blot, the arrowhead indicates position of co-migrating GFP–VANGL2 and GFP–p62/SQSTM1 and the asterisk pinpoints GFP alone. Error bars represent mean±s.d. (n=3). (c) Protein levels of VANGL2, phosphorylated JNK, JNK (p54/p46), p62/SQSTM1 and tubulin assessed in eight breast cancer PDXs (PDX 1–8) by western blot analysis. (d) VANGL2, JNK, phosphorylated JNK and tubulin signals from 30 PDX protein extracts were quantified. VANGL2/tubulin ratios were plotted against pJNK/JNK ratios, arranged in ascending order into three equally sized groups (low, medium and high). High expression of VANGL2 protein is correlated to high levels of phosphorylated JNK. Box and whisker plots show the median value and interquartile ranges. The Kruskal–Wallis test was used for comparison of the median levels of expression. Statistically significant differences are indicated (*P≤0.05; **P≤0.01). (e) Treatment of the indicated PDX-derived cells (PDX. DC-2, −27, −13 and −26) with a Tat-conjugated JNK inhibitor (Tat-JIP at 10 μM) during 48 h led to greater reduction in cell proliferation of VANGL2high/pJNKhigh than VANGL2low/pJNKlow PDX-derived cells. Comparisons use Tukey's multiple comparisons test. NS, not significant. Data are representative of three independent experiments; *P≤0.05; **P≤0.01; ***P≤0.001; ****P≤0.0001. (f) Treatment of the indicated PDX-derived cells (PDX. DC-2, −27, −13 and −26) with the p62DN peptide (225 μM) but not with control scrambled peptide (225 μM) during 48 h resulted in decreased cell proliferation of VANGL2high/pJNKhigh, but not VANGL2low/pJNKlow, PDX-derived cells. Data are representative of three independent experiments and statistical testing as stated in e.

References

    1. Sorlie T. et al.. Gene expression patterns of breast carcinomas distinguish tumor subclasses with clinical implications. Proc. Natl Acad. Sci. USA 98, 10869–10874 (2001) . - PMC - PubMed
    1. Bertucci F., Finetti P. & Birnbaum D. Basal breast cancer: a complex and deadly molecular subtype. Curr. Mol. Med. 12, 96–110 (2012) . - PMC - PubMed
    1. Anastas J. N. & Moon R. T. WNT signalling pathways as therapeutic targets in cancer. Nat. Rev. Cancer 13, 11–26 (2013) . - PubMed
    1. Lin S. Y. et al.. Beta-catenin, a novel prognostic marker for breast cancer: its roles in cyclin D1 expression and cancer progression. Proc. Natl Acad. Sci. USA 97, 4262–4266 (2000) . - PMC - PubMed
    1. Bukholm I. K., Nesland J. M., Karesen R., Jacobsen U. & Borresen-Dale A. L. E-cadherin and alpha-, beta-, and gamma-catenin protein expression in relation to metastasis in human breast carcinoma. J. Pathol. 185, 262–266 (1998) . - PubMed

Publication types

MeSH terms

Substances