. 2016 Jan 12:5:e07141.
doi: 10.7554/eLife.07141.

Molecular basis for allosteric specificity regulation in class Ia ribonucleotide reductase from Escherichia coli

Affiliations

Molecular basis for allosteric specificity regulation in class Ia ribonucleotide reductase from Escherichia coli

Christina M Zimanyi et al. Elife. .

Abstract

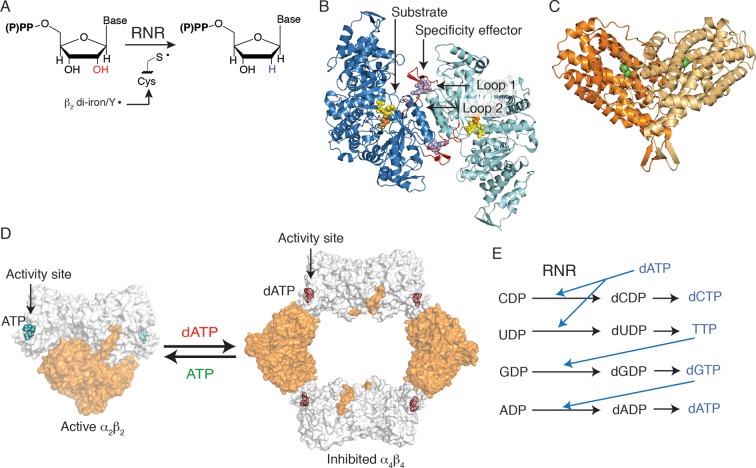
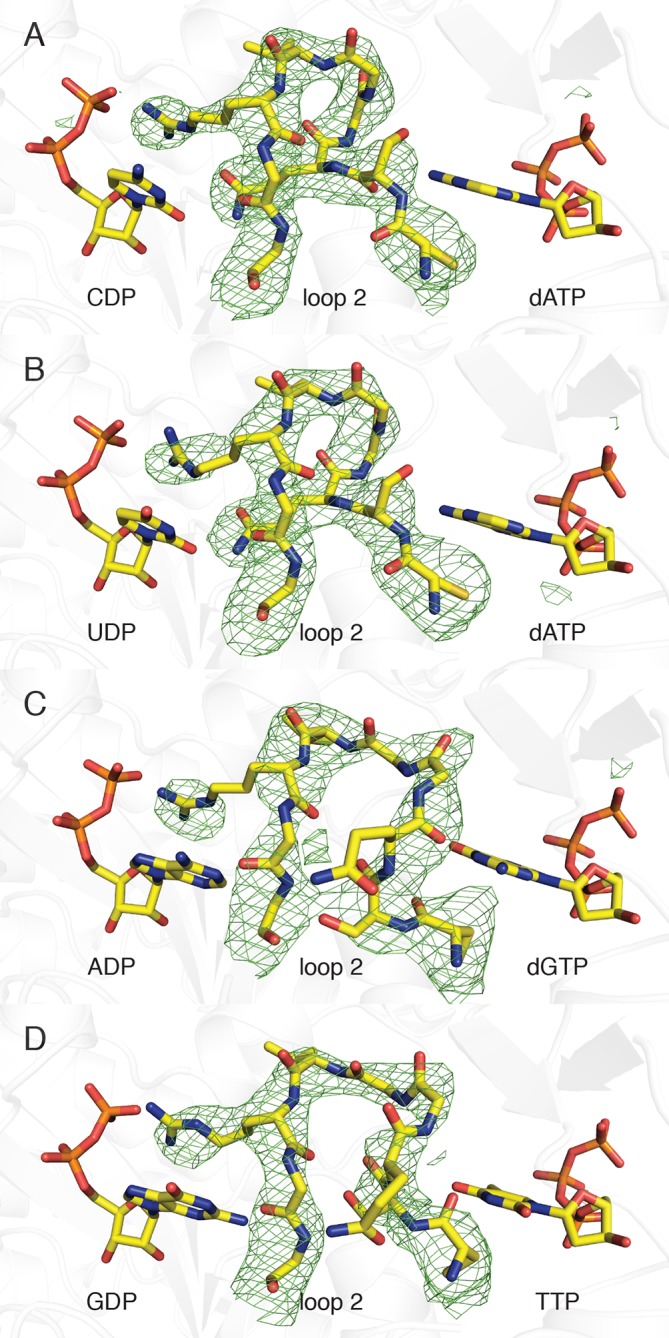
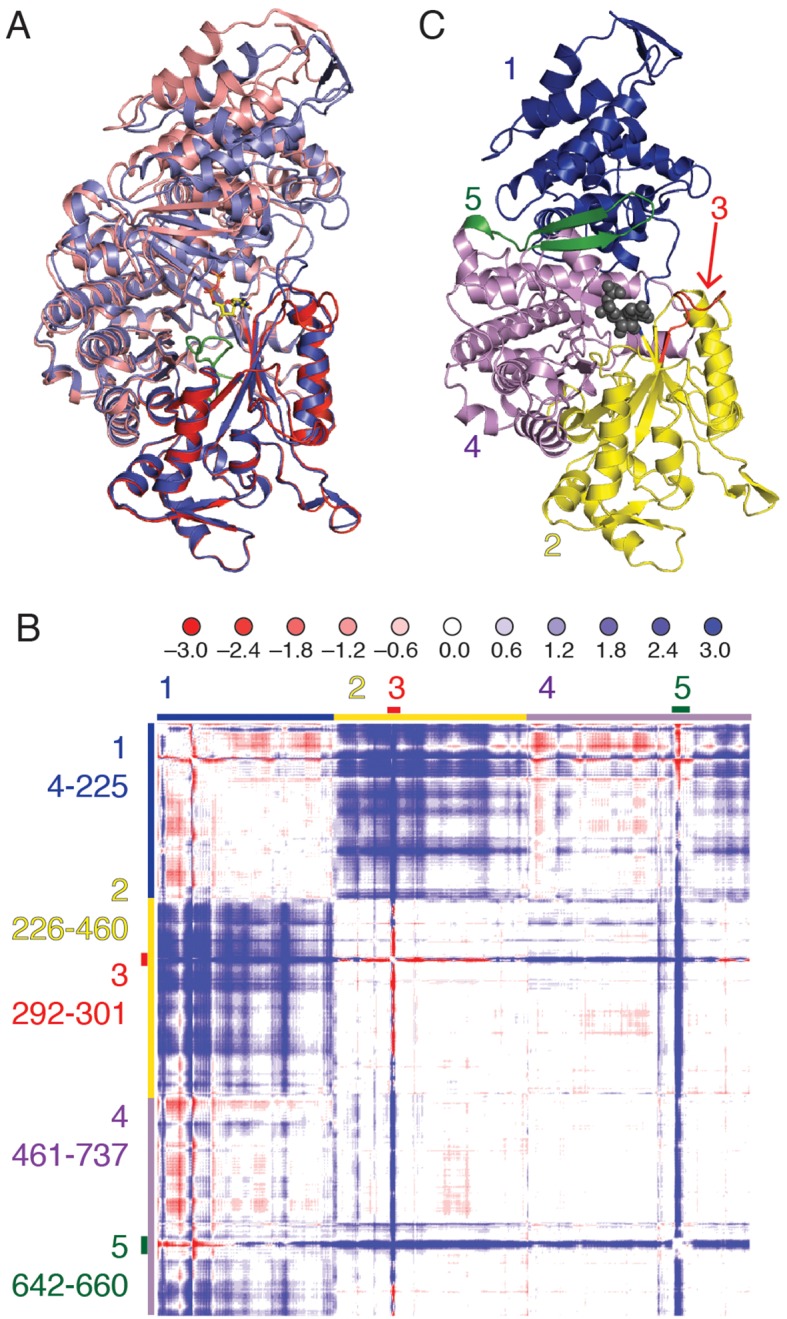
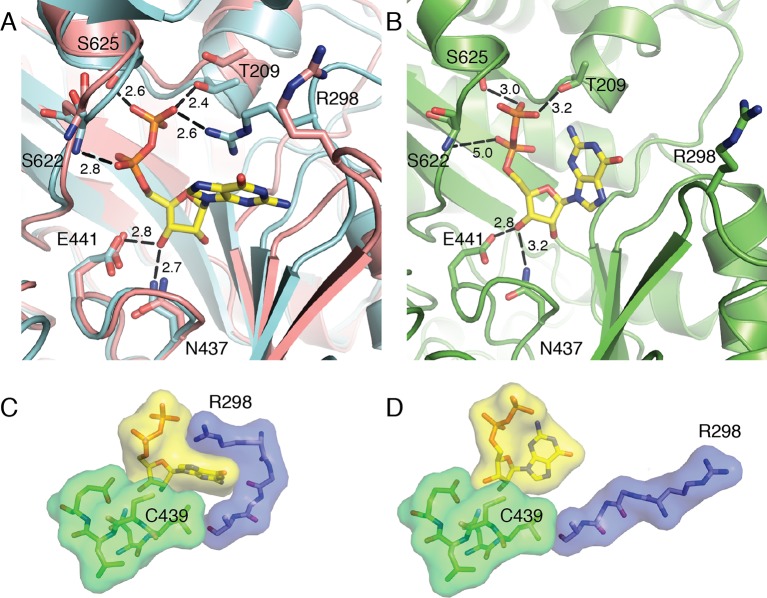
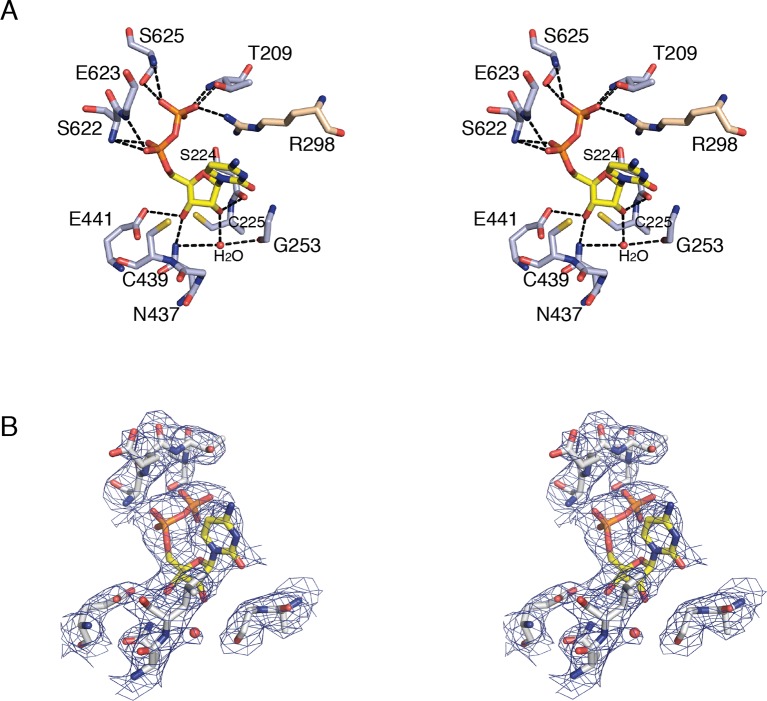
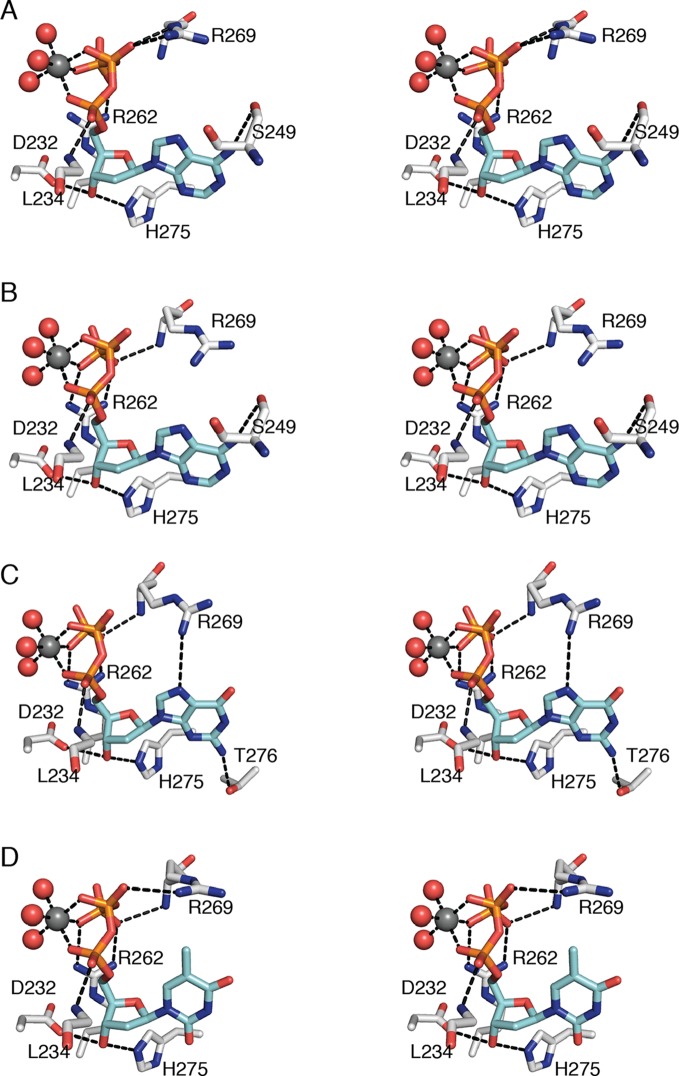
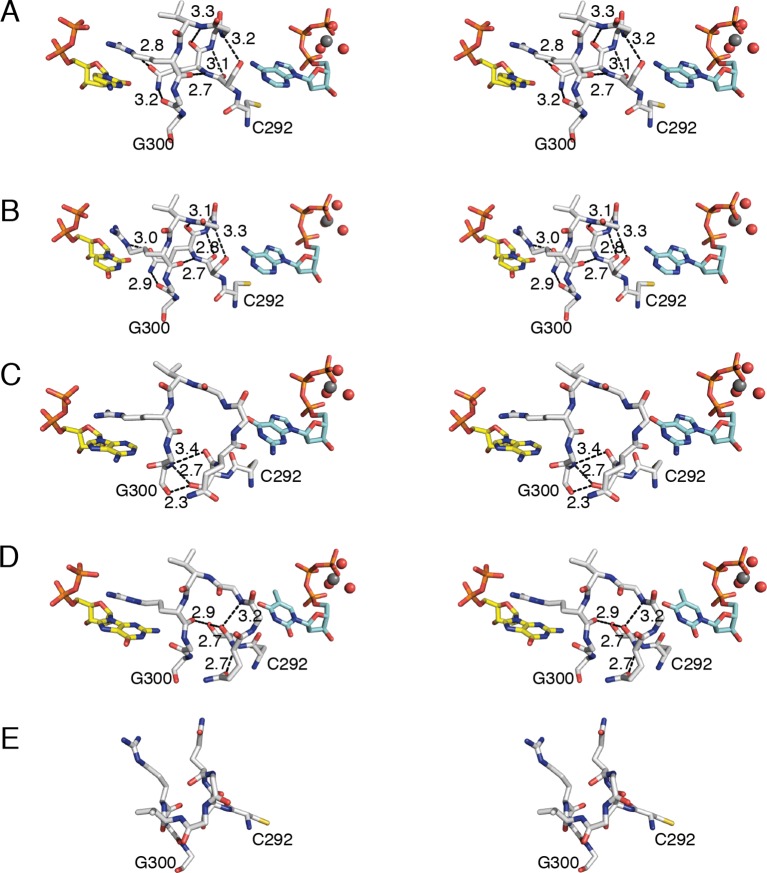
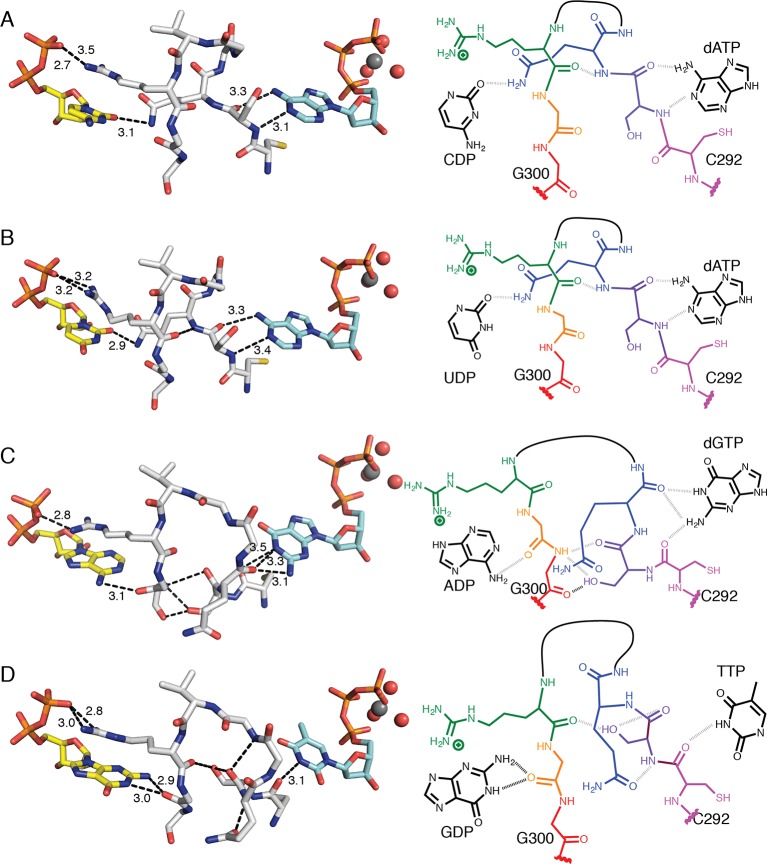
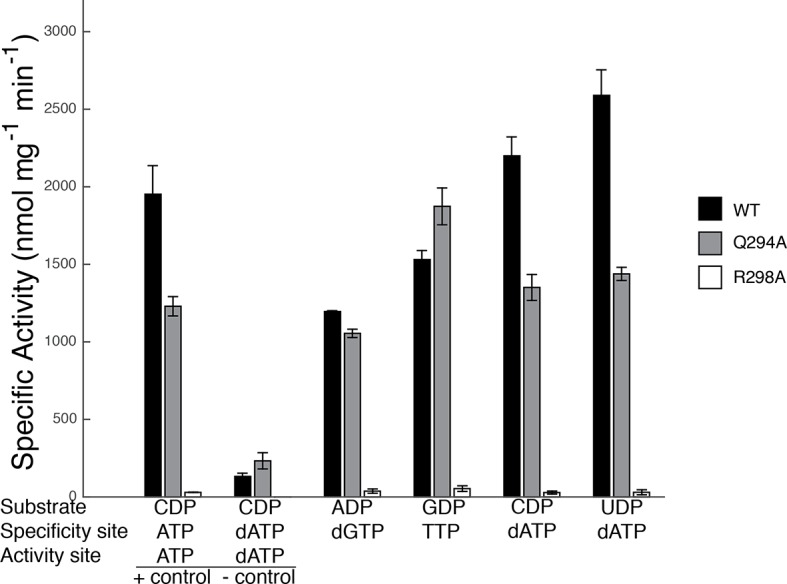
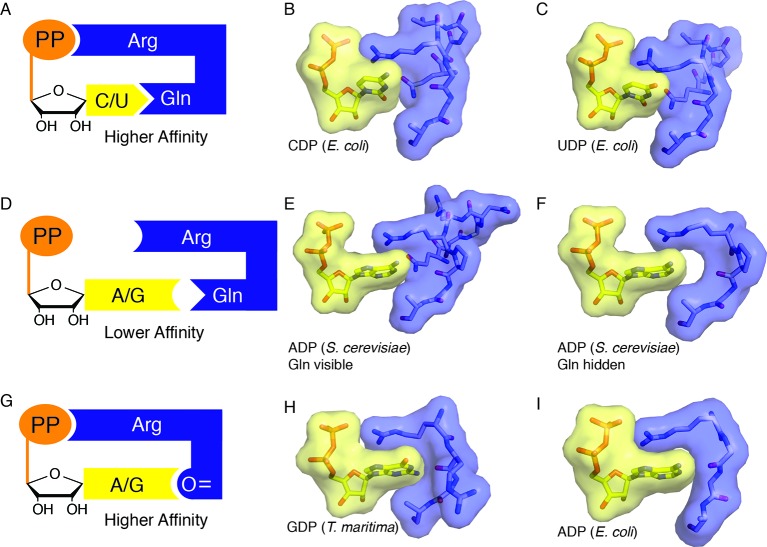
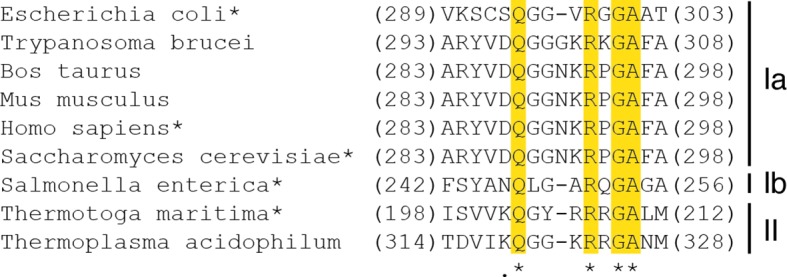
Ribonucleotide reductase (RNR) converts ribonucleotides to deoxyribonucleotides, a reaction that is essential for DNA biosynthesis and repair. This enzyme is responsible for reducing all four ribonucleotide substrates, with specificity regulated by the binding of an effector to a distal allosteric site. In all characterized RNRs, the binding of effector dATP alters the active site to select for pyrimidines over purines, whereas effectors dGTP and TTP select for substrates ADP and GDP, respectively. Here, we have determined structures of Escherichia coli class Ia RNR with all four substrate/specificity effector-pairs bound (CDP/dATP, UDP/dATP, ADP/dGTP, GDP/TTP) that reveal the conformational rearrangements responsible for this remarkable allostery. These structures delineate how RNR 'reads' the base of each effector and communicates substrate preference to the active site by forming differential hydrogen bonds, thereby maintaining the proper balance of deoxynucleotides in the cell.

Keywords: E. coli; X-ray crystallography; allosteric regulation; biochemistry; biophysics; nucleic acid metabolism; structural biology.


Conflict of interest statement

The authors declare that no competing interests exist.

Figures

Figure 1.
Figure 1.. Escherichia coli class Ia RNR regulation is achieved through allostery.
(A) E. coli RNR catalyzes reduction of nucleoside diphosphates using a radical, formed on an active site cysteine, to initiate catalysis. (B) A ribbon representation of the catalytic subunit (α2, a 172-kDa homodimer) is shown with one α chain colored blue and the other cyan (this work). Nucleotides are shown as spheres with NDP substrate in yellow and dNTP specificity effector in purple. Loop 1 and loop 2, which are involved in specificity effector binding and recognition, are colored in red. Cys439, where the active site thiyl radical is formed, is shown in orange spheres. (C) A ribbon representation of the radical generating subunit (β2, an 87-kDa homodimer) is shown with one β chain colored orange and the other tan (this work). The di-iron cofactor that generates the initial tyrosyl radical required for RNR activity is shown in green spheres. (D) Allosteric activity regulation is achieved by interconversion between an active α2β2 complex in the presence of the allosteric activity effector ATP and an inactive α4β4 species when dATP binds to the allosteric activity site (PDB ID: 3UUS). The model for the α2β2 complex was created using small-angle X-ray scattering data (Ando et al., 2011) to fit the previously solved structure of α2 (PDB ID: 3R1R) and β2 (PDB ID: 1RIB) together. The α2 subunit is shown in grey surface representation, at a 90° angle from the representation shown in (B) and the β2 subunit is shown in orange surface representation. Allosteric activity sites are shown with ATP modeled in cyan and dATP in red spheres. (E) Allosteric specificity regulation is governed by the binding of deoxynucleoside triphosphates to RNR, influencing the preference for one substrate over another (see Table 1). DOI: http://dx.doi.org/10.7554/eLife.07141.003
Figure 2.
Figure 2.. Composite omit electron density confirms that loop 2 is ordered in our E. coli class Ia RNR structures.
Protein is shown as grey ribbons with substrate, loop 2, and specificity effector in sticks and labeled. Carbon is colored in yellow, oxygen in red, nitrogen in blue, phosphorus in orange. 2FoFc composite omit density is shown contoured at +1.0 σ (green mesh). (A) α4β4-CDP/dATP structure. (B) α4β4-UDP/dATP structure. (C) α4β4-ADP/dGTP structure. (D) α4β4-GDP/TTP structure. DOI: http://dx.doi.org/10.7554/eLife.07141.005
Figure 3.
Figure 3.. Cα difference distance matrix plot reveals movements that occur concurrent with substrate binding for E. coli class Ia RNR.
(A) Superposition of α from our CDP/dATP structure (N-terminus and one half of the active site barrel in purple and the other half barrel in blue) and α from a substrate-free E. coli RNR structure (PDB ID: 3R1R, (Eriksson et al., 1997)) (N-terminus and one half of active site barrel in pink and the other half barrel in red). The two chains were aligned by the active site finger loop, which is colored green. CDP is shown as sticks. (B) Distances in chain A of the CDP/dATP structure (this work) were subtracted from chain A of the substrate-free α2 structure (PDB ID: 3R1R) for residues 4–737. Scale is shown on the top and is ±3.0 Å (positive values in blue indicate a shorter distance in the CDP/dATP structure and negative values in red indicate a longer distance). Regions that move in a concerted fashion are indicated with colored lines and residue ranges are listed to the left of the plot. (C) One α chain is shown in ribbons with residue ranges from (B) colored. Region 1 (blue), the N-terminal 225 residues, contracts towards region 2 (yellow). Region 3 (red) includes loop 2 residues and moves towards the active site (in region 4). A flexible loop, region 5 (green), undergoes a large motion towards regions 2 and 4 whereas region 4 undergoes little movement with respect to the rest of the structure. DOI: http://dx.doi.org/10.7554/eLife.07141.009
Figure 4.
Figure 4.. Local movements stabilize substrate binding to the active site of α2.
(A) GDP/TTP-bound structure (this work, cyan) is overlaid with substrate free α2 (PDB ID: 3R1R, pink). Distances are given in Å. GDP and residues that form hydrogen bonds to GDP are shown as sticks with GDP carbons in yellow, protein carbons in cyan or pink. Ser622, Ser625 and Thr209 move to form hydrogen bonds to the phosphates of GDP. Arg298 of loop 2 reaches over the guanine base to contact the phosphates. (B) Previously reported α2 structure with GDP bound at an occupancy of 0.5 (PDB ID: 4R1R). GDP and residues that form hydrogen bonds to GDP are shown in sticks with GDP carbons in yellow and protein carbons in green. (C) Van der Waals packing around GDP in GDP/TTP structure (this work) showing a tightly packed active site. (D) Van der Waals packing around GDP from previously reported α2 structure (PDB ID: 4R1R) showing that the active site is still open. DOI: http://dx.doi.org/10.7554/eLife.07141.010
Figure 5.
Figure 5.. Details of CDP binding to a clamped-down active site in E. coli class Ia RNR.
(A) Wall-eyed stereo view of CDP ribose and phosphate interactions with protein. CDP is shown as sticks with carbons in yellow. Protein side chain carbons are colored light purple and loop 2 residue, Arg298, carbons are colored tan. A putative water molecule is shown as a red sphere. Hydrogen-bonding interactions, shown with black dashed lines, include: O3' of ribose to Glu441, the proposed general base (van der Donk et al., 1996; Persson et al., 1997), and O2' to backbone carbonyl of Ser224. Cys225 is the proposed proton donor for the 2'-OH that is lost as H2O. Cys225 is 3.4–3.6 Å from the O2'. The distance between the sulfur atom of Cys439, where the thiyl radical is formed, and C3' of the ribose, where a hydrogen atom is abstracted to initiate catalysis, is 3.5–3.7 Å. (B) Wall-eyed stereo view of omit electron density for CDP structure shown in A. Orientation is tilted and rotated slightly to show the water density. A water molecule is present in this position in some substrate-bound RNR structures and not others, the significance of which is not clear. Arg298 is not shown for simplicity. DOI: http://dx.doi.org/10.7554/eLife.07141.011
Figure 6.
Figure 6.. Interactions that anchor specificity effectors in E. coli class Ia RNR involve residues outside of loop 2.
Interactions are shown for (A) CDP/dATP, (B) UDP/dATP, (C) ADP/dGTP, and (D) GDP/TTP. The dNTP effector carbons are colored cyan and the protein carbons are colored grey. Magnesium ions are colored grey and waters in red. The side chain of Leu234 is omitted for clarity. Hydrogen-bonding interactions are shown with black dashed lines. Figures are displayed in wall-eyed stereo. DOI: http://dx.doi.org/10.7554/eLife.07141.012
Figure 7.
Figure 7.. Conformations of E. coli class Ia RNR loop 2 in the presence and absence of substrate-effector pairs.
Structures are shown in wall-eyed stereo as sticks for (A) CDP/dATP, (B) UDP/dATP, (C) ADP/dGTP, and (D) GDP/TTP. (E) α2 with no substrates or effectors bound (PDB ID: 3R1R). Substrates are shown with carbons in yellow, effectors are shown with carbons in cyan, and loop 2 is shown with carbons in grey. Other atoms colored as in previous figures. Hydrogen-bonding interactions are shown in black dashed lines with distances given in Å. Only interactions between protein residues are shown. DOI: http://dx.doi.org/10.7554/eLife.07141.013
Figure 8.
Figure 8.. Molecular basis for communication between substrate and effector binding sites in E. coli class Ia RNR.
Structures are shown as sticks on the left with 2D representation of hydrogen-bonding interactions on the right for (A) CDP/dATP, (B) UDP/dATP, (C) ADP/dGTP, and (D) GDP/TTP. Atoms are colored as in Figure 7. Hydrogen-bonding interactions are shown in black dashed lines with distances given in Å. In the 2D representation, each residue is colored a different color, residues 295–297 are shown as a black line, and hydrogen bonds are indicated with black dashed lines. DOI: http://dx.doi.org/10.7554/eLife.07141.014
Figure 9.
Figure 9.. Specific activity for wild-type and mutant forms of E. coli RNR in the presence of different substrate/effector pairs.
Wild-type is shown in black, Gln294Ala in grey, and Arg298Ala in white. Activity was measured by a coupled assay that follows nicotinamide adenine dinucleotide phosphate (NAPDH ) consumption (see Materials and methods) for the following substrate and effector concentrations: 1 mM CDP and 3 mM ATP (far left), 1 mM CDP and 175 μM dATP (second to left), 1 mM ADP and 120 μM dGTP, 1 mM GDP and 250 μM TTP, and 1 mM CDP/UDP and 1 μM dATP (far right). Since dATP at high concentrations (175 μM) inhibits the enzyme, the sets of bars at the far left represent control experiments to show activity levels under active (CDP/ATP) and inactive (CDP/dATP) conditions. DOI: http://dx.doi.org/10.7554/eLife.07141.015
Figure 10.
Figure 10.. Snapshots of higher and lower affinity substrate-bound states of RNR.
(A) Cartoon of a high-affinity complex for CDP/UDP bound to RNR. (B) Packing of active site in E. coli class Ia RNR CDP/dATP structure (this work). (C) Packing of active site for UDP/dATP structure (this work). (D) Cartoon of a lower-affinity complex in which positioning of Gln into the active site holds loop 2 away such that Arg cannot reach the substrate diphosphate. (E) Packing of active site of ADP-bound S. cerevisiae RNR structure (PDB ID: 2CVX). With Gln288 (Gln294 in E. coli) in the active site, Arg293 (Arg298 in E. coli) does not reach the diphosphate of substrate. (F) Same structure as in (E), but Gln is not shown. Shape complementary suggests that a tighter complex could form than the one that is visualized in this crystal structure. (G) Cartoon of a high-affinity complex for ADP/GDP bound to RNR. (H) Packing of active site in GDP structure of class II RNR from T. maritima (PDB ID: IXJE) is similar to that of the E. coli class Ia RNR with ADP/dGTP bound (shown in panel I) and the E. coli GDP/TTP structure that is shown in Figure 4C. (I) Packing of active site in E. coli class Ia RNR with ADP/dGTP bound (this work). DOI: http://dx.doi.org/10.7554/eLife.07141.017
Figure 11.
Figure 11.. Structure-based sequence alignment of loop 2 residues of characterized class Ia, class Ib, and class II RNRs, with asterisk denoting RNRs for which structures are available.
Absolutely conserved residues are starred and highlighted. Arg298 (E. coli numbering) stabilizes substrate binding and Gln294 stabilizes pyrimidine binding when dATP is bound to the specificity allosteric site. The eukaryotic RNRs have one additional residue inserted into the loop. Characterized monomeric class II RNRs are not included in this alignment. Beyond these characterized RNRs, sequence alignments are more challenging and conservation is less clear. Although Arg298 may be strictly conserved, Gln294 is unlikely to be. DOI: http://dx.doi.org/10.7554/eLife.07141.018

References

    1. Afonine PV, Grosse-Kunstleve RW, Echols N, Headd JJ, Moriarty NW, Mustyakimov M, Terwilliger TC, Urzhumtsev A, Zwart PH, Adams PD. Towards automated crystallographic structure refinement with phenix.refine. Acta Crystallographica Section D Biological Crystallography. 2012;68:352–367. doi: 10.1107/S0907444912001308. - DOI - PMC - PubMed
    1. Ahmad MF, Kaushal PS, Wan Q, Wijerathna SR, An X, Huang M, Dealwis CG. Role of arginine 293 and glutamine 288 in communication between catalytic and allosteric sites in yeast ribonucleotide reductase. Journal of Molecular Biology. 2012;419:315–329. doi: 10.1016/j.jmb.2012.03.014. - DOI - PMC - PubMed
    1. Ando N, Brignole EJ, Zimanyi CM, Funk MA, Yokoyama K, Asturias FJ, Stubbe J, Drennan CL. Structural interconversions modulate activity of Escherichia coli ribonucleotide reductase. Proceedings of the National Academy of Sciences of the United States of America. 2011;108:21046–21051. doi: 10.1073/pnas.1112715108. - DOI - PMC - PubMed
    1. Birgander PL, Kasrayan A, Sjoberg B-M. Mutant R1 proteins from Escherichia coli class Ia ribonucleotide reductase with altered responses to dATP inhibition. Journal of Biological Chemistry. 2004;279:14496–14501. doi: 10.1074/jbc.M310142200. - DOI - PubMed
    1. Bollinger JM, Hangtong W, Ravi N, Hanh Huynh B, Edmondson D, Stubbe J. Use of rapid kinetics methods to study the assembly of the diferric-tyrosyl radical cofactor of Escherichia coli ribonucleotide reductase. Methods in Enzymology. 1995;258:278–303. doi: 10.1016/0076-6879(95)58052-2. - DOI - PubMed

Publication types

MeSH terms

Substances

LinkOut - more resources