. 2016 Jan 11:14:3.
doi: 10.1186/s12915-015-0224-3.

Modulation of the human gut microbiota by dietary fibres occurs at the species level

Affiliations

Modulation of the human gut microbiota by dietary fibres occurs at the species level

Wing Sun Faith Chung et al. BMC Biol. .

Abstract

Background: Dietary intake of specific non-digestible carbohydrates (including prebiotics) is increasingly seen as a highly effective approach for manipulating the composition and activities of the human gut microbiota to benefit health. Nevertheless, surprisingly little is known about the global response of the microbial community to particular carbohydrates. Recent in vivo dietary studies have demonstrated that the species composition of the human faecal microbiota is influenced by dietary intake. There is now potential to gain insights into the mechanisms involved by using in vitro systems that produce highly controlled conditions of pH and substrate supply.

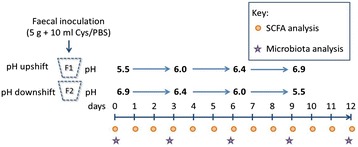
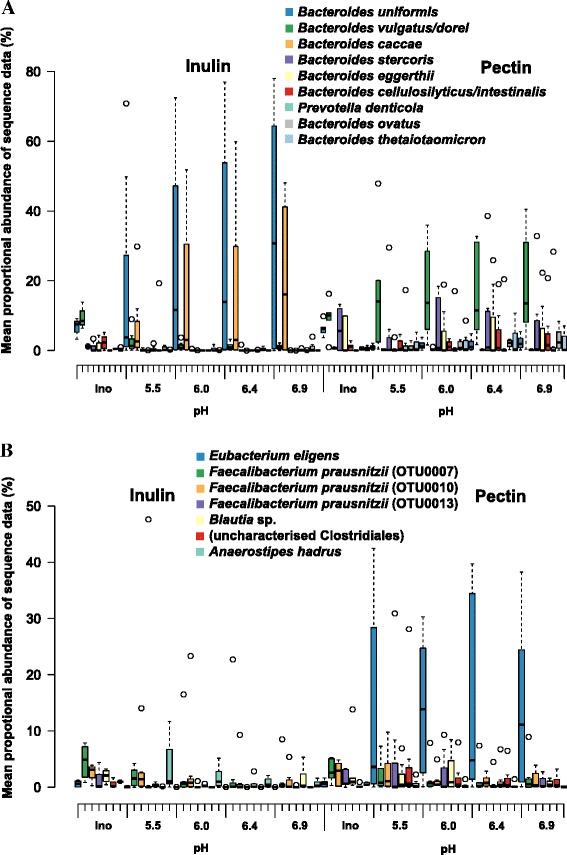
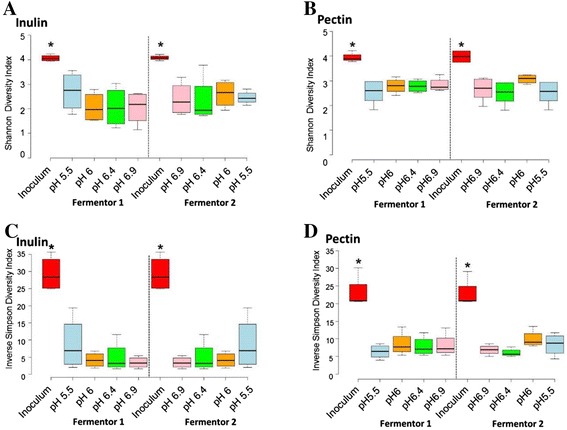
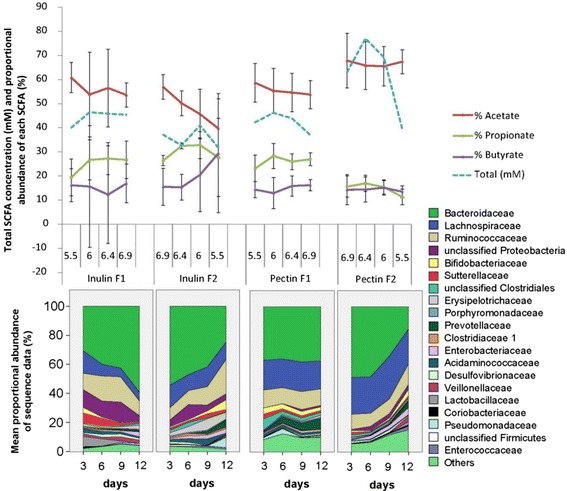
Results: We supplied two alternative non-digestible polysaccharides as energy sources to three different human gut microbial communities in anaerobic, pH-controlled continuous-flow fermentors. Community analysis showed that supply of apple pectin or inulin resulted in the highly specific enrichment of particular bacterial operational taxonomic units (OTUs; based on 16S rRNA gene sequences). Of the eight most abundant Bacteroides OTUs detected, two were promoted specifically by inulin and six by pectin. Among the Firmicutes, Eubacterium eligens in particular was strongly promoted by pectin, while several species were stimulated by inulin. Responses were influenced by pH, which was stepped up, and down, between 5.5, 6.0, 6.4 and 6.9 in parallel vessels within each experiment. In particular, several experiments involving downshifts to pH 5.5 resulted in Faecalibacterium prausnitzii replacing Bacteroides spp. as the dominant sequences observed. Community diversity was greater in the pectin-fed than in the inulin-fed fermentors, presumably reflecting the differing complexity of the two substrates.

Conclusions: We have shown that particular non-digestible dietary carbohydrates have enormous potential for modifying the gut microbiota, but these modifications occur at the level of individual strains and species and are not easily predicted a priori. Furthermore, the gut environment, especially pH, plays a key role in determining the outcome of interspecies competition. This makes it crucial to put greater effort into identifying the range of bacteria that may be stimulated by a given prebiotic approach. Both for reasons of efficacy and of safety, the development of prebiotics intended to benefit human health has to take account of the highly individual species profiles that may result.


Figures

Fig. 1
Fig. 1
Diagram showing the design of the fermentor experiments used in this study. Single substrates (inulin or apple pectin) were supplied at a concentration of 0.5 %. In each experiment, two vessels were run in parallel (F1 and F2), with the same faecal inoculum and substrate. Fermentor 1 was shifted in the sequence pH 5.5, 6.0, 6.4, 6.9 (upshift) and fermentor 2 in the sequence pH 6.9, 6.4, 6.0, 5.5 (downshift). Samples were collected daily for short chain fatty acid analysis and DNA extraction was performed at days 0, 3, 6, 9, and 12 for qPCR and Illumina MiSeq-based sequencing of 16S rRNA gene amplicons. For each substrate, separate experiments were performed using faecal inocula from three different healthy volunteers (D1, D2 and D3)
Fig. 2
Fig. 2
Effect of pH on microbial community composition. 16S rRNA gene-targeted qPCR data are shown for Bacteroides spp. (a) with inulin and (b) with apple pectin as energy sources and for Lachnospiraceae (c) with inulin and (d) with pectin. These refer to 12 fermentor runs (F1 (upshift), F2 (downshift) fermentors run in parallel for donors D1, D2 and D3 with pectin or inulin) *P <0.05, **P <0.001 (ANOVA, see Methods). Results from Illumina MiSeq sequencing of 16S rRNA gene amplicons are shown in (e) at the phylum level for F1 and F2 fermentors for each substrate; these revealed significant effects of pH when analyzed by ANOVA (see text). MiSeq data represent merged data from the same 12 fermentor runs, but also include four additional (repeat) runs for D2 inulin (F1, F2) and D3 pectin (F1, F2). Combined phylum and family level results from the sequence data are also shown for each substrate in Additional file 1: Figure S1. A list of operational taxonomic units obtained from analysis of 16S rRNA gene amplicon sequences for all samples is given in Additional file 2: Table S1
Fig. 3
Fig. 3
Bacteroidetes (a) and Firmicutes (b) changes across pH at the operational taxonomic unit (OTU) level. Merged data derived from Illumina MiSeq sequencing of 16S rRNA gene amplicons are shown from a total of 16 fermentor runs (F1 (upshift), F2 (downshift) fermentors run in parallel for donors D1, D2 and D3 with pectin or inulin as substrates, plus additional repeat runs for D2 inulin (F1, F2) and D2 pectin (F1, F2)). Ino = inoculum. Corresponding OTU numbers can be found in Additional file : Table S2 and a list of OTUs obtained from analysis of 16S rRNA gene amplicon sequences for all samples is given in Additional file 2: Table S1. Centre lines show the medians; box limits indicate the 25th and 75th percentiles as determined by R software; whiskers extend 1.5 times the interquartile range from the 25th and 75th percentiles, outliers are represented by dots
Fig. 4
Fig. 4
Mean proportional abundance of the top 20 most abundant operational taxonomic unit (OTUs) in inulin and pectin fermentor samples. Based on the 16 fermentor runs described in Fig. 3. Corresponding OTU numbers can be found in Additional file : Table S2 and the complete list of OTUs obtained from analysis of 16S rRNA gene amplicon sequences for all samples is given in Additional file 2: Table S1. Mean values and standard deviations are shown for the three donors. * Significant P value after Benjamini-Hochberg correction for false discovery rate (Metastats analysis)
Fig. 5
Fig. 5
Microbial competition within individual fermentor runs. Changes in Bacteroides species and in the Firmicutes bacteria F. prausnitzii and Eubacterium eligens are shown for 12 fermentors (as described in Fig. 2a–d) that involved inocula from donors D1, D2 and D3. The sequence of imposed pH changes is shown for each run. These plots show the proportional abundance of OTUs determined from analysis of 16S rRNA gene amplicon sequences (Additional file 2: Table S1). Three F. prausnitzii OTUs and one E. eligens OTU were detected in inocula from all three donors, while a fourth F. prausnitzii OTU0013 was also detected in D1 and D3 inocula. Similarly, four Bacteroides OTUs (B. uniformis, B. vulgatus/dorei, B. caccae and B. ovatus) were present in inocula from all three donors. Of the remaining four Bacteroides OTUs shown, B. cellulosilyticus/intestinalis was not detected in D1 inocula, B. thetaiotaomicron and B. stercoris were not detected in D1 and D2 inocula, and B. eggerthii was not found in D3 inocula
Fig. 6
Fig. 6
Bacterial diversity across pH range in inulin and pectin fermentors using both the Shannon index (a, b) and inverse Simpson index (c, d). Centre lines show the medians; box limits indicate the 25th and 75th percentiles as determined by R software; whiskers extend 1.5 times the interquartile range from the 25th and 75th percentiles, outliers are represented by dots. * Indicates significant difference between the faecal inocula and all fermentor pH conditions (ANOVA, P <0.001). Diversity estimates were derived from 16S rRNA gene OTU analysis of the 16 fermentor runs described in Fig. 3 and shown in Additional file 2: Table S1
Fig. 7
Fig. 7
Short chain fatty acids (SCFA) in upshift and downshift fermentors. Mean SCFA values (means and standard deviations) and proportional abundance of bacterial families based on sequence analysis of 16S rRNA gene amplicons are shown for the 16 fermentor runs described in Fig. 3. Significant changes in % SCFA (from ANOVA) are discussed in the text. ANOVA revealed significant decreases in % Bacteroidaceae between pH 6.9 and pH 5.5 in inulin fermentors F1 (P = 0.015) and F2 (P = 0.012), but with pectin only for the F2 (downshift) fermentors (P = 0.0001). % Bifidobacteriaceae and % Lachnospiraceae increased significantly at pH 5.5 compared with pH 6.9 in F2 inulin (P = 0.007) and F1 inulin (P = 0.025) fermentors, respectively

References

    1. Maloy KJ, Powrie F. Intestinal homeostasis and its breakdown in inflammatory bowel disease. Nature. 2011;474(7351):298–306. doi: 10.1038/nature10208. - DOI - PubMed
    1. Le Chatelier E, Nielsen T, Qin J, Prifti E, Hildebrand F, Falony G, et al. Richness of human gut microbiome correlates with metabolic markers. Nature. 2013;500(7464):541–6. doi: 10.1038/nature12506. - DOI - PubMed
    1. Flint HJ, Scott KP, Louis P, Duncan SH. The role of the gut microbiota in nutrition and health. Nat Rev Gastroenterol Hepatol. 2012;9(10):577–89. doi: 10.1038/nrgastro.2012.156. - DOI - PubMed
    1. Walker AW, Ince J, Duncan SH, Webster LM, Holtrop G, Ze X, et al. Dominant and diet-responsive groups of bacteria within the human colonic microbiota. ISME J. 2011;5(2):220–30. doi: 10.1038/ismej.2010.118. - DOI - PMC - PubMed
    1. David LA, Maurice CF, Carmody RN, Gootenberg DB, Button JE, Wolfe BE, et al. Diet rapidly and reproducibly alters the human gut microbiome. Nature. 2014;505(7484):559–63. doi: 10.1038/nature12820. - DOI - PMC - PubMed

Publication types

MeSH terms