. 2016 Jan 11;84(3):856-65.
doi: 10.1128/IAI.01291-15.

Analysis of TcdB Proteins within the Hypervirulent Clade 2 Reveals an Impact of RhoA Glucosylation on Clostridium difficile Proinflammatory Activities

Affiliations

Analysis of TcdB Proteins within the Hypervirulent Clade 2 Reveals an Impact of RhoA Glucosylation on Clostridium difficile Proinflammatory Activities

Carlos Quesada-Gómez et al. Infect Immun. .

Abstract

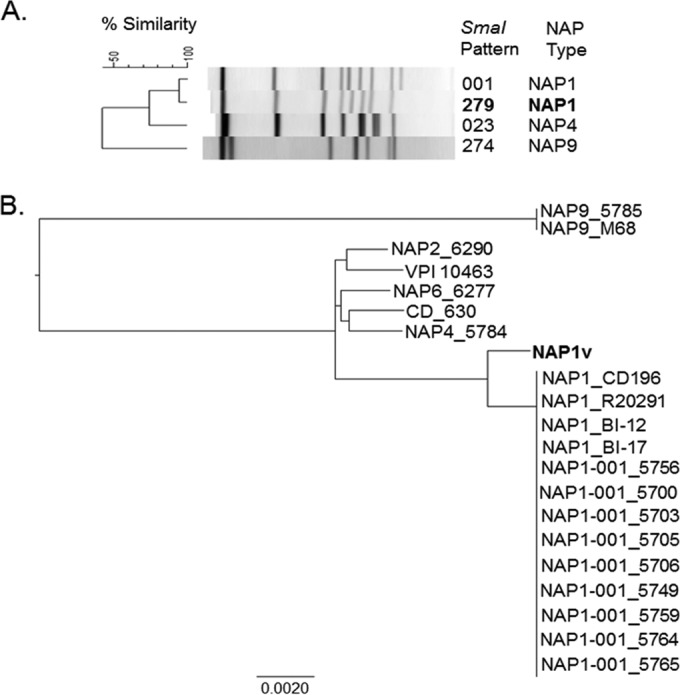
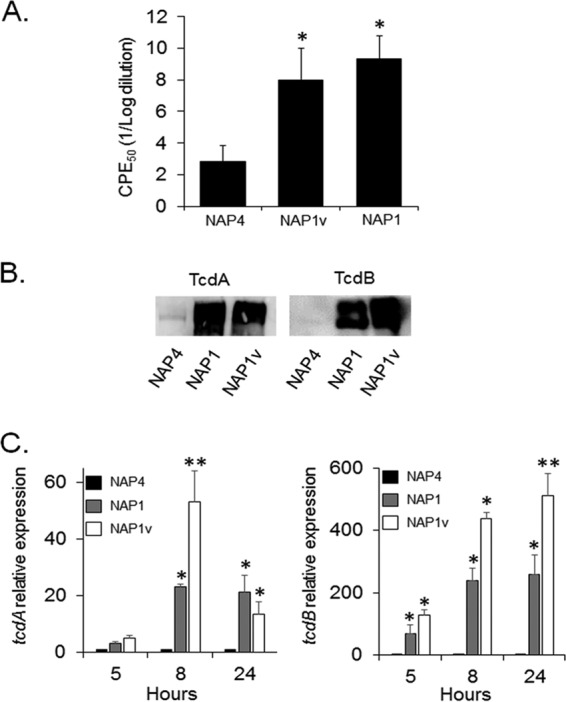
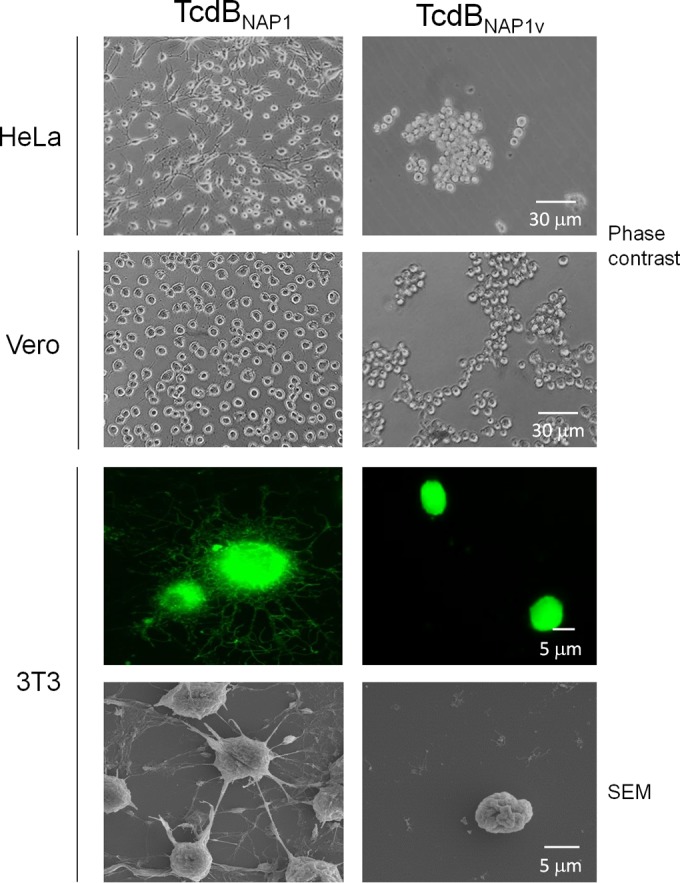
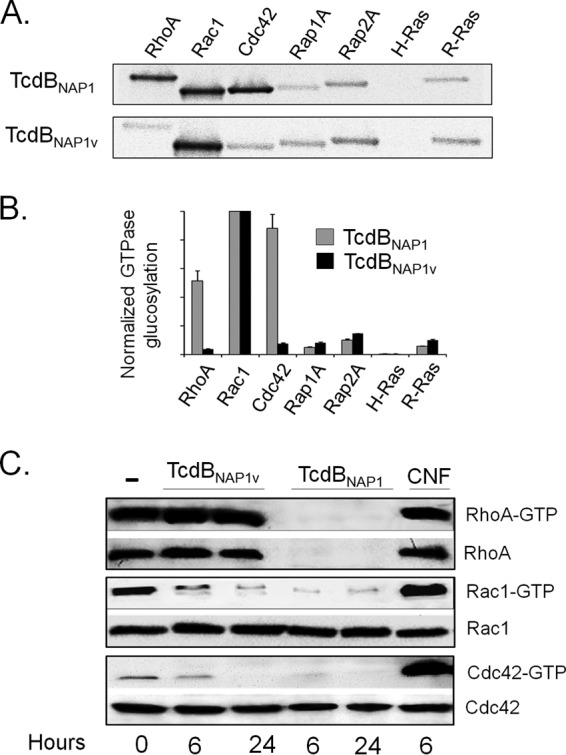
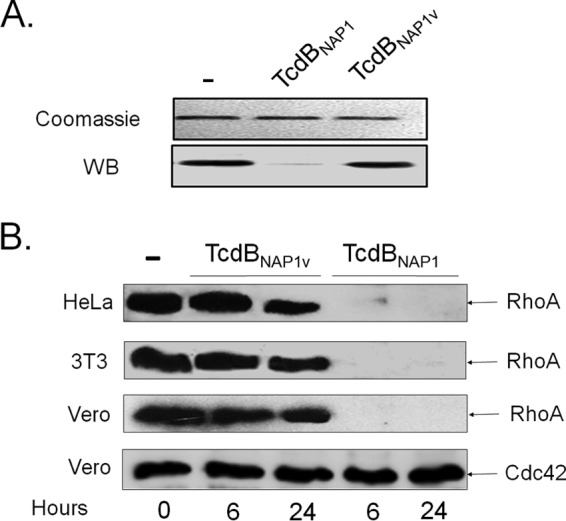
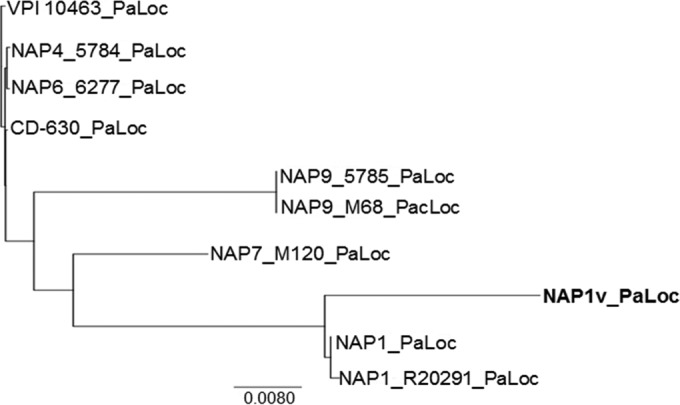
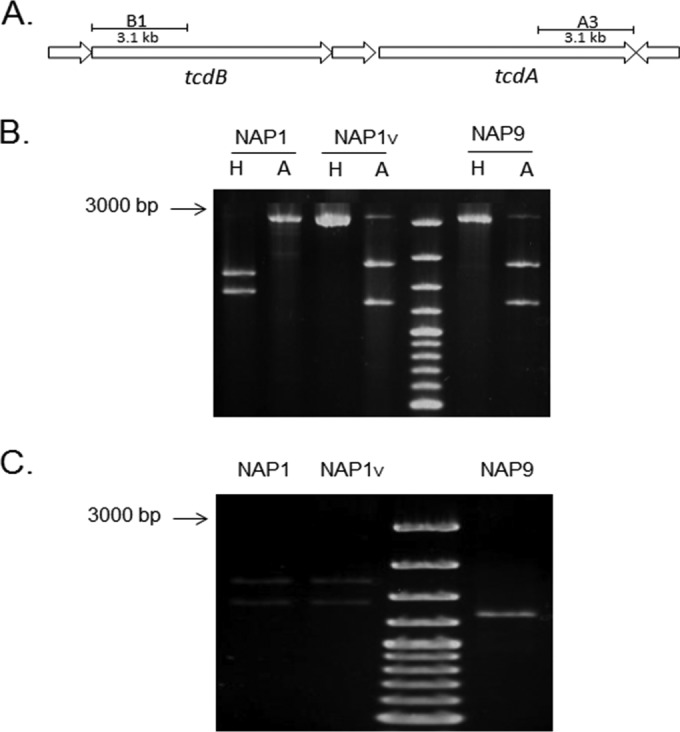
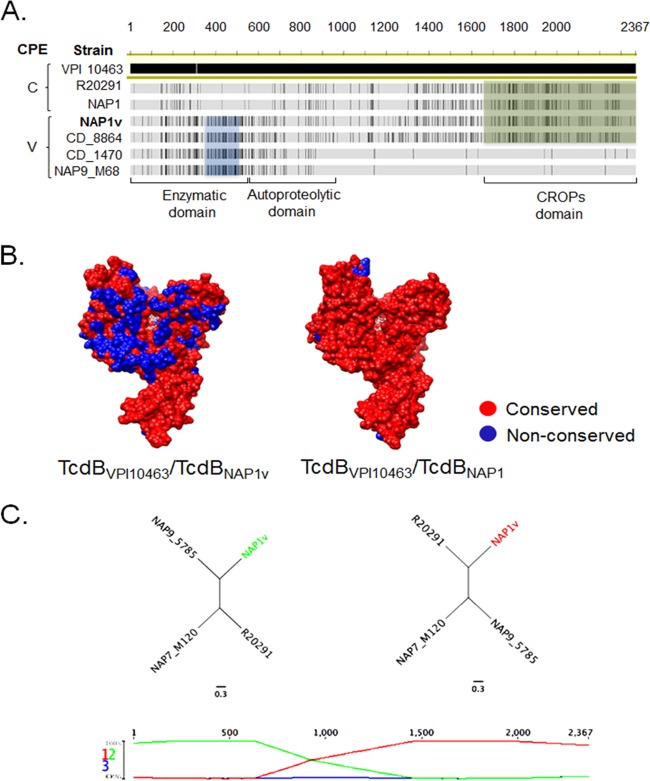
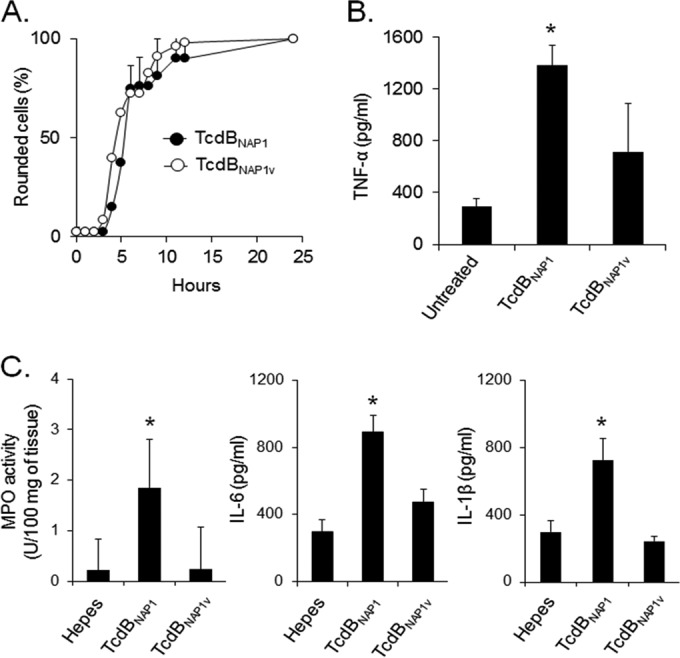
Clostridium difficile strains within the hypervirulent clade 2 are responsible for nosocomial outbreaks worldwide. The increased pathogenic potential of these strains has been attributed to several factors but is still poorly understood. During a C. difficile outbreak, a strain from this clade was found to induce a variant cytopathic effect (CPE), different from the canonical arborizing CPE. This strain (NAP1V) belongs to the NAP1 genotype but to a ribotype different from the epidemic NAP1/RT027 strain. NAP1V and NAP1 share some properties, including the overproduction of toxins, the binary toxin, and mutations in tcdC. NAP1V is not resistant to fluoroquinolones, however. A comparative analysis of TcdB proteins from NAP1/RT027 and NAP1V strains indicated that both target Rac, Cdc42, Rap, and R-Ras but only the former glucosylates RhoA. Thus, TcdB from hypervirulent clade 2 strains possesses an extended substrate profile, and RhoA is crucial for the type of CPE induced. Sequence comparison and structural modeling revealed that TcdBNAP1 and TcdBNAP1V share the receptor-binding and autoprocessing activities but vary in the glucosyltransferase domain, consistent with the different substrate profile. Whereas the two toxins displayed identical cytotoxic potencies, TcdBNAP1 induced a stronger proinflammatory response than TcdBNAP1V as determined in ex vivo experiments and animal models. Since immune activation at the level of intestinal mucosa is a hallmark of C. difficile-induced infections, we propose that the panel of substrates targeted by TcdB is a determining factor in the pathogenesis of this pathogen and in the differential virulence potential seen among C. difficile strains.


Figures

FIG 1
FIG 1
PFGE and core genome-based analysis of the phylogenetic relatedness of NAP1 strains analyzed. (A) Two different SmaI macrorestriction patterns were detected, 001 and 279. The variant NAP1 strain was allocated to the latter group, and thus, we named it NAP1V. NAP4 (TcdA+ TcdB+) and NAP9 (TcdA TcdB+) strains were included in the dendrogram for comparative purposes. (B) A phylogenetic reconstruction based on core SNPs revealed that the NAP1V strain was more closely related to NAP1 reference strains and clinical isolates than to contemporary NAP2, NAP4, NAP6, and NAP9 clinical isolates (four-digit identifiers after the PFGE pattern) and to CD_630 and VPI 10463 strains. The genomes of reference NAP1/RT027 (CD196, R20291, B1-12, and BI17), NAP9/RT017 (M68), CD_630, and VPI 10463 strains were included in the analysis to validate the results of the PFGE typing method.
FIG 2
FIG 2
The NAP1V strain produces increased amounts of TcdA and TcdB. (A) Twenty-four-hour bacterium-free supernatants were titrated by 10-fold dilutions on HeLa cell monolayers. Twenty-four hours after inoculation with the indicated supernatant, the dilution inducing a cytopathic effect (CPE) in 50% of the cells was calculated by visual examination under the microscope. Each bar represents the means ± standard deviations of CPE50 from three replicates. *, P < 0.05 (one-way Kruskal-Wallis test followed by Mann-Whitney U test). (B) Proteins from bacterium-free supernatants were precipitated and separated by 7.5% SDS-PAGE. Proteins were electrotransferred to PVDF membranes and probed with monoclonal antibodies to TcdA and TcdB. (C) Total RNA was prepared from the indicated strains at 5, 8, and 24 h during the growth curve. RNA was retrotranscribed, and cDNA was quantified by RT-PCR using primers specific for tcdA and tcdB. Results displayed represent the means ± standard deviations from three independent experiments. *, P < 0.05 compared to NAP4; **, P < 0.05 compared to NAP1 (one-way analysis of variance with Bonferroni's correction).
FIG 3
FIG 3
The NAP1V strain induces a variant CPE. HeLa cells, Vero cells, and 3T3 fibroblasts were treated with TcdBNAP1 and TcdBNAP1V. Cells were treated until a CPE was achieved in 100% of the cells. Images obtained by phase-contrast microscopy show rounding as well as detachment of the cells caused only by TcdBNAP1V. In order to see actin cytoskeleton modifications, fibroblasts were stained with fluorescein isothiocyanate-phalloidin. TcdBNAP1-treated cells show a classical arborizing effect. TcdBNAP1V-treated cells that had not been detached were fixed and show cell rounding without an arborizing effect. Cells were visualized with a Nikon Eclipse 80i fluorescence microscope. Effects on cells induced by the toxins were visualized by scanning electron microscopy (SEM) using an S-3700N (Hitachi) electron microscope.
FIG 4
FIG 4
The NAP1V strain does not glucosylate RhoA. (A) TcdBNAP1 and TcdBNAP1V were tested for their ability to glycosylate a panel of recombinant GTPases using UDP-[14C]glucose as a cosubstrate. Labeled bands were detected by phosphorimaging analysis. (B) The band intensities of the GTPase glycosylation were quantified by densitometry. Each experiment was normalized to Rac1 signal. Means ± standard deviations from three independent experiments are shown. (C) Effect of TcdBNAP1 and TcdBNAP1V on the activation state of small GTPases. 3T3 fibroblasts were intoxicated with TcdBNAP1 and TcdBNAP1V for the indicated times. After treatment, cells were lysed. One part of the lysates was used as a control for total amount of GTPases, and the other one was incubated with PBD-GST or RBD-GST-Sepharose beads. Active proteins were pulled down and analyzed by Western blotting. GTPases were detected using anti-RhoA, anti-Rac, and anti-Cdc42, respectively. Cells treated with TcdBNAP1 show inactivation of RhoA, whereas cells intoxicated with TcdBNAP1V do not. Cytotoxic necrotizing factor 1 (CNF) from Escherichia coli was used as a positive control for GTPase activation. Negative-control cells were left untreated.
FIG 5
FIG 5
A monoclonal antibody to RhoA detects modification of this small GTPase by TcdBNAP1 but not by TcdBNAP1V. (A) Recombinant purified RhoA was incubated with TcdBNAP1 and TcdBNAP1V in the presence of UDP-glucose. The preparations were separated by SDS-PAGE and detected by Coomassie blue staining. Parallel samples were transferred to PVDF membranes and developed by Western blotting (WB) using the monoclonal antibody to RhoA. (B) HeLa cells, 3T3 fibroblasts, and Vero cells were treated for the indicated times with TcdBNAP1 or TcdBNAP1V. Cell lysates of treated cells and nontreated control cells were separated by SDS-PAGE, transferred to PVDF membranes, and revealed with the monoclonal antibody to RhoA by Western blotting. As a loading control, membranes were also revealed with a monoclonal antibody to Cdc42.
FIG 6
FIG 6
Phylogenetic relationship of the pathogenicity locus (PaLoc) of NAP1V and NAP1 strains to that of reference strains (VPI 10463, CD_630, NAP7/RT078_M120, NAP9/RT017_M68, and NAP1/RT027_R20291) and clinical isolates (NAP4, NAP6, and NAP9). The PaLoc sequence of NAP1V clustered together with those of clinical (NAP1-001_5768) and reference NAP1/027 (R20291) strains rather than with sequences from TcdA TcdB+ variant strains (NAP9/017).
FIG 7
FIG 7
Toxinotyping of NAP1 strains. The polymorphisms obtained from the B1 and A3 regions of the tcdA and tcdB genes were analyzed by digestion with AccI (A) and HindIII (H) restriction enzymes. (A) Representation of the amplified regions. (B) The restriction polymorphisms of the tcdB fragments from the NAP1V (toxinotype XXII) and the tcdA-negative tcdB+ NAP9 (toxinotype VIII) strains are indistinguishable and different from the corresponding pattern from the NAP1 strain. (C) The NAP1V and NAP1 (toxinotype III) strains have the same restriction pattern of the tcdA fragment.
FIG 8
FIG 8
TcdBNAP1V shares with TcdBNAP1 the receptor-binding domain but not the enzymatic domain. (A) Sequence alignment of (i) variant toxins B from NAP9_M68, CD_1470, and CD_8864 reference strains inducing a variant (V) CPE; (ii) TcdBNAP1 from a clinical isolate and a reference epidemic NAP1/RT027 strain (R20291) inducing a classic (C) CPE; and (iii) TcdBNAP1V. Black lines represent disagreements in the sequence of TcdBVPI10463, which was selected as a reference for the alignment. The blue box highlights a distinct glucosyltransferase region shared between NAP1V and other variant strains. The green box shows sequence stretches in the repetitive CROPs domains shared between TcdBNAP1, TcdBR20291, and TcdBNAP1V. (B) Comparison of the TcdBNAP1 and TcdBNAP1V sequences in the context of the TcdB GTD structure (PDB 2BVM, VPI 10463 sequence). Sequence conservation on the putative GTPase-binding face compared to the GTD from C. difficile VPI 10463 with NAP1 and NAP1V TcdB GTD structures is shown (red, conserved; blue, not conserved). UDP-glucose is depicted in white in the GTD active site. (C) Resulting recombination detection graphs using TcdB sequences from strains NAP9 (M68, RT017 reference strain), R20291 (epidemic NAP1/RT027 reference strain), NAP7 (epidemic M120, RT078 reference strain), and NAP1V. Signs of possible recombination events are represented as changes in the topology graphs (first row) that appear at the most probable topology between the segments. The cross of the topological lines (green and red lines) indicates recombination breakpoints. Resulting trees are compatible with a scenario in which TcdBNAP1V emerged through recombination of tcdB sequences from NAP9 and NAP1 strains.
FIG 9
FIG 9
TcdBNAP1V has the same cytotoxic potency as TcdBNAP1 but induces fewer proinflammatory reactions. (A) HeLa cells were treated with equal concentrations (10 pM) of purified TcdBNAP1 and TcdBNAP1V. The percentage of cells showing a toxin-induced CPE was calculated at the indicated times. (B) RAW cells were incubated for 6 h with equal concentrations (0.5 nM) of purified TcdBNAP1 and TcdBNAP1V. After incubation, the amount of TNF-α released in the supernatant was determined by ELISA. Each bar represents the mean ± standard deviation from three independent experiments. (C) Mouse ligated ileal loops were inoculated with 10 μg of purified TcdBNAP1 and TcdBNAP1V for 4 h. After treatment, MPO activity and inflammatory cytokine (IL-1β and IL-6) levels were determined. Means ± standard deviations, n ≥ 5. *, P < 0.05, compared to the groups without asterisk (one-way analysis of variance with Bonferroni's correction).

References

    1. Kelly CP, LaMont JT. 2008. Clostridium difficile—more difficult than ever. N Engl J Med 359:1932–1940. doi:10.1056/NEJMra0707500. - DOI - PubMed
    1. Voth D, Ballard J. 2005. Clostridium difficile toxins: mechanism of action and role in disease. Clin Microbiol Rev 18:247–263. doi:10.1128/CMR.18.2.247-263.2005. - DOI - PMC - PubMed
    1. Hundsberger T, Braun V, Weidmann M, Leukel P, Sauerborn M, von Eichel-Streiber C. 1997. Transcription analysis of the genes tcdA-E of the pathogenicity locus of Clostridium difficile. Eur J Biochem 244:735–742. doi:10.1111/j.1432-1033.1997.t01-1-00735.x. - DOI - PubMed
    1. Spigaglia P, Mastrantonio P. 2002. Molecular analysis of the pathogenicity locus and polymorphism in the putative negative regulator of toxin production (TcdC) among Clostridium difficile clinical isolates. J Clin Microbiol 40:3470–3475. doi:10.1128/JCM.40.9.3470-3475.2002. - DOI - PMC - PubMed
    1. Just I, Selzer J, Wilm M, von Eichel-Streiber C, Mann M, Aktories K. 1995. Glucosylation of Rho proteins by Clostridium difficile toxin B. Nature 375:500–503. doi:10.1038/375500a0. - DOI - PubMed

Publication types

MeSH terms

Associated data

LinkOut - more resources