. 2016 Jan 12:17:25.
doi: 10.1186/s12859-015-0862-z.

BayesFlow: latent modeling of flow cytometry cell populations

Affiliations

BayesFlow: latent modeling of flow cytometry cell populations

Kerstin Johnsson et al. BMC Bioinformatics. .

Erratum in

Abstract

Background: Flow cytometry is a widespread single-cell measurement technology with a multitude of clinical and research applications. Interpretation of flow cytometry data is hard; the instrumentation is delicate and can not render absolute measurements, hence samples can only be interpreted in relation to each other while at the same time comparisons are confounded by inter-sample variation. Despite this, most automated flow cytometry data analysis methods either treat samples individually or ignore the variation by for example pooling the data. A key requirement for models that include multiple samples is the ability to visualize and assess inferred variation, since what could be technical variation in one setting would be different phenotypes in another.

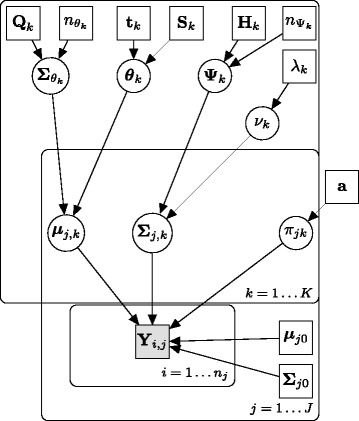
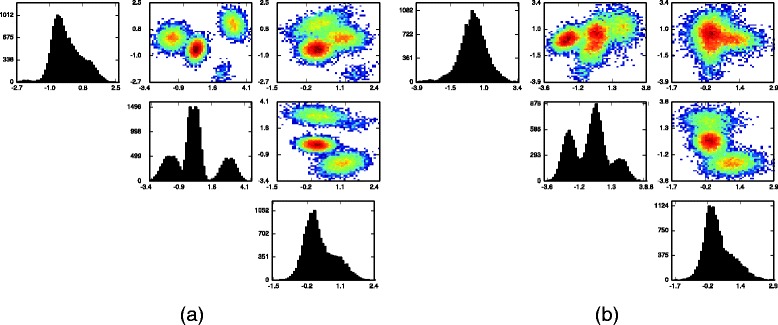
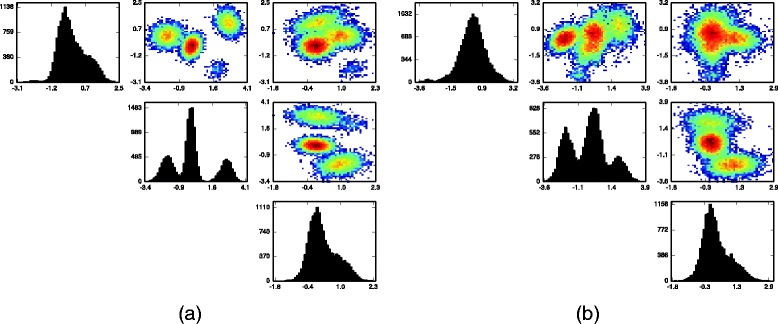
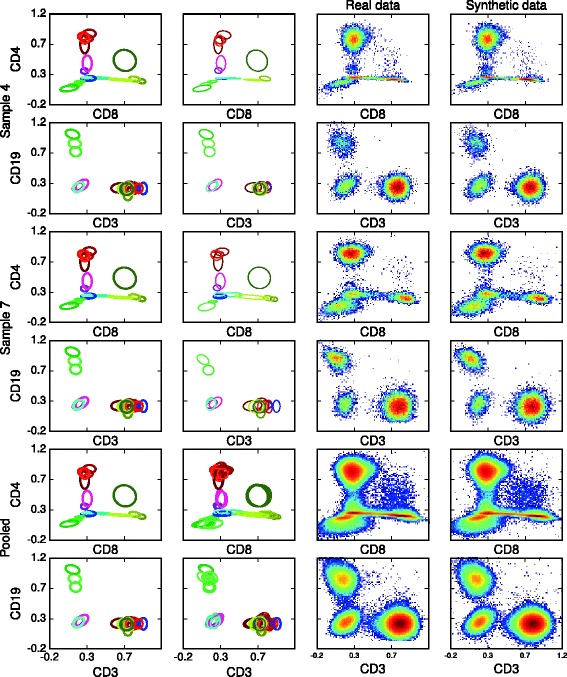
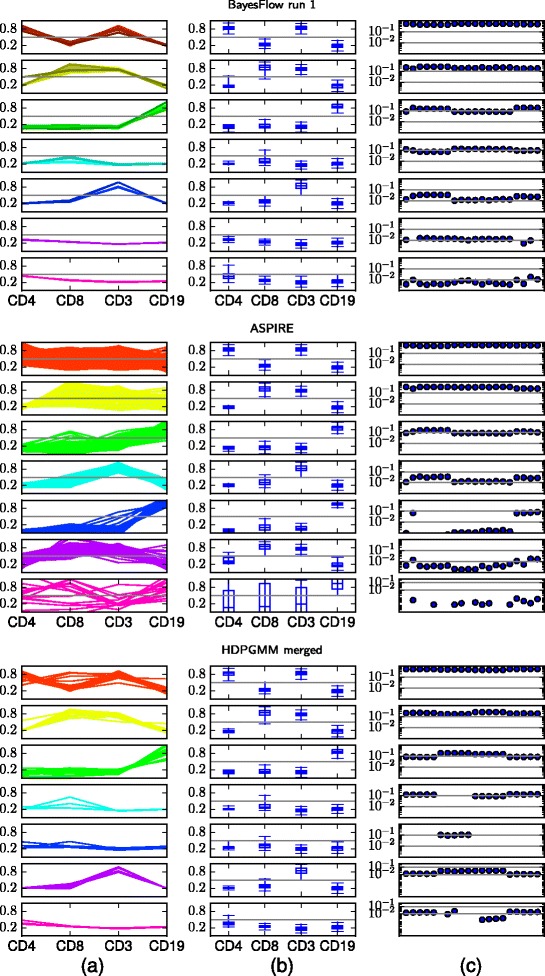
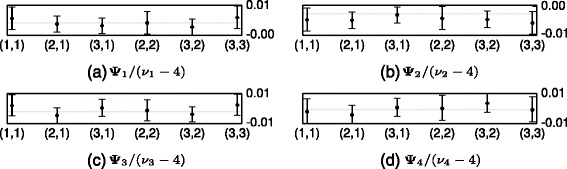
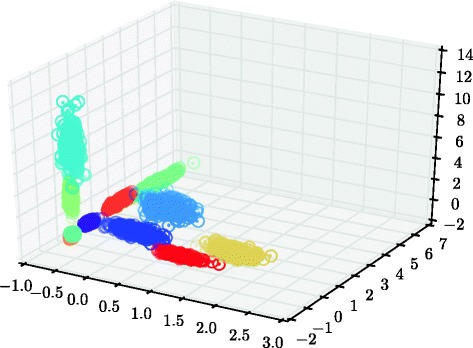
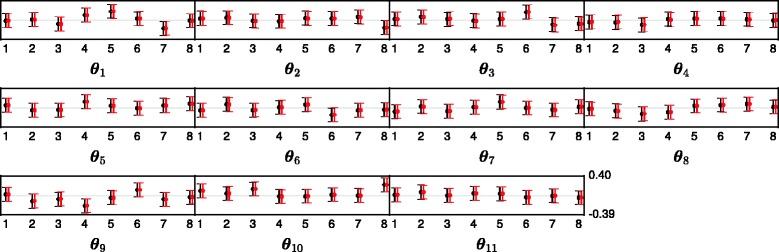
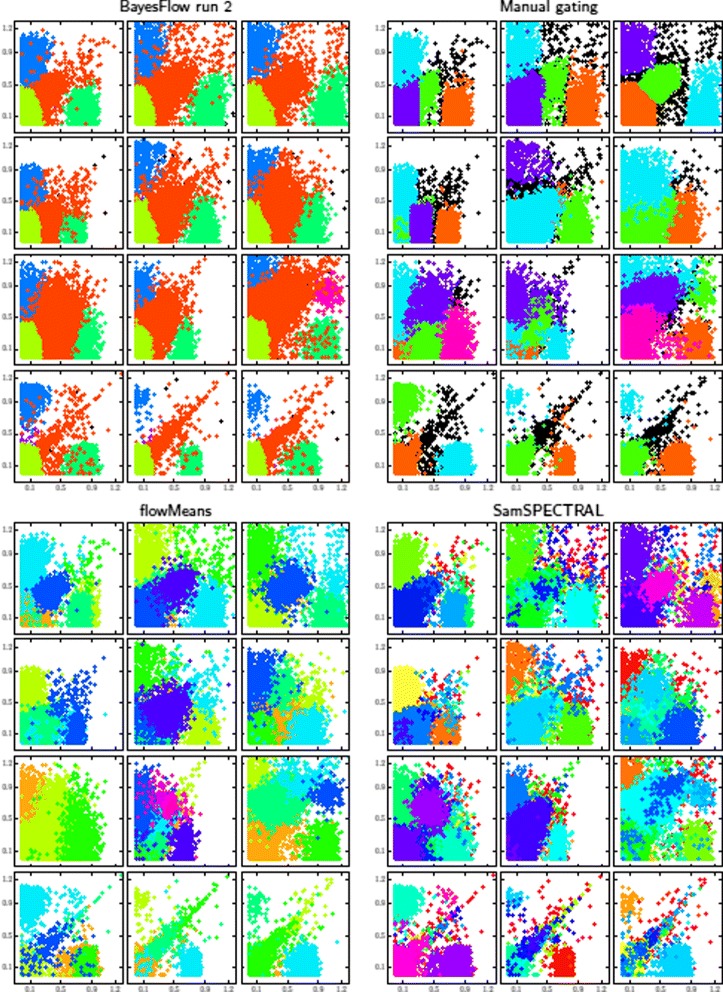
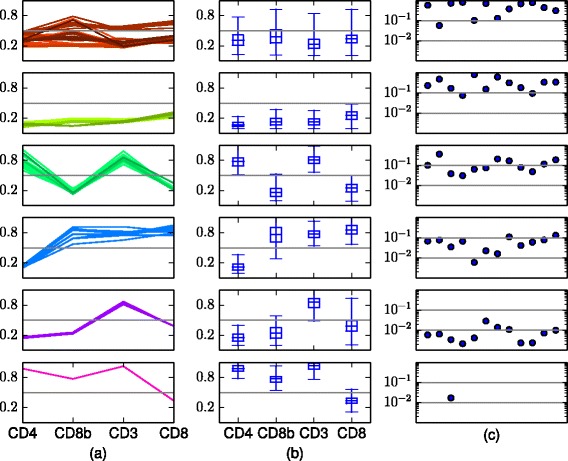
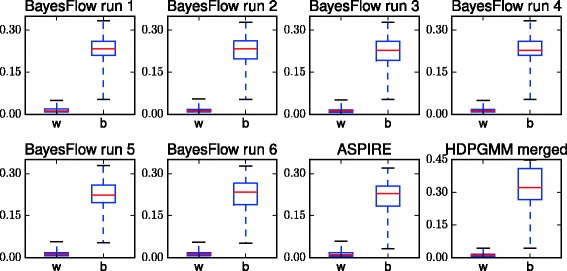
Results: We introduce BayesFlow, a pipeline for latent modeling of flow cytometry cell populations built upon a Bayesian hierarchical model. The model systematizes variation in location as well as shape. Expert knowledge can be incorporated through informative priors and the results can be supervised through compact and comprehensive visualizations. BayesFlow is applied to two synthetic and two real flow cytometry data sets. For the first real data set, taken from the FlowCAP I challenge, BayesFlow does not only give a gating which would place it among the top performers in FlowCAP I for this dataset, it also gives a more consistent treatment of different samples than either manual gating or other automated gating methods. The second real data set contains replicated flow cytometry measurements of samples from healthy individuals. BayesFlow gives here cell populations with clear expression patterns and small technical intra-donor variation as compared to biological inter-donor variation.

Conclusions: Modeling latent relations between samples through BayesFlow enables a systematic analysis of inter-sample variation. As opposed to other joint gating methods, effort is put at ensuring that the obtained partition of the data corresponds to actual cell populations, and the result is therefore directly biologically interpretable. BayesFlow is freely available at GitHub.


Figures

Fig. 1
Fig. 1
Directed acyclic graph describing the Bayesian hierarchical model. Square boxes indicate that the values are known
Fig. 2
Fig. 2
a One and two dimensional histograms for one synthetic flow cytometry sample containing 15,000 data points; b histograms of 15,000 data points drawn uniformly from the pooled data from the synthetic data experiment
Fig. 3
Fig. 3
a One and two dimensional histograms of 15,000 posterior draws of Y for the flow cytometry sample displayed in Fig. 2 a; b histograms of 15,000 posterior draws of Y drawn uniformly from all the flow cytometry samples, thus matching Fig. 2 b
Fig. 4
Fig. 4
BayesFlow component parameter representations of inferred latent clusters (first column) and mixture components (second column) together with histograms of real data (third column) and synthetic data generated from the model (fourth column) for healthyFlowData. The center of each ellipse is the mean and each semi-axis is an eigenvector with length given by the corresponding eigenvalue of the projected covariance matrix. For the latent clusters the parameters (θk,1(νkd1)Ψk) are shown, for the mixture components the parameters (μ jk,Σ jk) are shown. Each component or cluster is depicted with the same color as in Fig. 5; different shades of same color corresponds to latent clusters that have been merged
Fig. 5
Fig. 5
Summary statistics of inferred cell populations in BayesFlow, ASPIRE and HDPGMM, ordered by population size. For HDPGMM, the six largest components after merging are shown, the remaining components have together at most 0.0013 of the cells in a sample. The noise component in BayesFlow has at most 0.004 of the cells in a sample. a Locations μ jk of mixture components that represent each population, in each sample, cf. Fig. 13. b Box plots of the soft clusters in the pooled data, cf. Fig. 13. c Population proportions across flow cytometry samples
Fig. 6
Fig. 6
Cell population which is hard to detect in the GvHD dataset
Fig. 7
Fig. 7
The posterior mean of the mixture component centers, μ jk (dots), and the true cluster centers (circles) in the small synthetic data experiment
Fig. 8
Fig. 8
The difference between the true value of each entry in each θ k and the approximated marginal posterior distribution generated by the MCMC sampler in the small synthetic data experiment. The black dot represents the median and the vertical line goes between the 2.5 and 97.5 % quantiles. The light gray horizontal line is the 0 line
Fig. 9
Fig. 9
The difference between the true value of each of the entries in Ψ k/(ν k−4) and the approximated marginal posterior distribution generated by the MCMC sampler in the synthetic data experiment. The black dot shows the median, and the black vertical line goes between the 2.5 and 97.5 % quantiles. The light gray horizontal line is the 0 line
Fig. 10
Fig. 10
The posterior mean of the mixture component centers, μ jk (dots), and the true cluster centers (circles) in the large synthetic data experiment for the first three dimensions
Fig. 11
Fig. 11
The difference between the true value of each entry in each θ k and the approximated marginal posterior distribution generated by the MCMC sampler in the large synthetic data experiment. The black dot represents the median and the vertical line goes between the 2.5 and 97.5 % quantiles. To get the axis on the same scale for all the clusters, they are scaled by the standard deviation of μ k. The light gray horizontal line is the 0 line. The red dot and lines is the same however where one uses the true μ k to estimate θ k, rather then the μ k obtained by taking the posterior means of the mixtures
Fig. 12
Fig. 12
Gated events according to four methods (BayesFlow, manual and the two top performers in FlowCAP I) of the twelve samples in the GvHD dataset, projected onto the two first dimensions. For BayesFlow, the run with least accordance with manual gating, run 2, is shown. Similar plots for ASPIRE and HDPGMM as well as BayesFlow run 1 are shown in the Additional file 1: Figure S6
Fig. 13
Fig. 13
Summary statistics of the six cell populations obtained by BayesFlow (run 2) in the dataset GvHD. The outlier component has at most 0.0019 of the cells in a sample. a Each panel displays the locations μ jk of all mixture components that represent the population, across all samples. Different shades of a color represent different latent components k. b Box plots of the soft clusters in the pooled data. The boxes go between the quantiles q km,0.25 and q km,0.75, the whiskers extend to q km,0.01 and q km,0.99. The α-quantile for (merged) component k in dimension m, q km,α, is here defined as qkm,α=minij{Yijm:α<ij:Yijm<Yijmwijk}. c Population proportions in each of the twelve flow cytometry samples
Fig. 14
Fig. 14
Distances within (w) and between (b) donors as measured by 1 distance between vectors of population sizes. For the six BayesFlow runs and HDPGMM there is very little or no overlap between within-donor and between-donor distances, whereas for ASPIRE there is clear overlap

References

    1. Shapiro HM. Practical Flow Cytometry. Hoboken, New Jersey: John Wiley & Sons; 2005.
    1. Nolan JP, Yang L. The flow of cytometry into systems biology. Brief Funct Genomics and Proteomics. 2007;6(2):81–90. doi: 10.1093/bfgp/elm011. - DOI - PubMed
    1. O’Neill K, Aghaeepour N, Špidlen J, Brinkman R. Flow cytometry bioinformatics. PLoS Comput Biol. 2013;9(12):1003365. doi: 10.1371/journal.pcbi.1003365. - DOI - PMC - PubMed
    1. Chen X, Hasan M, Libri V, Urrutia A, Beitz B, Rouilly V, et al. Automated flow cytometric analysis across large numbers of samples and cell types. Clin Immunol. 2015;157(2):249–60. doi: 10.1016/j.clim.2014.12.009. - DOI - PubMed
    1. Welters MJ, Gouttefangeas C, Ramwadhdoebe TH, Letsch A, Ottensmeier CH, Britten CM, et al. Harmonization of the intracellular cytokine staining assay. Cancer Immunol Immunother. 2012;61(7):967–78. doi: 10.1007/s00262-012-1282-9. - DOI - PMC - PubMed

Publication types