. 2016 Jan 26;113(4):1086-91.
doi: 10.1073/pnas.1522672113. Epub 2016 Jan 11.

Diacylglycerol lipase disinhibits VTA dopamine neurons during chronic nicotine exposure

Affiliations

Diacylglycerol lipase disinhibits VTA dopamine neurons during chronic nicotine exposure

Matthew W Buczynski et al. Proc Natl Acad Sci U S A. .

Abstract

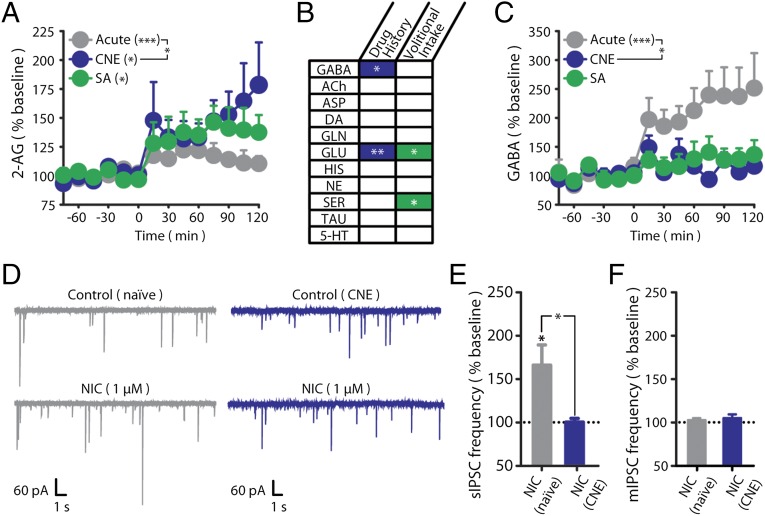
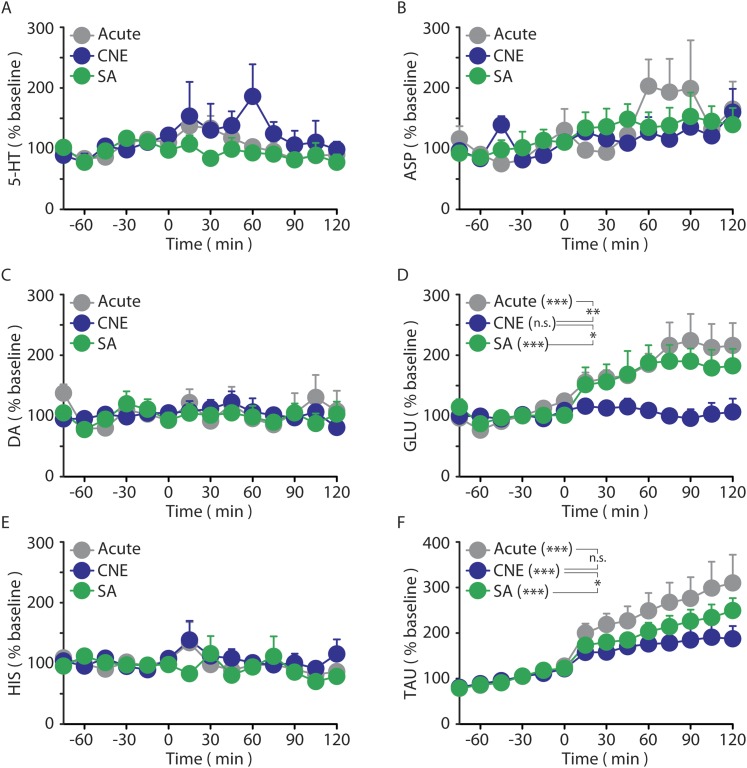
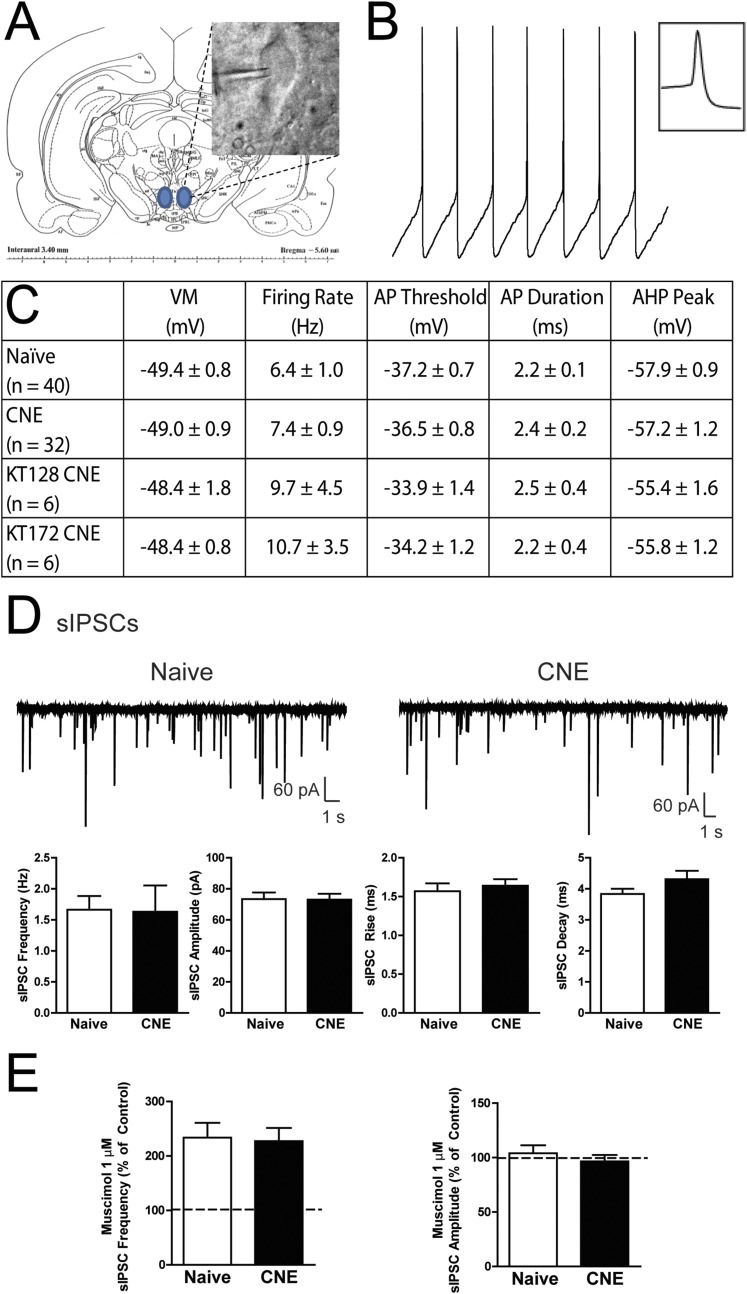
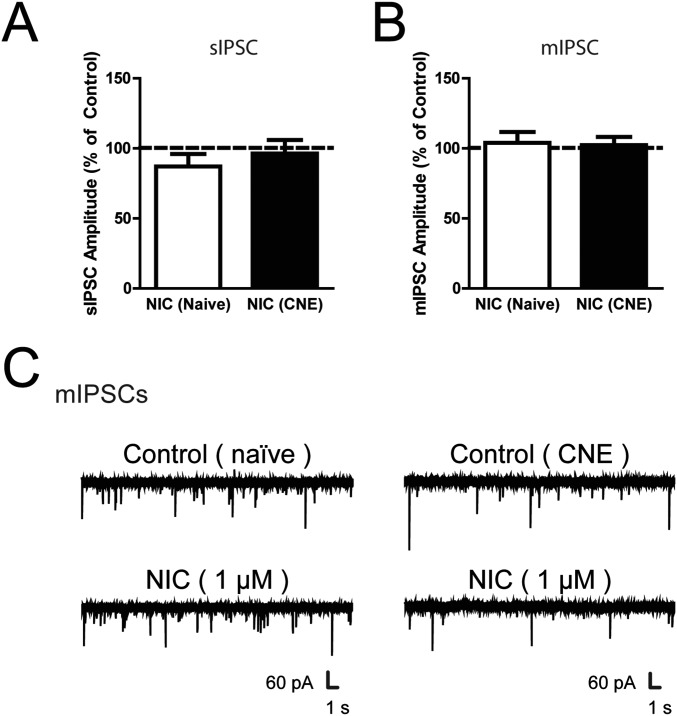
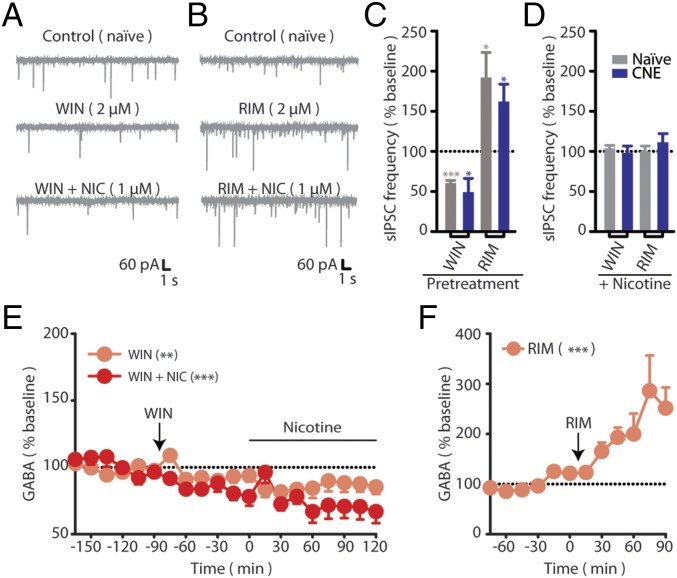
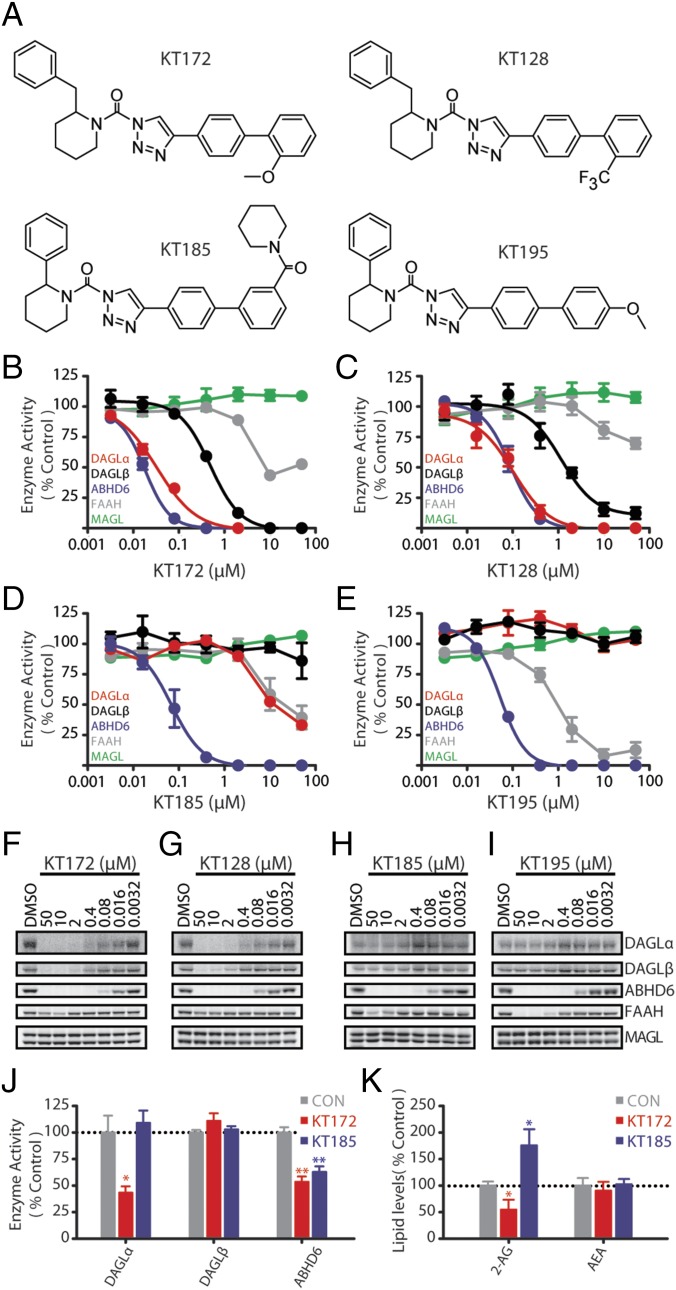
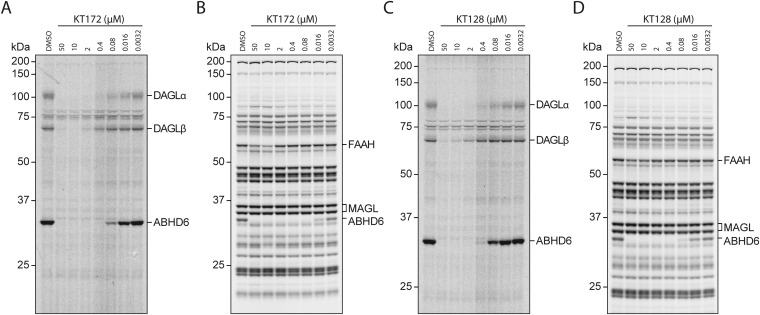
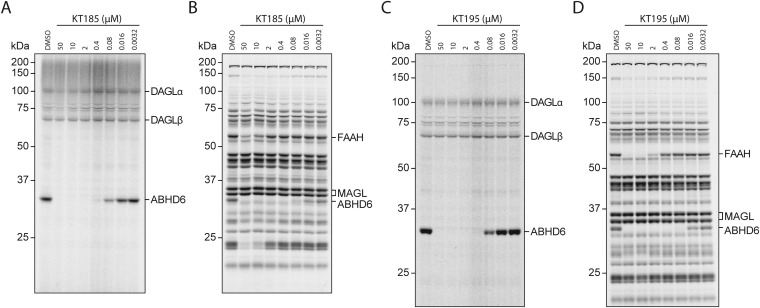
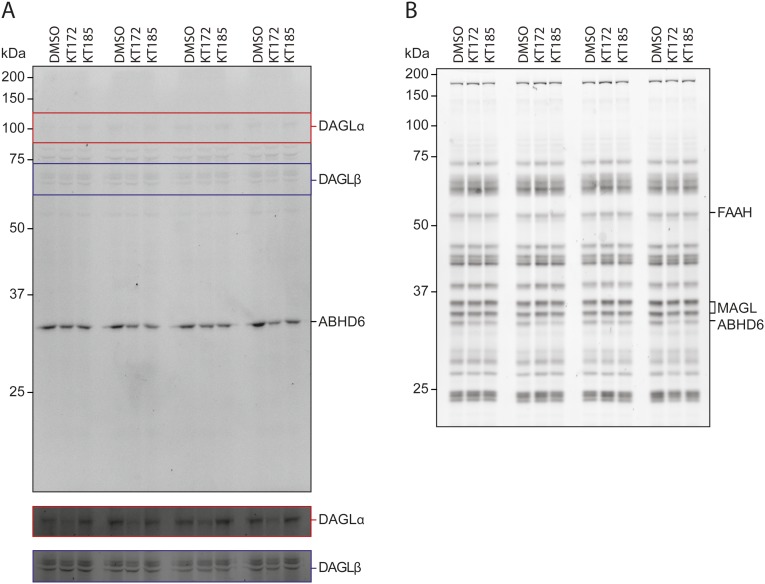
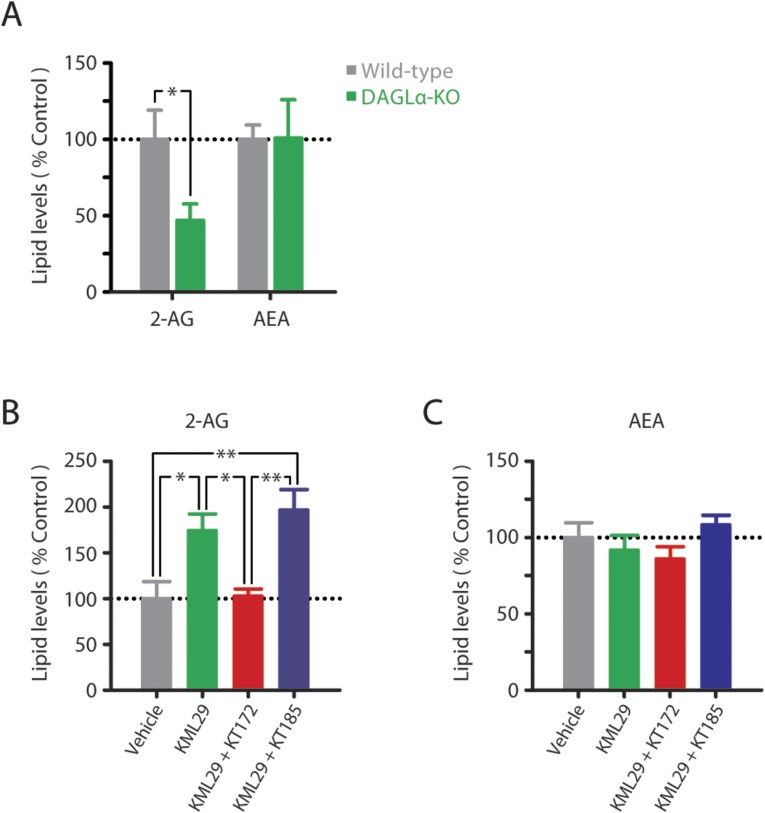
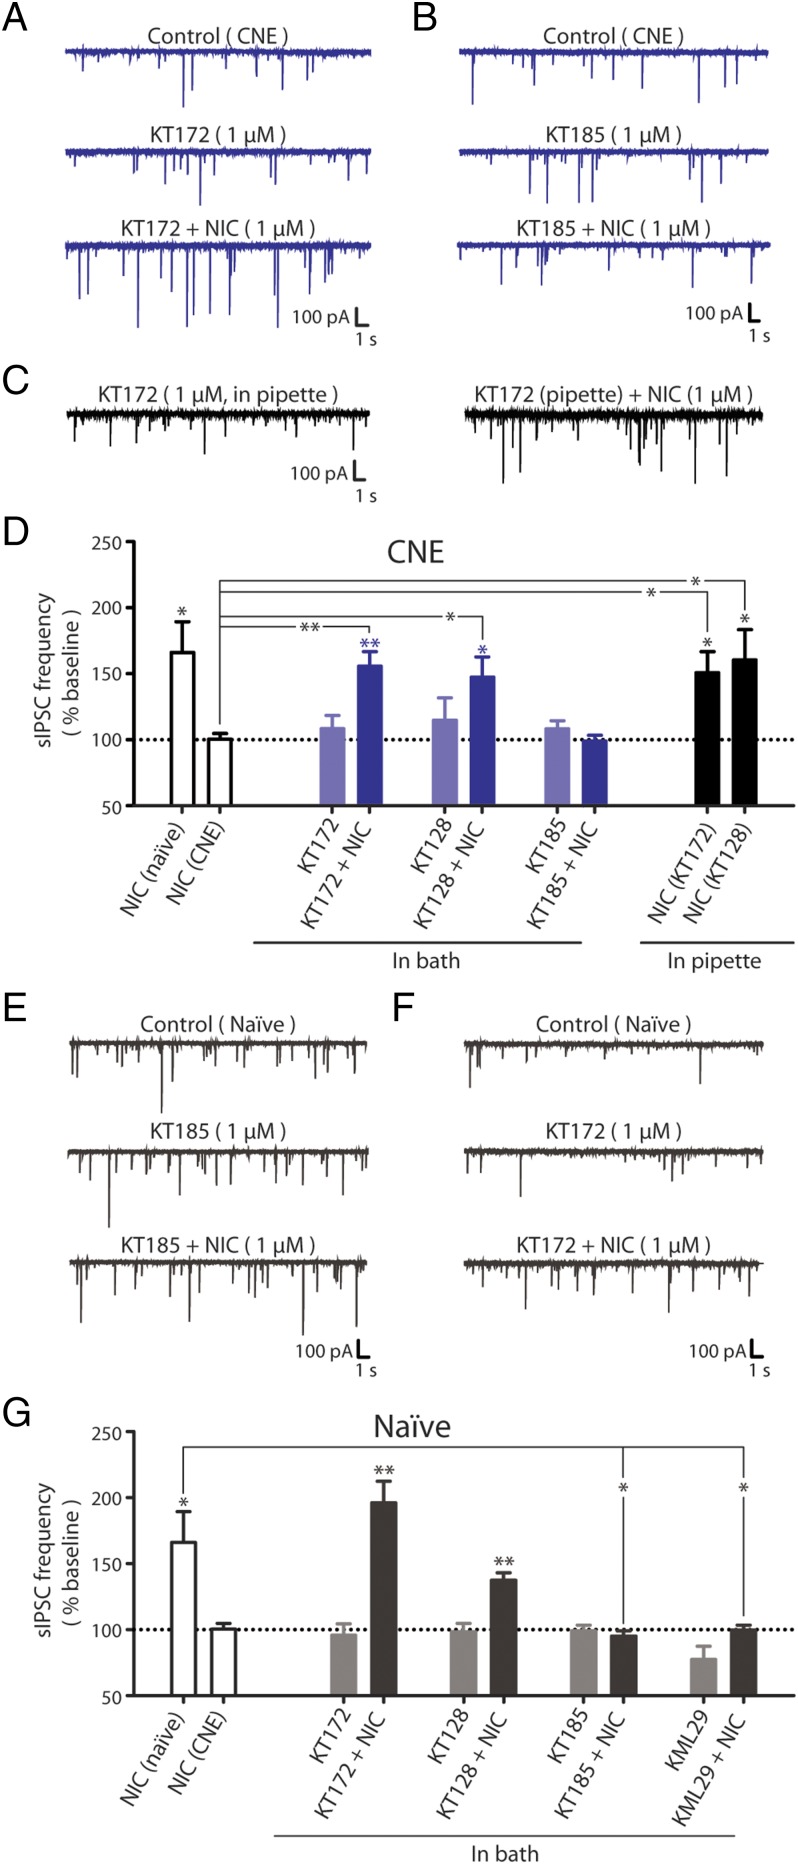
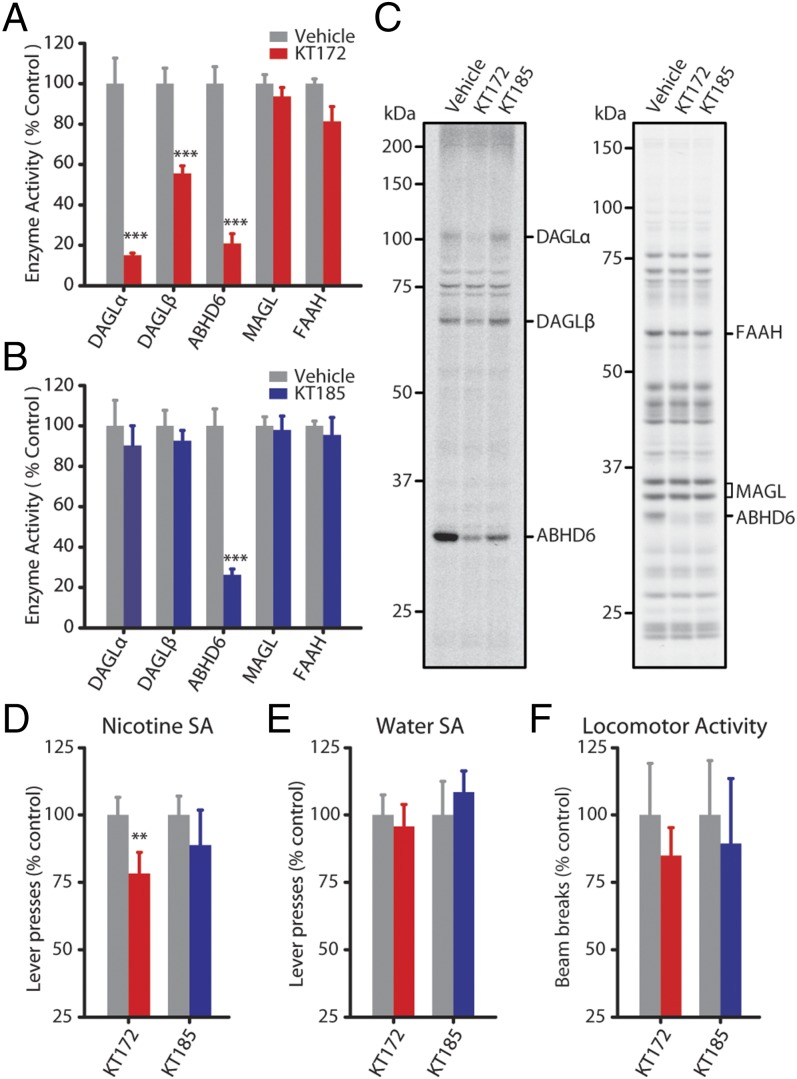
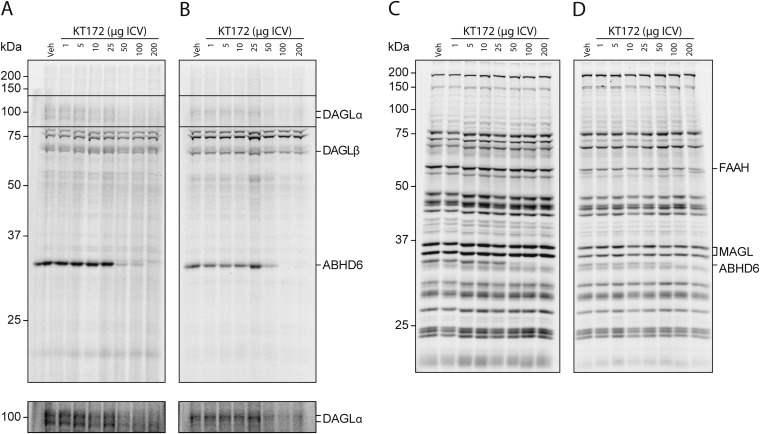
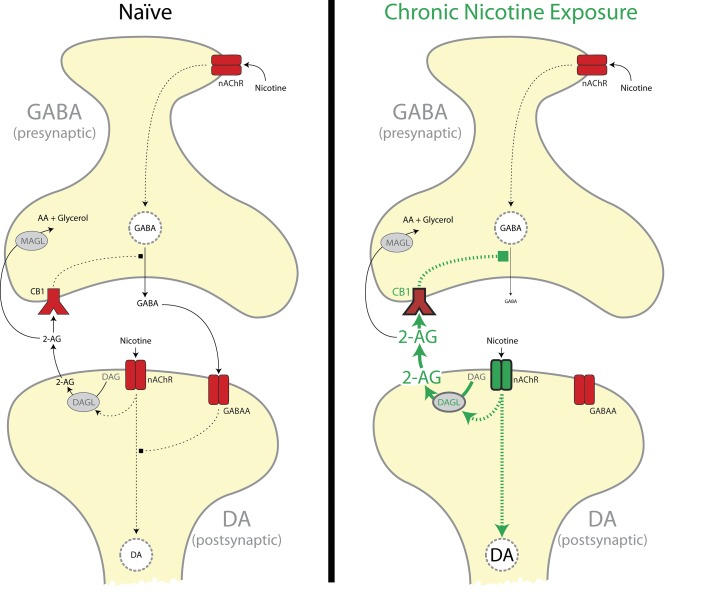
Chronic nicotine exposure (CNE) alters synaptic transmission in the ventral tegmental area (VTA) in a manner that enhances dopaminergic signaling and promotes nicotine use. The present experiments identify a correlation between enhanced production of the endogenous cannabinoid 2-arachidonoylglycerol (2-AG) and diminished release of the inhibitory neurotransmitter GABA in the VTA following CNE. To study the functional role of on-demand 2-AG signaling in GABAergic synapses, we used 1,2,3-triazole urea compounds to selectively inhibit 2-AG biosynthesis by diacylglycerol lipase (DAGL). The potency and selectivity of these inhibitors were established in rats in vitro (rat brain proteome), ex vivo (brain slices), and in vivo (intracerebroventricular administration) using activity-based protein profiling and targeted metabolomics analyses. Inhibition of DAGL (2-AG biosynthesis) rescues nicotine-induced VTA GABA signaling following CNE. Conversely, enhancement of 2-AG signaling in naïve rats by inhibiting 2-AG degradation recapitulates the loss of nicotine-induced GABA signaling evident following CNE. DAGL inhibition reduces nicotine self-administration without disrupting operant responding for a nondrug reinforcer or motor activity. Collectively, these findings provide a detailed characterization of selective inhibitors of rat brain DAGL and demonstrate that excessive 2-AG signaling contributes to a loss of inhibitory GABAergic constraint of VTA excitability following CNE.

Keywords: 2-arachidonoylglycerol; GABA; diacylglycerol lipase; nicotine; ventral tegmental area.


Conflict of interest statement

Conflict of interest statement: B.F.C. is a cofounder and advisor for a biotechnology company interested in developing inhibitors of serine hydrolases as therapeutic targets.

Figures

Fig. 1.
Fig. 1.
Chronic nicotine exposure impairs nicotine-induced GABA release in the rat VTA. (A) Dialysate 2-AG levels before (t −60 to 0 min) and during (t 0–120 min) nicotine exposure in naïve (n = 7), CNE (n = 7), and SA (n = 6) rats. Reprinted by permission from Macmillan Publishers Ltd. (14). (B) Summary of microdialysate neurotransmitter changes between groups during nicotine exposure. Corresponding microdialysate profiles are shown in Fig. S1. (C) Dialysate GABA levels before (t −60 to 0 min) and during (t 0–120 min) nicotine exposure in naïve (n = 7), CNE (n = 7), and SA (n = 6) rats. Baseline GABA levels did not significantly differ between groups. (D) Representative recordings of sIPSCs in VTA DA neurons from naïve (Left) and CNE (Right) rats during the superfusion of 1 µM nicotine (NIC). (E) Summary of sIPSC frequency during superfusion of 1 µM nicotine in VTA DA neurons relative to baseline (dashed line) from naïve (n = 7) and CNE (n = 6) rats. (F) Summary of mIPSC frequency during superfusion of 1 µM nicotine in VTA DA neurons relative to baseline (dashed line) revealed in the presence of 0.5 µM TTX [naïve (n = 6), CNE (n = 8); representative traces are in Fig. S3C]. Dashed lines reflect prenicotine baseline levels (defined as 100%). Data are presented as mean ± SE. *P < 0.05, **P < 0.01, ***P < 0.001.
Fig. S1.
Fig. S1.
Dialysate neurotransmitter responses induced by nicotine exposure (t 0–120 min) in naïve (black), CNE (blue), and SA (green) rats. (A) Nicotine exposure did not alter dialysate 5-HT levels in naïve, CNE, or SA rats. Baseline 5-HT levels did not significantly differ between groups (naïve, 0.25 ± 0.06; CNE, 0.31 ± 0.13; SA, 0.22 ± 0.06 nM). (B) Nicotine exposure did not alter dialysate aspartate (ASP) levels in naïve, CNE, or SA rats. Baseline ASP levels did not significantly differ between groups (naïve, 276.4 ± 57.2; CNE, 364.5 ± 43.8; SA, 371.6 ± 59.2 nM). (C) Nicotine exposure did not alter dialysate DA levels in naïve, CNE, or SA rats. Baseline DA levels did not significantly differ between groups (naïve, 0.28 ± 0.13; CNE, 0.27 ± 0.04; SA, 0.53 ± 0.27 nM). (D) Nicotine exposure altered dialysate glutamate (GLU) levels in naïve and SA rats but not CNE rats. GLU was altered by both drug history (P < 0.01) as well as the volitional nature of nicotine exposure (P < 0.05). Baseline GLU levels were significantly increased by drug history (naïve, 1.5 ± 0.3; CNE, 4.4 ± 0.6 µM; P < 0.001), but were not further altered by the volitional nature of nicotine exposure (CNE, 4.4 ± 0.6; SA, 4.3 ± 0.4 µM). (E) Nicotine exposure did not alter dialysate histamine (HIS) levels in naïve, CNE, or SA rats. Baseline HIS levels did not significantly differ between groups (naïve, 84.0 ± 8.9; CNE, 70.1 ± 11.1; SA, 65.4 ± 8.7 nM). (F) Nicotine exposure increased taurine (TAU) levels in naïve, CNE, and SA rats. TAU was not affected by drug history, but was altered by the volitional nature of nicotine intake (P < 0.05). Baseline TAU levels did not significantly differ between groups (naïve, 5.6 ± 0.6; CNE, 9.3 ± 1.9; SA, 5.0 ± 0.7 µM). Data are presented as mean ± SE. *P < 0.05, **P < 0.01, ***P < 0.001; n.s., not significant.
Fig. S2.
Fig. S2.
Cell characteristics of VTA dopamine neurons. (A) IR-DIC visualization of a VTA DA neuron during electrophysiological recording. (B) Representative current-clamp recording of a VTA DA neuron displaying spontaneous action potential firing in compressed and enlarged (Inset) time scales. (C) Summary of action potential characteristics of VTA DA neurons from naïve and CNE rats including membrane potential (VM), firing rate, action potential (AP) threshold, AP duration, and afterhyperpolarization (AHP). (D) Representative voltage-clamp recordings (Top) and summary of characteristics (Bottom) of sIPSCs in VTA DA neurons from naïve and CNE rats. (E) Summary of the change in sIPSC frequency (Left) and amplitude (Right) with 1 μM muscimol in VTA DA neurons from naïve and CNE rats relative to control (dashed line). Data are presented as mean ± SE.
Fig. S3.
Fig. S3.
VTA dopamine neurons following nicotine exposure. (A and B) Summary of the change in (A) sIPSC and (B) mIPSC amplitude in VTA DA neurons from naïve and CNE rats following 1 μM nicotine. (C) Representative voltage-clamp recordings of mIPSCs in VTA DA neurons from naïve (Left) and CNE (Right) rats during the superfusion of 1 µM nicotine. Data are presented as mean ± SE.
Fig. 2.
Fig. 2.
CB1 influence on VTA GABA signaling is not altered following CNE. (A and B) Representative recordings of sIPSCs from nicotine-naïve rats during the superfusion of (A) 2 µM WIN or (B) 2 µM RIM, followed by 1 µM NIC. (C and D) Summary of sIPSC frequencies from naïve (gray) or CNE (blue) during (C) superfusion of RIM (n = 6 and n = 5) WIN (n = 5 and n = 5) and during (D) subsequent superfusion of nicotine compared with drug-treated baseline (n = 5 in all conditions). (E) Dialysate GABA levels in naïve rats treated with WIN (3 mg/kg i.p., t 0, n = 6) in the absence or presence of IV nicotine (matching the acute group in Fig. 1 A and C). (F) Dialysate GABA levels in CNE rats treated with RIM (3 mg/kg IP, t 0, n = 6) in the absence of nicotine. Data are presented as mean ± SE. *P < 0.05, **P < 0.01, ***P < 0.001.
Fig. 3.
Fig. 3.
Selective inhibitors of rat 2-AG metabolic enzymes. (A) Chemical structures of 1,2,3-triazole urea inhibitors. (BE) Competitive ABPP (n = 3) of (B) KT172, (C) KT128, (D) KT185, and (E) KT195 against endogenous serine hydrolases detected in rat brain proteome in vitro using either the DAGL-tailored probe (HT-01; for DAGLα, DAGLβ, and ABHD6) or broad-spectrum serine hydrolase probe (FP-Rh; for MAGL and FAAH). Proteomes were preincubated with the indicated dose of compound (30 min, 37 °C) followed by labeling with activity-based probes (1 µM FP-Rh or HT-01, 30 min, 37 °C). (FI) Representative gels for each in vitro inhibitor treatment (full gels are in Figs. S4 and S5). (J) Activity of eCB metabolic enzymes following ex vivo incubation of striatal tissue slices with vehicle, 1 µM KT172, or 1 µM KT185 (n = 4, 10 min; full gels are in Fig. S6). (K) Levels of 2-AG and AEA following incubation of striatal tissue slices with vehicle, 1 µM KT172, or 1 µM KT185 (n = 4–6, 4 h). Data are presented as mean ± SE. *P < 0.05, **P < 0.01.
Fig. S4.
Fig. S4.
Full gel images for Fig. 3 showing in vitro activity of 1,2,3-triazole urea inhibitors in rat brain homogenates. Rat membrane proteomes were treated (37 °C, 30 min) with the indicated concentrations of (A and B) KT172 or (C and D) KT128. Proteomes were subsequently analyzed by competitive ABPP with (A and C) HT-01 or (B and D) FP-Rh (1 µM, 37 °C, 30 min) as described in Experimental Procedures.
Fig. S5.
Fig. S5.
Full gel images for Fig. 3 showing in vitro activity of 1,2,3-triazole urea inhibitors in rat brain homogenates. Rat membrane proteomes were treated (37 °C, 30 min) with the indicated concentrations of (A and B) KT185 or (C and D) KT195. Proteomes were subsequently analyzed by competitive ABPP with (A and C) HT-01 or (B and D) FP-Rh (1 µM, 37 °C, 30 min) as described in Experimental Procedures.
Fig. S6.
Fig. S6.
Full gel images for Fig. 3J showing the activity of serine hydrolases in rat striatal slices. Rat striatal slices were treated for 10 min at room temperature with either vehicle (DMSO, 0.02%), KT172 (1 µM), or KT185 (1 µM). Rat membrane proteomes were immediately processed and analyzed by ABPP using either the (A) HT-01 or (B) FP probe (1 µM, 37 °C, 30 min) as described in Experimental Procedures.
Fig. S7.
Fig. S7.
Endocannabinoid levels in striatal slices. (A) Levels of 2-AG and AEA in striatal tissue slices of wild-type and DAGLα-KO mice incubated in aCSF (n = 6–8, 4 h). (B and C) Levels of (B) 2-AG and (C) AEA following incubation of rat striatal tissue slices with vehicle, 1 µM KML29, 1 µM KML29 + 1 µM KT172, or 1 µM KML29 + µM KT185 (n = 5–6, 4 h). Experiments were carried out as described in Experimental Procedures. Data are presented as mean ± SE. *P < 0.05, **P < 0.01.
Fig. 4.
Fig. 4.
DAGL inhibition restores nicotine-induced GABA release in rats with a history of nicotine exposure. (A and B) Representative recordings of sIPSCs in VTA DA neurons from CNE rats during superfusion of (A) 1 µM KT172 followed by 1 µM NIC and (B) 1 µM KT185 followed by 1 µM NIC. (C) Representative recordings of sIPSCs in a VTA DA neuron from a CNE rat during administration of KT172 (1 µM in the pipette solution) before (Left) and during (Right) superfusion of 1 µM NIC. (D) Summary of sIPSC frequencies in VTA DA neurons from CNE rats during superfusion of either 1 µM KT172 (n = 5), 1 µM KT128 (n = 6), or 1 µM KT185 (n = 6) and during subsequent nicotine superfusion. Summary of sIPSC frequencies in VTA DA neurons before and during nicotine superfusion with either 1 µM KT172 (n = 6) or 1 µM KT128 (n = 6) in the pipette solution. Attenuation of 2-AG clearance in nicotine-naïve subjects recapitulates the effects of CNE. (E and F) Representative recordings of sIPSCs in VTA DA neurons from naïve rats during superfusion of (E) 1 µM KT185 followed by 1 µM NIC and (F) 1 µM KT172 followed by 1 µM NIC. (G) Summary of sIPSC frequencies in VTA DA neurons from naïve rats during superfusion of either 1 µM KT172 (n = 5), 1 µM KT128 (n = 5), 1 µM KT185 (n = 6), or 1 µM KML29 (n = 8) and during subsequent nicotine superfusion. The response to NIC in naïve and CNE rats is shown for comparison [open bars (Left) from Fig. 1]. Data are presented as mean ± SE. *P < 0.05, **P < 0.01.
Fig. 5.
Fig. 5.
Nicotine self-administration is reduced by DAGL inhibition. (A and B) Gel-based ABPP using HT-01 and FP-Rh assessed the efficacy and selectivity of KT172 and KT185 in vivo by ICV injection. KT172 (A) (100 µg, 4 h, n = 4) reduces DAGLα, DAGLβ, and ABHD6 activity, whereas treatment with KT185 (B) (100 µg, 4 h, n = 4) reduces ABHD6 activity with negligible activity against DAGLs. (C) Representative HT-01 (Left) and FP-Rh (Right) gels for each inhibitor. (D) Pretreatment with KT172 (100 µg, 4 h, n = 16), but not KT185 (100 µg, 4 h, n = 10), significantly reduced nicotine self-administration (75 µg/kg per infusion; FR-1 reinforcement schedule). (E) Pretreatment with either KT172 (n = 9) or KT185 (n = 9) has no effect on oral water self-administration. (F) Pretreatment with either KT172 (n = 9) or KT185 (n = 9) has no effect on motor activity. Data are presented as mean ± SE. **P < 0.01, ***P < 0.001.
Fig. S8.
Fig. S8.
Full gel profiles of the in vivo activity in rats treated with the indicated amounts of KT172 by ICV injection. Membrane proteomes from KT172-treated rats (4 h) were analyzed by competitive ABPP: either (A) rat whole brain incubated with HT-01 (1 µM), (B) VTA homogenates incubated with HT-01 (1 µM), (C) rat whole brain incubated with FP (1 µM), or (D) VTA homogenates incubated with FP (1 µM). Experiments were carried out as described in Experimental Procedures.
Fig. S9.
Fig. S9.
Model of on-demand 2-AG regulation of VTA GABA release. In naïve rats (Left), nicotine activates nAChRs on both DA projection neurons and GABA synapses onto DA neurons in the VTA. Activation of nicotinic acetylcholine receptors (nAChRs) on DA neurons increases DA cell activity and results in modest increases in 2-AG synthesis. Chronic nicotine exposure (Right) increases nAChR-induced postsynaptic DAGL activity, which results in enhanced 2-AG release and CB1-mediated disinhibition of GABA synapses in the VTA. AA, arachidonic acid; DAG, diacylglycerol.

References

    1. Johnson SW, North RA. Opioids excite dopamine neurons by hyperpolarization of local interneurons. J Neurosci. 1992;12(2):483–488. - PMC - PubMed
    1. Westerink BH, Kwint HF, deVries JB. The pharmacology of mesolimbic dopamine neurons: A dual-probe microdialysis study in the ventral tegmental area and nucleus accumbens of the rat brain. J Neurosci. 1996;16(8):2605–2611. - PMC - PubMed
    1. Jentsch JD, Pennington ZT. Reward, interrupted: Inhibitory control and its relevance to addictions. Neuropharmacology. 2014;76(Pt B):479–486. - PMC - PubMed
    1. Melis M, Pistis M. Hub and switches: Endocannabinoid signalling in midbrain dopamine neurons. Philos Trans R Soc Lond B Biol Sci. 2012;367(1607):3276–3285. - PMC - PubMed
    1. Mechoulam R, et al. Identification of an endogenous 2-monoglyceride, present in canine gut, that binds to cannabinoid receptors. Biochem Pharmacol. 1995;50(1):83–90. - PubMed

Publication types

MeSH terms

LinkOut - more resources