. 2016 Jan 26;113(4):1026-31.
doi: 10.1073/pnas.1514511113. Epub 2016 Jan 11.

Prolongevity hormone FGF21 protects against immune senescence by delaying age-related thymic involution

Affiliations

Prolongevity hormone FGF21 protects against immune senescence by delaying age-related thymic involution

Yun-Hee Youm et al. Proc Natl Acad Sci U S A. .

Abstract

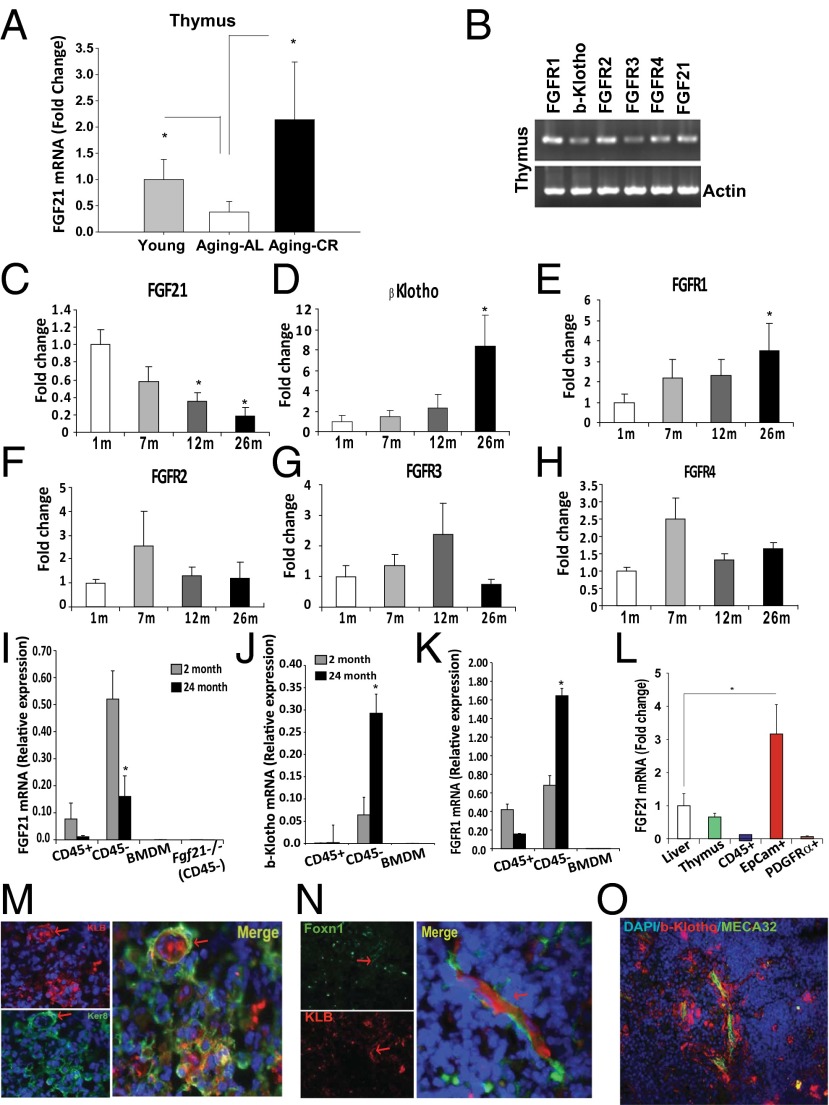
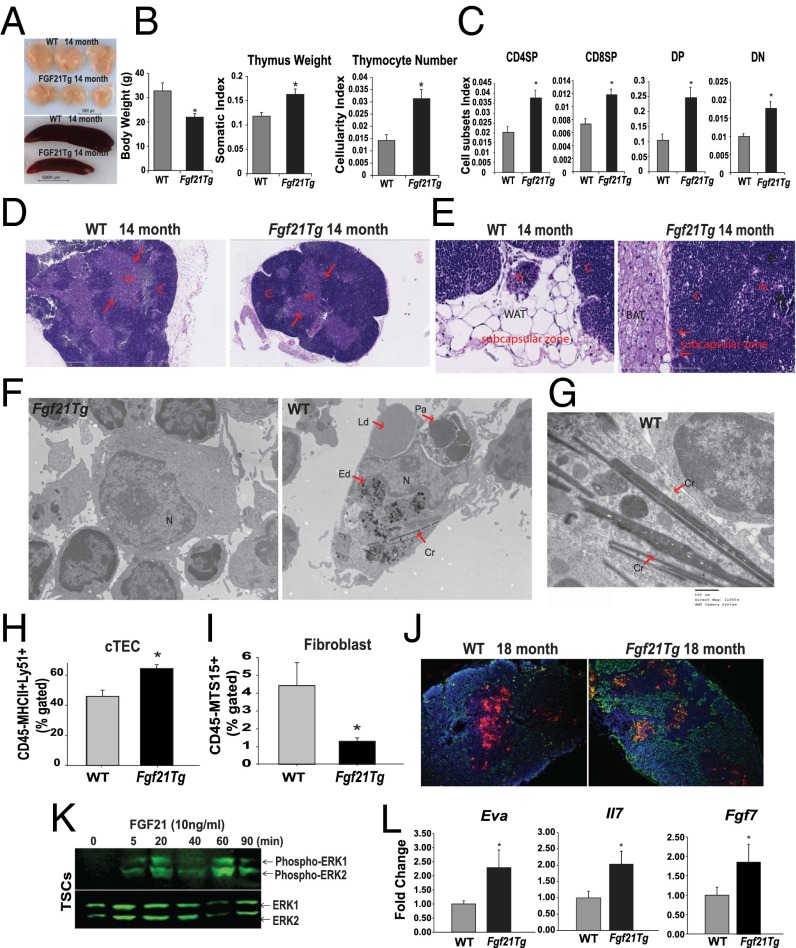
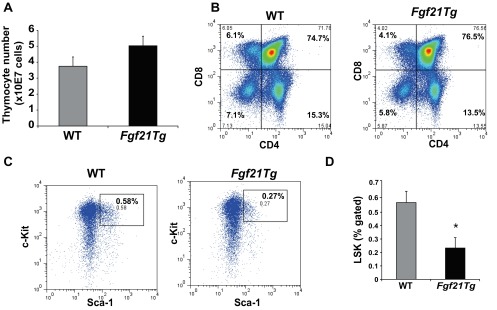
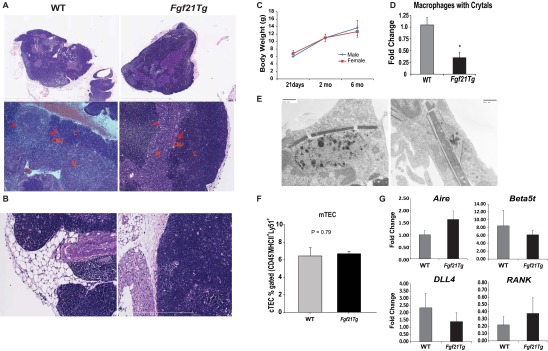
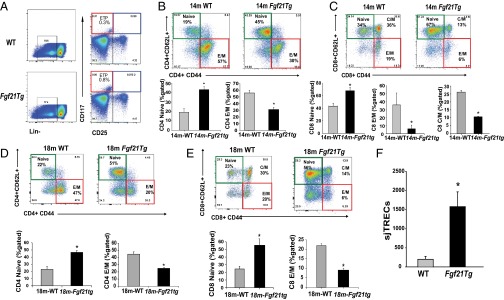
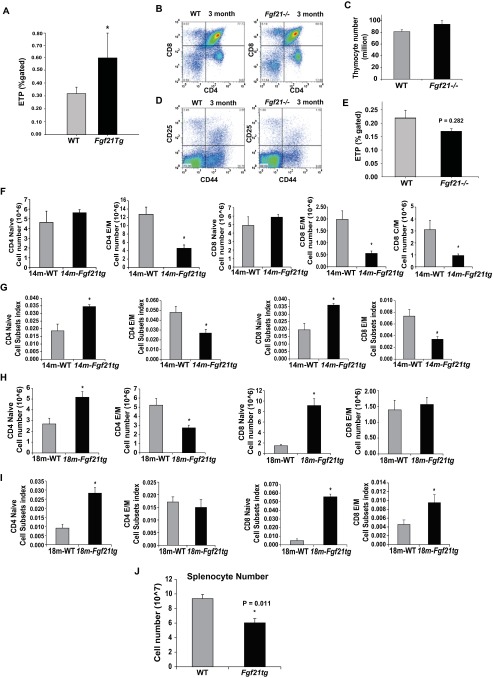
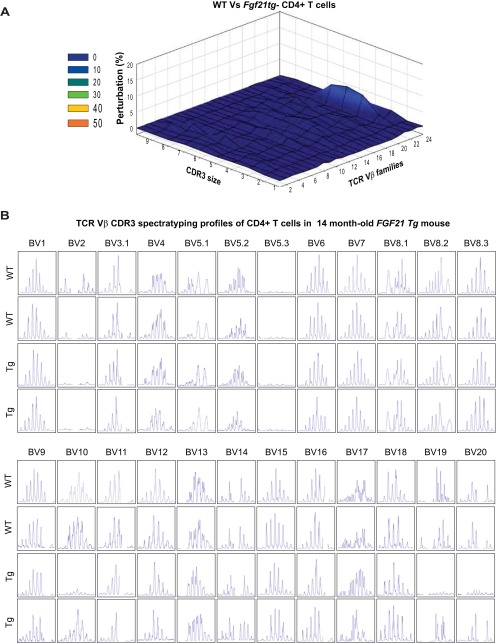
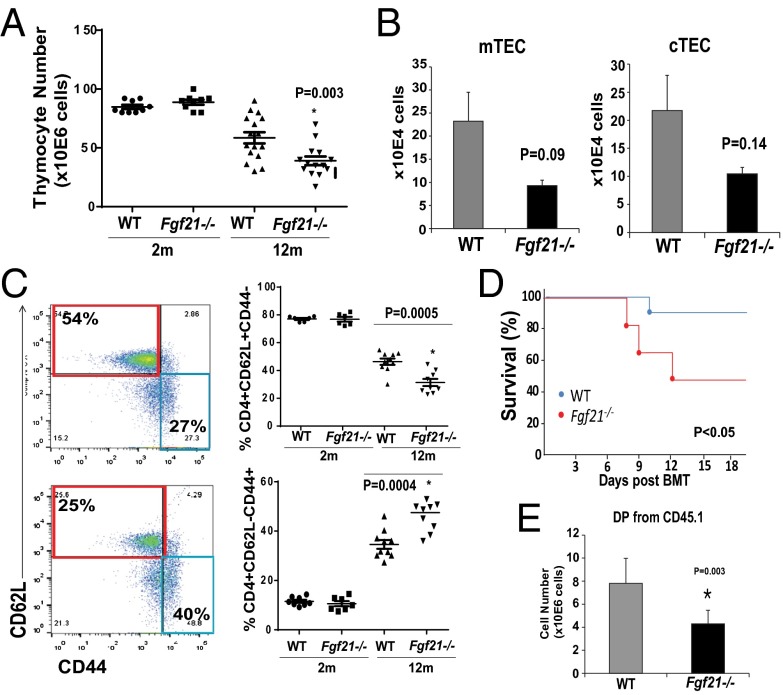
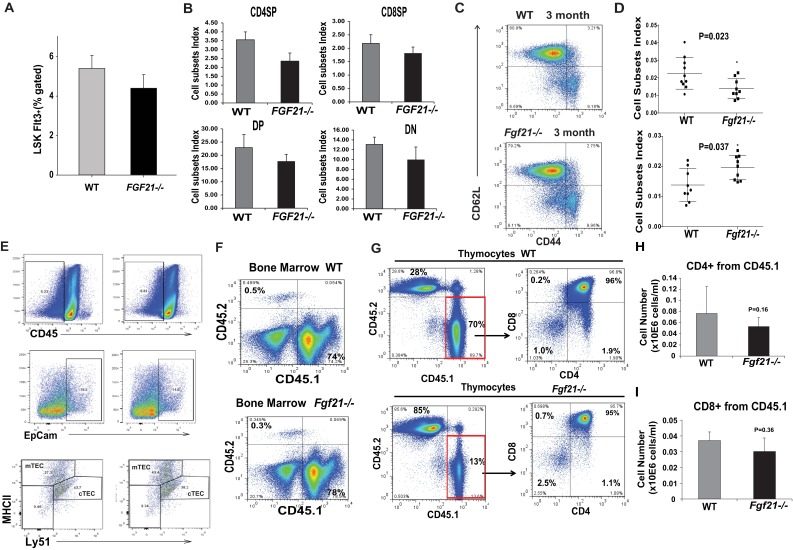
Age-related thymic degeneration is associated with loss of naïve T cells, restriction of peripheral T-cell diversity, and reduced healthspan due to lower immune competence. The mechanistic basis of age-related thymic demise is unclear, but prior evidence suggests that caloric restriction (CR) can slow thymic aging by maintaining thymic epithelial cell integrity and reducing the generation of intrathymic lipid. Here we show that the prolongevity ketogenic hormone fibroblast growth factor 21 (FGF21), a member of the endocrine FGF subfamily, is expressed in thymic stromal cells along with FGF receptors and its obligate coreceptor, βKlotho. We found that FGF21 expression in thymus declines with age and is induced by CR. Genetic gain of FGF21 function in mice protects against age-related thymic involution with an increase in earliest thymocyte progenitors and cortical thymic epithelial cells. Importantly, FGF21 overexpression reduced intrathymic lipid, increased perithymic brown adipose tissue, and elevated thymic T-cell export and naïve T-cell frequencies in old mice. Conversely, loss of FGF21 function in middle-aged mice accelerated thymic aging, increased lethality, and delayed T-cell reconstitution postirradiation and hematopoietic stem cell transplantation (HSCT). Collectively, FGF21 integrates metabolic and immune systems to prevent thymic injury and may aid in the reestablishment of a diverse T-cell repertoire in cancer patients following HSCT.

Keywords: FGF21; aging; inflammation; metabolism; thymus.


Conflict of interest statement

The authors declare no conflict of interest.

Figures

Fig. 1.
Fig. 1.
Regulated expression of FGF21 signaling components during aging. (A) Real-time PCR analysis of Fgf21 mRNA in thymi derived from 2- and 24-mo-old C57B6 mice fed for ad libitum consumption and 24-mo-old C57B6 mice undergoing 40% CR (n = 6–8 per group). (B) Representative gel image showing RT-PCR analysis of Fgfrs, Klb, and Fgf21 mRNA in thymus of 2-mo-old mice. Real-time PCR analysis of (C) Fgf21, (D) Klb, (E) Fgfr1, (F) Fgfr2, (G) Fgfr3, and (H) Fgfr4 in thymi of 1-, 7-, 12-, and 26-mo-old mice fed a normal chow diet for ad libitum consumption. (IK) The thymi from 2- and 24-mo-old mice were enzymatically dispersed to release thymocytes and TSCs. CD45+ lymphoid cells and CD45 TSCs were isolated using magnetic bead-based cell selection. Real-time PCR analysis of CD45+, CD45, and bone marrow-derived macrophages (BMDM) revealed that Fgf21, Klb, and Fgfr1 mRNAs are specifically regulated with aging in TSCs and not expressed in hematopoietic cells and macrophages (n = 6 per group). (L) TECs (CD45EpCAM+) and fibroblasts (CD45PDGFRα+) were FACS-sorted from 3-mo-old C57B6 mice and Fgf21 mRNA in relation to liver was quantified by real-time PCR. The mRNA expression was normalized to Gapdh and shown as relative expression (ΔΔCt). Data are presented as means ± SEM, *P < 0.05. (M) Immunohistochemical analysis of thymic cryosections immunostained with cTEC marker (keratin8 AlexaFluor 488, green) and KLB (AlexaFluor 594). Arrows show colocalization in thymic nurse cells. (N) βKlotho immunostaining in young FoxN1Cre:mT/mG mice in which FoxN1 lineage cells were indelibly marked with mGFP. (O) Thymic cryosection imaged at the corticomedullary junction showing colocalization of βKlotho in PCVs stained with the endothelial cell marker MECA32.
Fig. 2.
Fig. 2.
FGF21 overexpression protects against age-related thymic lipoatrophy. (A) The thymic and spleen size and (B) body weight and thymic weight and cellularity normalized to body weight in 14-mo-old WT and Fgf21tg mice. (C) Cellularity index of thymocyte subsets in 14-mo-old WT and FGF21Tg mice (n = 9 per group). (D) Representative H&E-stained sections from 14-mo-old WT and Fgf21tg mice (n = 4 per group). Loss of cortical regions (c) medullary areas (m) in WT mice is prevented in Ffg21Tg mice. (E) High-magnification (40×) image of thymic sections shows the increase in subcapsular white adipocytes in 14-mo-old WT mice with thymic remnant (Tr) and lipoatrophy. (E) Fourteen-month-old Fgf21tg mice show an increase in perithymic brown adipose tissue (BAT) and lack of ectopic adipocytes in thymic subcapsular zone. WAT, white adipose tissue. (F) Representative electron micrograph of macrophages from thymi of WT and Fgf21tg mice (14 mo old). The macrophages from involuting thymi display phagocytosed lipid droplets (Ld), protein aggregates (Pa), electron dense material in lysosomes (Ed), and crystalline material (Cr) in cytoplasm. N, nucleus. F shows macrophages with surrounding thymocytes in FGF21tg mice. (G) Spiculate crystalline material resembling Charcot–Leyden crystals within thymic macrophages of 14-m-old WT mice. (H and I) The thymi from 12- to 14-mo-old WT and Fgf21tg mice were enzymatically dispersed and cells were labeled with CD45, EpCAM, MHC-II, Ly5.1, and MTS15 to identify cTEC (CD45EpCAM+MHCII+Ly5.1+) and fibroblast subsets (CD45EpCAMMTS15+) (n = 4–6 per group). (J) Thymic cryosection of 18-mo-old WT and Fgf21tg stained with UEA-1 (for mTECs) and Troma1 (for cTECs) (n = 3). (K) CD45 TSCs were isolated from 2-mo-old thymi and treated with FGF21(10 ng/mL) and analyzed at various time points. The representative immunoblot analysis of pERK reveals FGF21 acts directly on TSCs. The experiment was repeated twice with groups of three mice. (L) Real-time PCR analysis of Eva, Il7, and Fgf7 in thymi of 14-mo-old WT and Fgf21tg mice (n = 5). The mRNA expression was normalized to Gapdh and is shown as relative expression (ΔΔCt). Data are presented as means ± SEM, *P < 0.05.
Fig. S1.
Fig. S1.
Impact of FGF21 overexpression on primary lymphoid organs. (A) Total thymocyte number from 14-mo-old WT and Fgf21tg mice (n = 6). (B) The representative FACS dot plots of thymocytes stained with CD4 and CD8 in 14-mo-old WT and Fgf21tg mice. (C and D) The bone marrow cells were stained with Sca1 and c-Kit and gated on lineage markers to identify hematopoietic stem cells (HSC) that are LSK. Compared with 14-mo-old WT mice, the frequency of LSKs is significantly reduced in Fgf21tg mice (n = 6).
Fig. S2.
Fig. S2.
Impact of FGF21 overexpression on thymic architecture. (A) Representative image (5× and 20×) of H&E-stained sections of formalin-fixed, paraffin-embedded thymus from 14-mo-old WT and Fgf21tg mice. Corticomedullary junctions (CMJ) are shown by red arrows. (B) Representative image (40×) of H&E-stained sections of formalin-fixed, paraffin-embedded thymus from 14-mo-old WT and Fgf21tg mice. The perithymic adipocytes in WT mice are similar to white adipocytes, whereas Fgf21tg mice show an increase in brown adipose tissue around the perithymic region. (C) Body weight at three different ages in male and female Fgf21 tg mice. (D) The macrophages with crystals were quantified by counting three sections each of WT and Fgf21tg mice (n = 4–5). The overexpression of FGF21 reduces the amount of crystalline material in macrophages. (E) Electron micrographs of macrophages with crystalline material. (F) The quantification of FACS analysis from mTECs (Ly5.1MHCII+) gated on CD45EpCAM+ cells in thymi of 12- to 14-mo-old WT and Fgf21tg mice. (G) Real-time PCR analysis of Aire, Beta5t, DLL, and RANK in thymi of 14-mo-old WT and Fgf21tg mice (n = 5). The mRNA expression was normalized to Gapdh and is shown as relative expression (ΔΔCt). Data are presented as means ± SEM, *P < 0.05.
Fig. 3.
Fig. 3.
FGF21 overexpression prevents age-related restriction of T-cell diversity. (A) Thymocytes from 12- to 14-mo-old WT and Fgf21tg mice (n = 4–6 per group) were stained to identify ETPs (LinloCD117+CD25). (B and C) The splenocytes were stained with CD4, CD8, CD62L, and CD44 to identify naïve (CD4/CD8CD62L+CD44lo) and E/M (CD4/CD8CD62LCD44hi) T cells. The FACS analysis in14-mo-old WT and Fgf21tg mice show a significant increase in naive CD4/CD8 and a reduction in E/M CD4/CD8 cells. (n = 6 per group). (D and E) The representative FACS dot plot of splenic naïve and E/M T-cell subpopulations in 18-mo-old WT and Fgf21tg mice (n = 4–6). Frequency of naïve CD4/CD8 and E/M CD4/CD8 cells in 18-mo-old WT and FGF21tg mice shows a significant increase naïve CD4/CD8 cells and reduction in E/M CD4/CD8 cells (n = 6 per group). (F) Real-time PCR analysis of sjTREC levels in DNA from splenic T cells in 14-mo-old WT and Fgf21tg mice (n = 6). Data are presented as means ± SEM, *P < 0.05.
Fig. S3.
Fig. S3.
Role of FGF21 on thymic development and peripheral T-cell repertoire. (A) The thymocytes from 12- to 14-mo-old WT and Fgf21tg mice (n = 4–6 per group) were stained to identify ETPs (LinloCD117+CD25). There is a significant increase (P < 0.05) in percent gated ETPs. (B) Representative FACS dot plots of thymocytes stained with CD4 and CD8 in 3-mo-old WT and Fgf21−/− mice. (C) Total thymocyte number from 4-mo-old WT and Fgf21−/− mice (n = 6–8). (D) The thymocytes were stained with CD4, CD8 CD44, and CD25 and gated on CD4- and CD8-negative cells to identify thymocyte subsets. Ablation of Fgf21 does not affect T-cell development stages in thymus. (E) The frequency of LinCD117+CD25 ETPs in WT and FGF21 null mice at 4 mo of age. (F and G) The cell subsets index and absolute number (in millions of cells) of naïve (CD62L+ CD44 and E/M (CD62LCD44hi) CD4 and CD8 cells in 14-mo-old WT and Fgf21tg mice (n = 6 per group). (H and I) The calculation of cell subsets and absolute number (in millions of cells) of naïve (CD62L+ CD44 and E/M (CD62LCD44hi) CD4 and CD8 cells in 18-mo-old WT and Fgf21tg mice (n = 4–6 per group). (J) The splenocyte number in 18-mo-old WT and FGF21 tg mice (n = 4–6).
Fig. S4.
Fig. S4.
Impact of FGF21 overexpression on TCR repertoire. (A) The CD4 cells were sorted from spleen from WT and Fgf21 tg mice (14 mo old) to prepare cDNA that was used for TCR spectratyping. The CDR3 polymorphism analysis revealed that 14-mo-old Fgf21 tg mice do not displayed significant perturbation of TCR diversity. The 3D graph depicts perturbation in CD4 T cells. Each line crossing on the y axis of the landscape denotes change from splenic CD4 cells-specific CDR3 length or size (x axis) of a particular Vβ family (z axis). The perturbation in TCR diversity is shown as landscape surfaces, in which smooth (blue) landscapes show an unchanged TCR diversity. (B) The CD4 cells were sorted from spleen from WT and FGF21 tg mice (14 mo old) to prepare cDNA that was used for TCR spectratyping. TCR diversity of peripheral CD4 T cells was analyzed by measuring the distribution of lengths of the CDR3 of TCR. Representative TCR Vβ profile in aged WT mouse and polyclonal Gaussian distribution of CDR3 lengths in Fgf21tg mice. The data were generated using an ABI 3100 sequencer and analyzed using GeneMapper.
Fig. 4.
Fig. 4.
Elimination of FGF21 accelerates thymic aging and impedes thymic reconstitution following irradiation and HSCT. (A) Total thymic cellularity in 2- and 12-mo-old WT and Fgf21−/− mice (n = 10–16). (B) The absolute number from FACS analysis of cTECs (Ly5.1+MHCII+) and mTECs (Ly5.1MHCII+) gated on CD45EpCAM+ cells in thymi of 12-mo-old WT and Fgf21−/− mice. (C) FACS analysis of splenic naïve and E/M T-cell subpopulations in 2- and 12-mo-old WT and Fgf21tg mice. (D) The Kaplan–Meier survival curves of WT and Fgf21−/− mice (2 mo old, n = 9 per genotype, P < 0.05) following lethal irradiation and HSCT. (E) The total number of donor DP CD4+D8+ thymocytes in 2-mo-old WT and FGF21 null mice 2 wk following HSCT (n = 6–9). The data are expressed as the mean (SEM), *P < 0.05.
Fig. S5.
Fig. S5.
Impact of FGF21 ablation on immune cell homeostasis. (A) The bone marrow cells were stained with Sca1 and c-Kit and gated on lineage markers to identify HSC that are LSK. Compared with 3-mo-old WT mice, the frequency of LSKs was not affected in Fgf21−/− mice (n = 6). (B) The cell subsets index of thymocyte number from CD4SP, CD8SP, CD4+CD8+DP, and DN in 12-mo-old WT and Fgf21−/− mice (n = 6). (C) The representative FACS dot plots from splenocytes stained with CD4, CD62L, and CD44 in 3-mo-old WT and Fgf21−/− mice (n = 6). Ablation of FGF21 does not affect the frequency of naïve (CD62L+CD44) or E/M cells (CD62LCD44hi). (D) The cell subsets index of CD4 (CD62L+CD44) naïve and E/M (CD62LCD44hi) cells in 12-mo-old WT and Fgf21−/− mice (n = 6). (E) The FACS analysis of cTECs (Ly5.1+MHCII+) and mTECs (Ly5.1MHCII+) gated on CD45EpCAM+ cells in thymi of 12-mo-old WT and Fgf21−/− mice (n = 6). (F) The bone marrow cells from WT and Fgf21−/− mice were stained with CD45.1 (donor) and CD45.2 (recipients) to investigate the percent chimerism following lethal irradiation and HSCT. Ablation of FGF21 does not affect bone marrow chimerism. (GI) The thymocytes from 2-mo-old WT and Fgf21−/− mice were stained with CD45.1 (for donor cells), CD45.2 (for host cells), CD4, and CD8. The total thymocyte subset numbers gated on donor and host cells from young WT and Fgf21−/− mice are shown (n = 9 per group).

Comment in

Similar articles

Cited by

References

    1. Lynch HE, et al. Thymic involution and immune reconstitution. Trends Immunol. 2009;30(7):366–373. - PMC - PubMed
    1. Dorshkind K, Montecino-Rodriguez E, Signer RA. The ageing immune system: Is it ever too old to become young again? Nat Rev Immunol. 2009;9(1):57–62. - PubMed
    1. Dixit VD. Impact of immune-metabolic interactions on age-related thymic demise and T cell senescence. Semin Immunol. 2012;24(5):321–330. - PubMed
    1. Heng TS, Chidgey AP, Boyd RL. Getting back at nature: Understanding thymic development and overcoming its atrophy. Curr Opin Pharmacol. 2010;10(4):425–433. - PubMed
    1. van Ewijk W. T-cell differentiation is influenced by thymic microenvironments. Annu Rev Immunol. 1991;9:591–615. - PubMed

Publication types

Substances