. 2016 Jan 26;113(4):E420-9.
doi: 10.1073/pnas.1518931113. Epub 2016 Jan 11.

Attention promotes episodic encoding by stabilizing hippocampal representations

Affiliations

Attention promotes episodic encoding by stabilizing hippocampal representations

Mariam Aly et al. Proc Natl Acad Sci U S A. .

Abstract

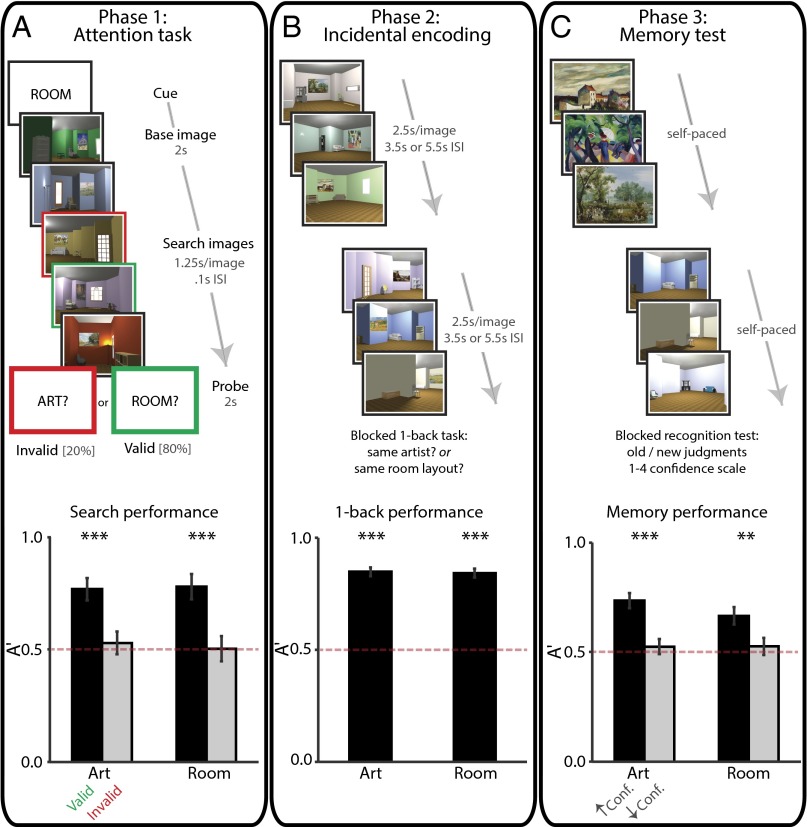
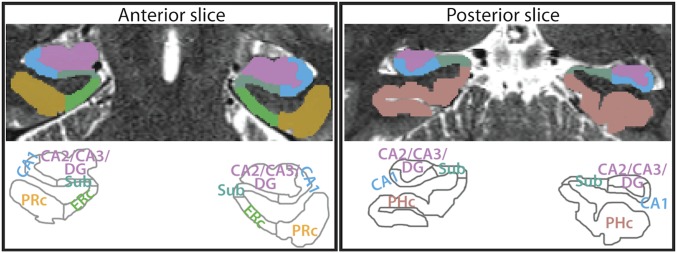
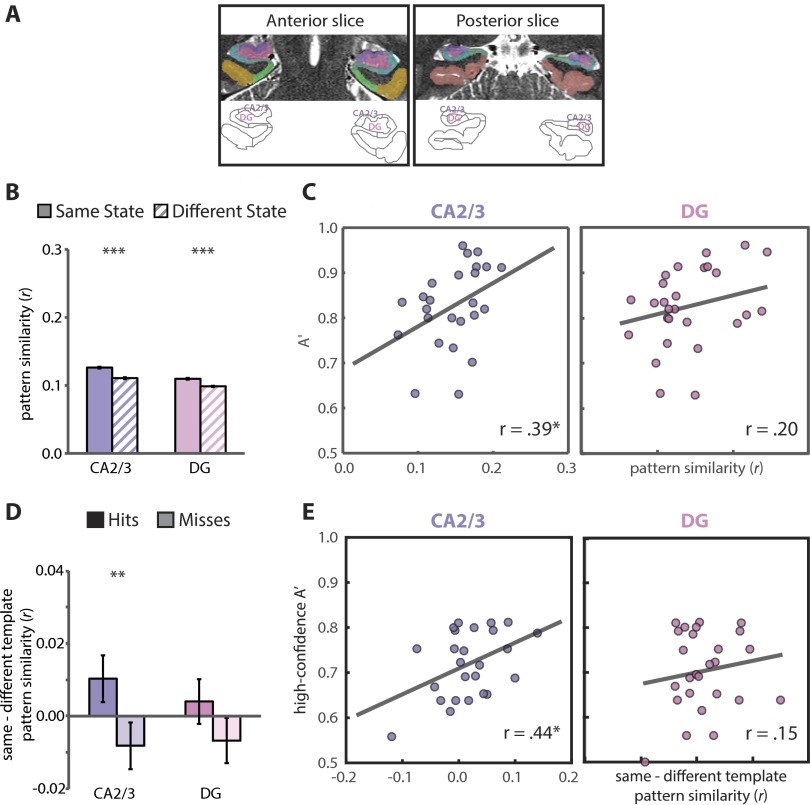
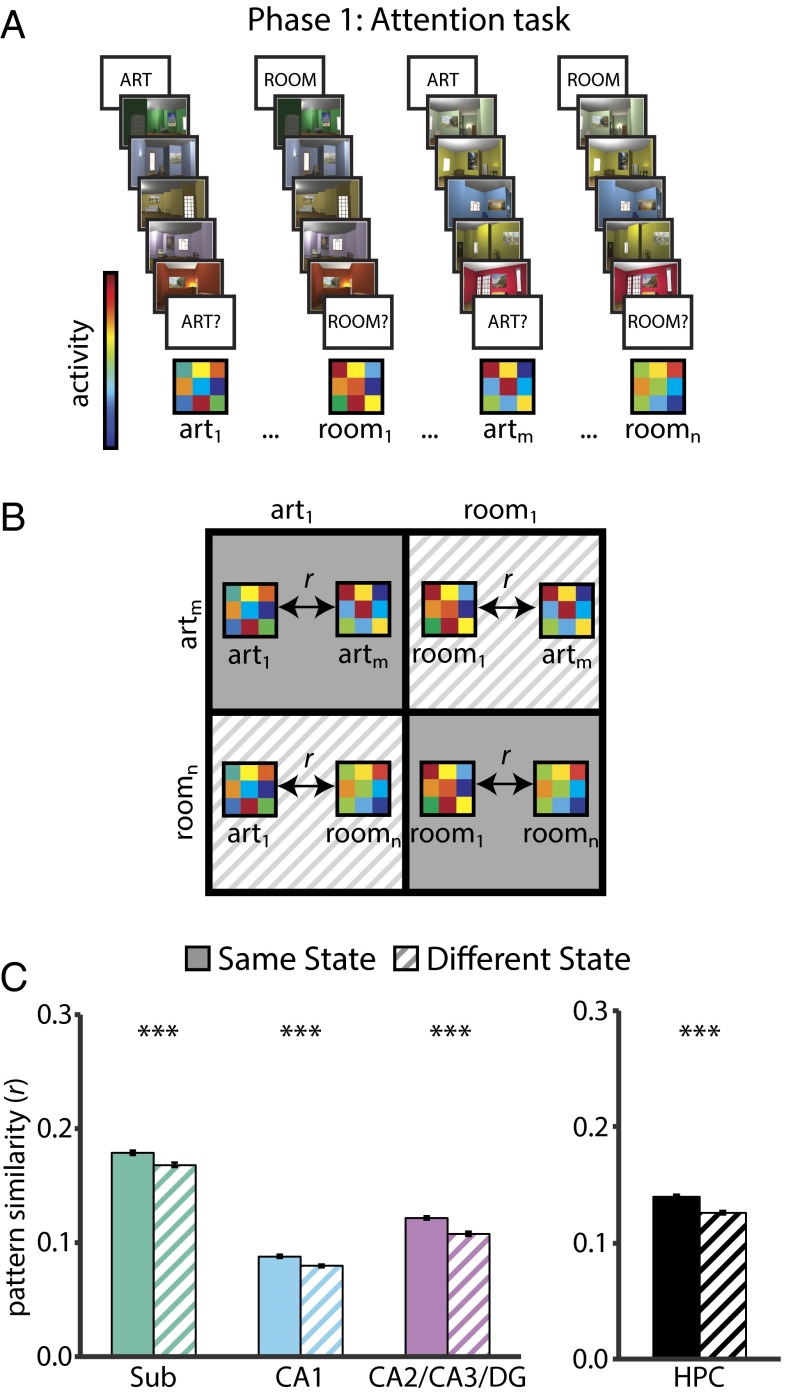
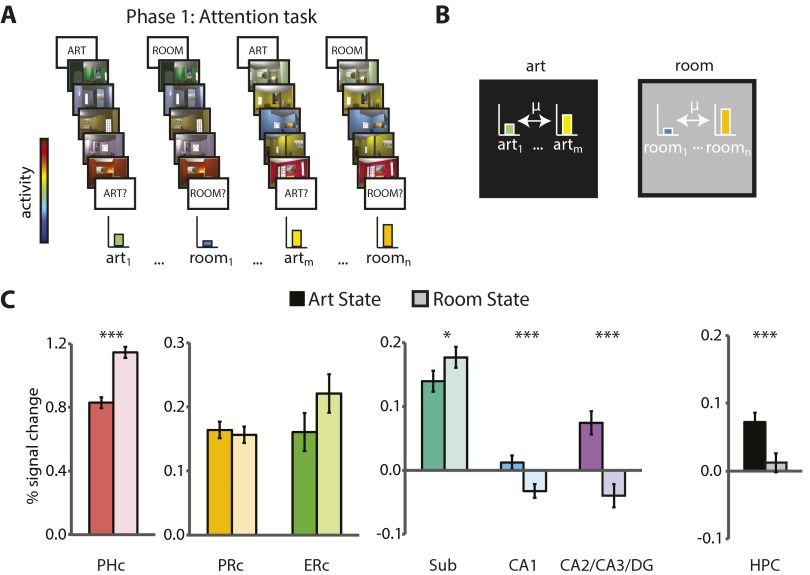
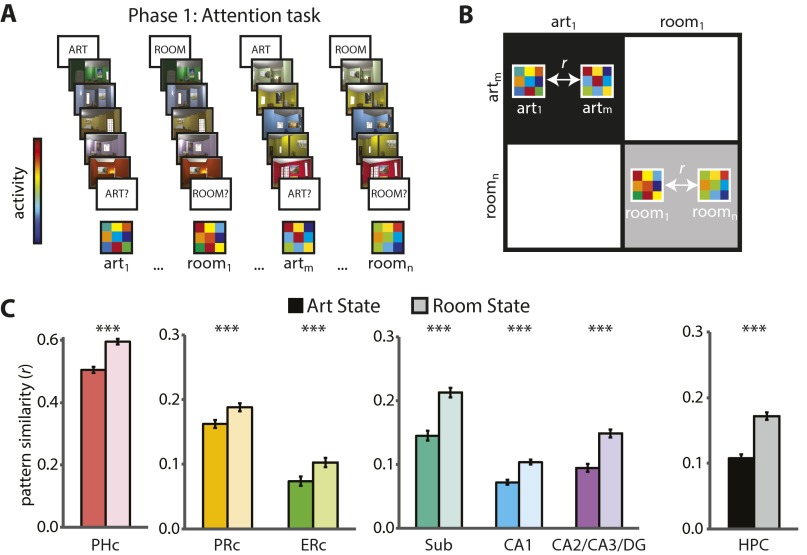
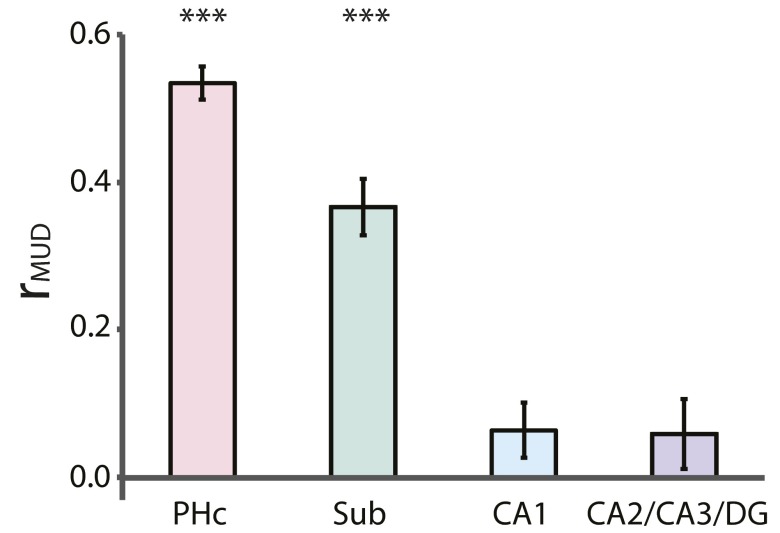
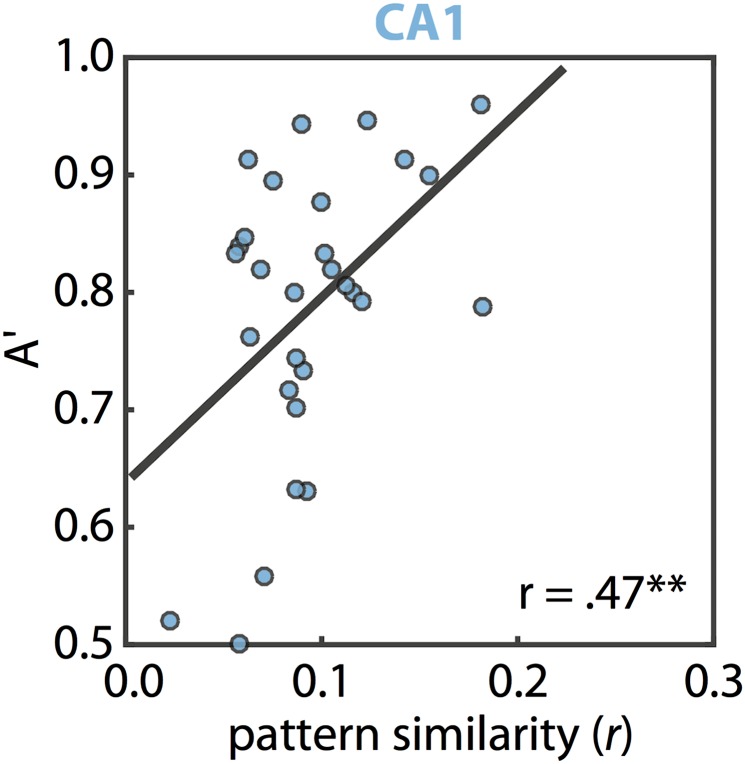
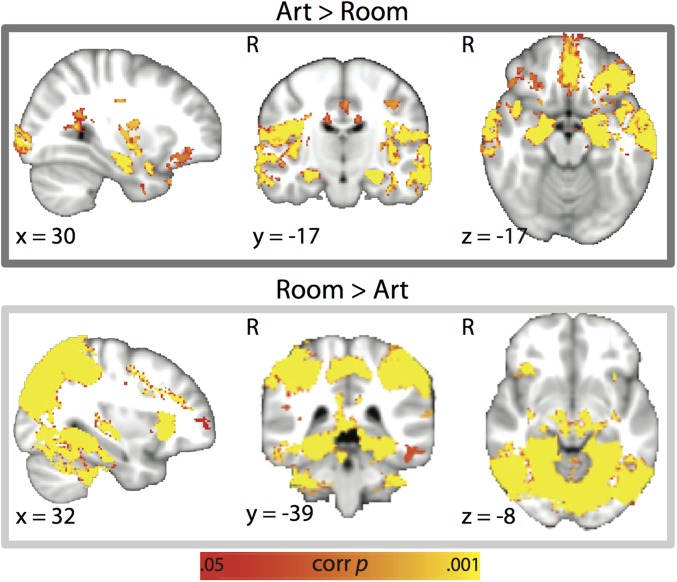
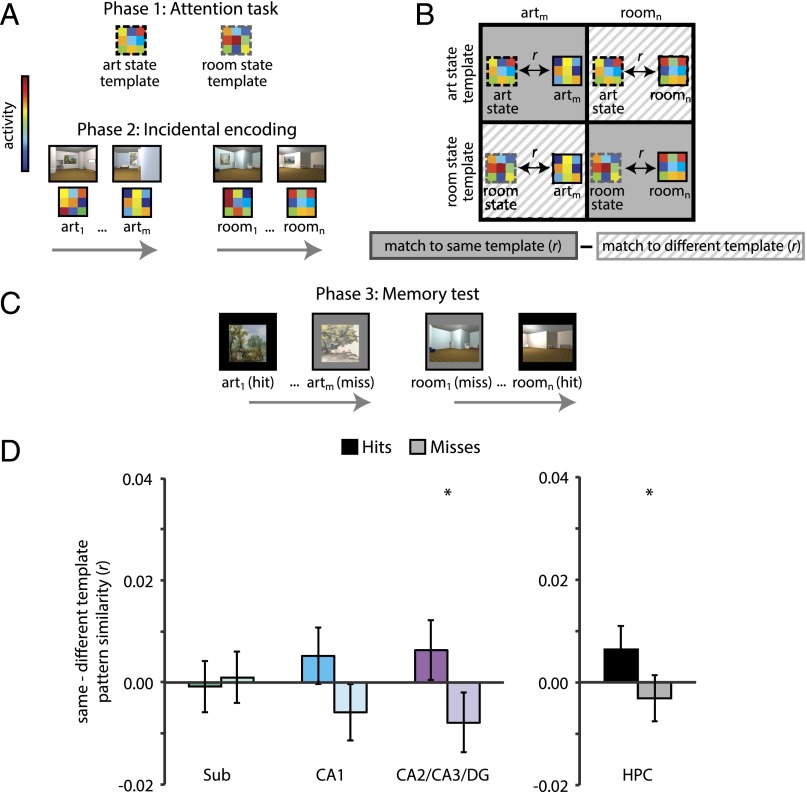
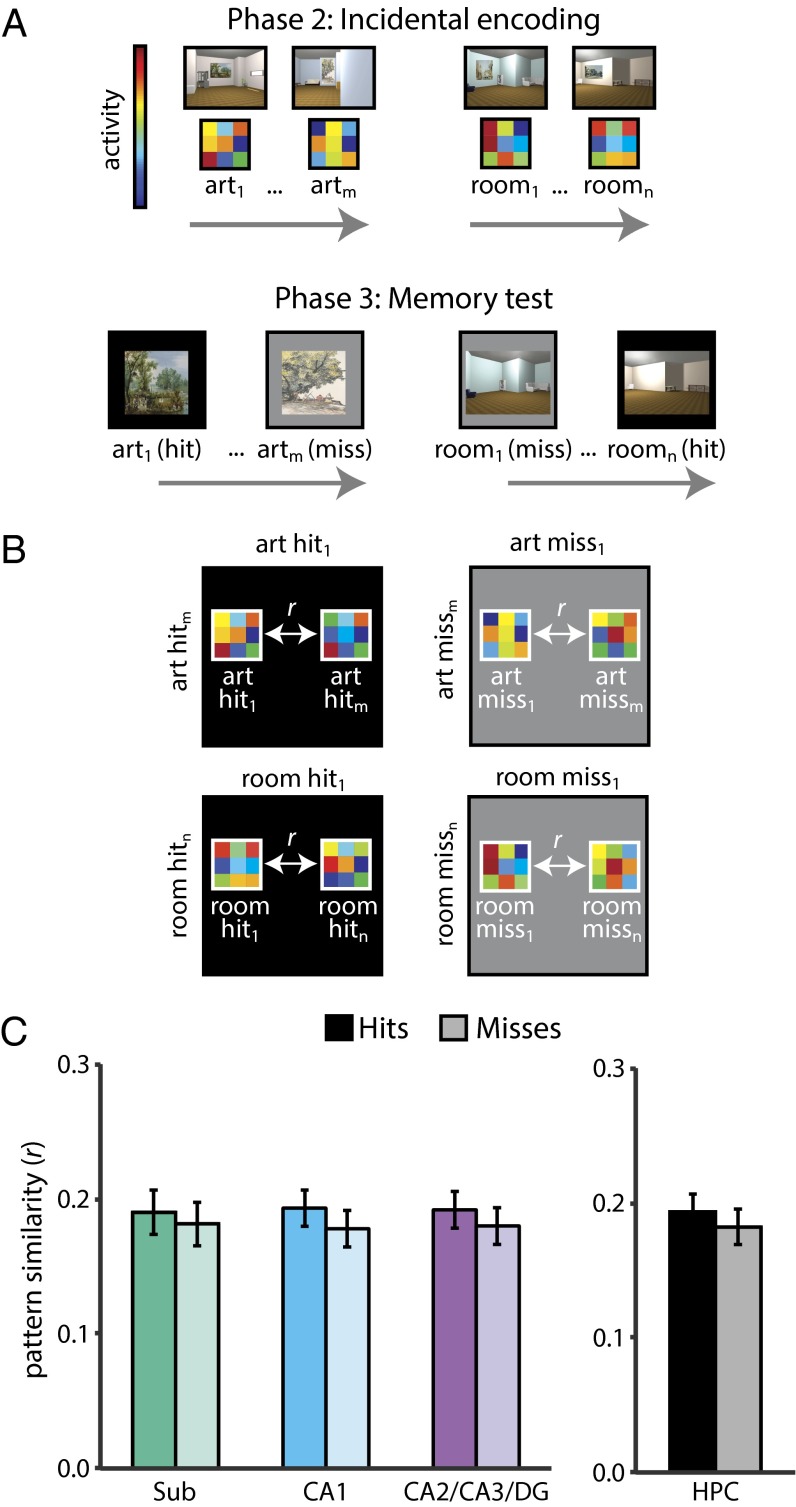
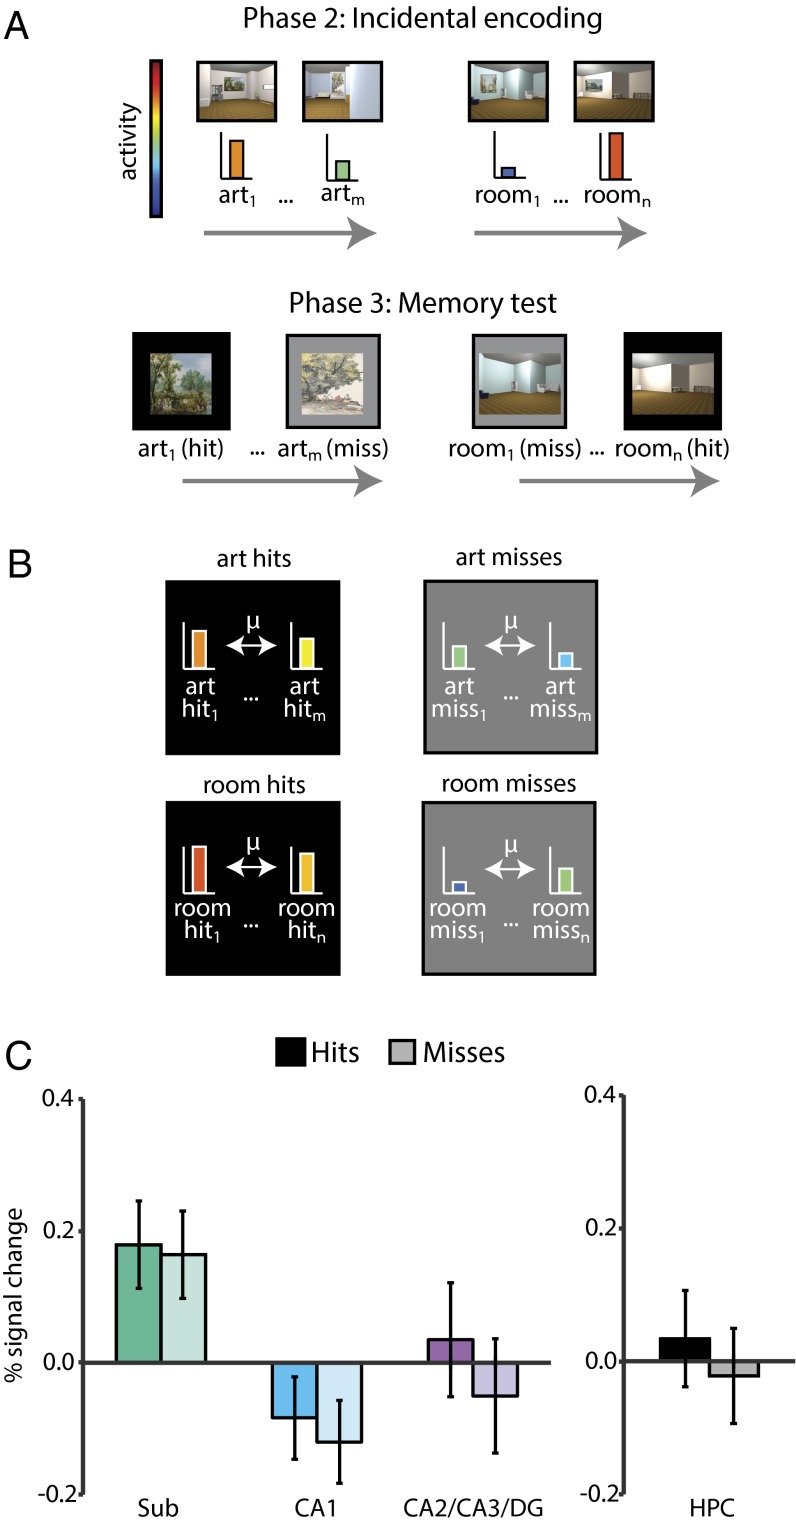
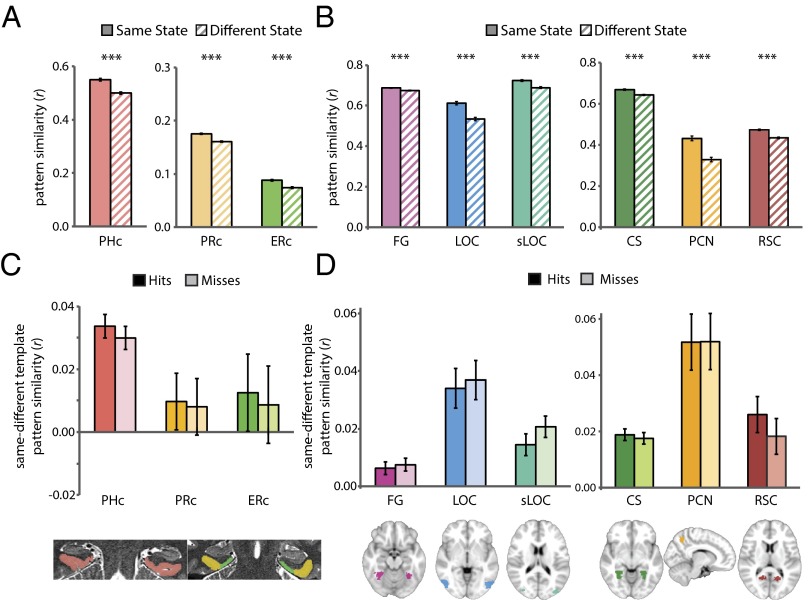
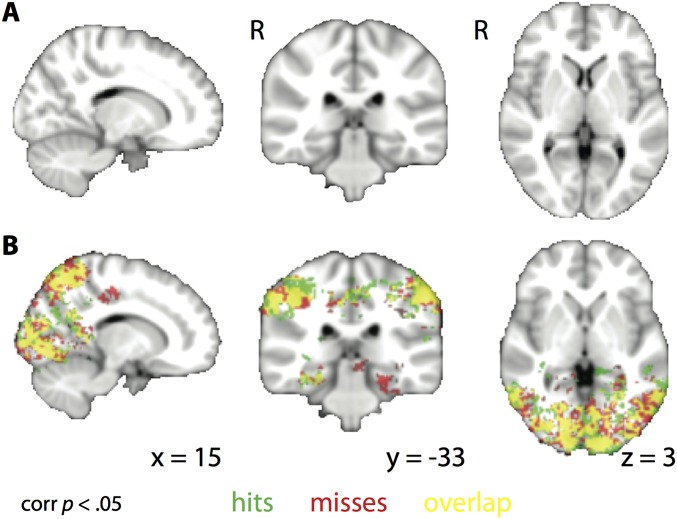
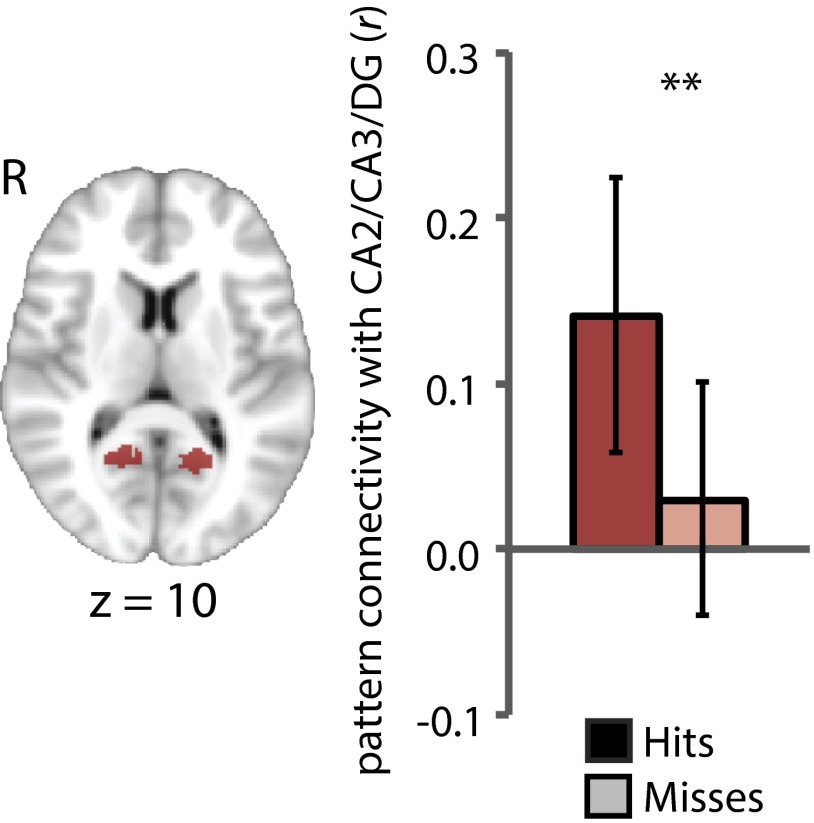
Attention influences what is later remembered, but little is known about how this occurs in the brain. We hypothesized that behavioral goals modulate the attentional state of the hippocampus to prioritize goal-relevant aspects of experience for encoding. Participants viewed rooms with paintings, attending to room layouts or painting styles on different trials during high-resolution functional MRI. We identified template activity patterns in each hippocampal subfield that corresponded to the attentional state induced by each task. Participants then incidentally encoded new rooms with art while attending to the layout or painting style, and memory was subsequently tested. We found that when task-relevant information was better remembered, the hippocampus was more likely to have been in the correct attentional state during encoding. This effect was specific to the hippocampus, and not found in medial temporal lobe cortex, category-selective areas of the visual system, or elsewhere in the brain. These findings provide mechanistic insight into how attention transforms percepts into memories.

Keywords: hippocampal subfields; long-term memory; medial temporal lobe; representational stability; selective attention.


Conflict of interest statement

The authors declare no conflict of interest.

Figures

Fig. 1.
Fig. 1.
Task design and behavioral results. The study consisted of three phases. In phase 1 (A, Upper), participants performed a task in which they paid attention to paintings or rooms on different trials. One room trial is illustrated. For visualization, the cued match is outlined in green and the uncued match in red. Task performance (A, Lower) is shown as sensitivity in making present/absent judgments as a function of attentional state and probe type. Error bars depict ±1 SEM of the within-participant valid vs. invalid difference. In phase 2 (B, Upper), participants performed an incidental encoding task in which they viewed trial-unique images and looked for one-back repetitions of artists or room layouts in different blocks. Task performance (B, Lower) is shown as sensitivity in detecting one-back repetitions as a function of attentional state. Error bars depict ±1 SEM. In phase 3 (C, Upper), participants’ memory for the attended aspect of phase 2 images was tested. Memory performance (C, Lower) is shown as sensitivity in identifying previously studied items, as a function of response confidence and attentional state. Error bars depict ±1 SEM of the within-participant high- vs. low-confidence difference. Dashed line indicates chance performance. **P < 0.01, ***P < 0.001.
Fig. 2.
Fig. 2.
MTL ROIs. Example segmentation from one participant is depicted for one anterior and one posterior slice. ROIs consisted of three hippocampal regions [subiculum (Sub), CA1, and CA2/CA3/DG], and three MTL cortical regions (ERc, PRc, and PHc). We also conducted analyses across the hippocampus as a single ROI, and exploratory analyses with separate CA2/3 and DG ROIs (Fig. S1). For segmentation guide, see ref. .
Fig. S1.
Fig. S1.
Comparison of attention and memory effects in CA2/3 and DG. (A) We conducted exploratory analyses with separate ROIs for CA2/3 and DG, shown here for an example participant. We conducted these analyses because of reported dissociations across CA2/3 and DG with 3T fMRI (33, 34). These analyses should be interpreted with caution, however, because separation of CA2/3 and DG signals is difficult, even with the 1.5-mm isotropic voxels used in the present study. Specifically, the intertwined nature of these subfields means that a functional voxel could include both CA2/3 and DG. Thus, in the main text, we used the standard approach of collapsing across CA2, CA3, and DG in a single ROI (31). Here we report separated analyses for completeness and to contribute data to the discussion of this issue in the field. (B) In the phase 1 attention task, both regions showed state-dependent patterns of activity, with more similar patterns of activity for trials of the same vs. different states (CA2/3: t31 = 7.97, P < 0.0001; DG: t31 = 6.53, P < 0.0001) (compare with Fig. 3C). Error bars depict ±1 SEM of the within-participant same vs. different state difference. (C) In the phase 1 attention task, individual differences in room-state pattern similarity in CA2/3 were correlated with individual differences in behavioral performance (A′) on valid trials of the room task (r23 = 0.39, P = 0.05). This effect was not found in DG [r25 = 0.20, P = 0.31; note that degrees-of-freedom differ because of the robust correlation methods used (60)]. Additionally, the CA2/3 correlation was specific to room-state pattern similarity and room-state behavior: room-state activity did not predict room-state behavior (r29 = −0.03, P = 0.87) and room-state pattern similarity did not predict art-state behavior (r27 = 0.11, P = 0.58). Finally, controlling for room-state pattern similarity, art-state pattern similarity did not predict room-state behavior (r23 = 0.12, P = 0.58). (D) During the phase 2 encoding task, there was greater pattern similarity with the task-relevant vs. task-irrelevant state template for subsequent hits vs. misses in CA2/3 (F1,30 = 7.86, P = 0.009), but this effect was not reliable in DG (F1,30 = 2.82, P = 0.10) (compare with Fig. 4D). Error bars depict ±1 SEM of the within-participant hits vs. misses difference. (E) Individual differences in room memory were positively correlated with the match between CA2/3 encoding activity patterns and the room- vs. art-state template (r23 = 0.44, P = 0.03). This correlation was not reliable in DG [r24 = 0.15, P = 0.46; note that degrees-of-freedom differ because of the robust correlation methods used (60)]. *P = 0.05, **P < 0.01, ***P < 0.001.
Fig. 3.
Fig. 3.
State-dependent pattern similarity. (A) BOLD activity evoked in the art and room states (in the phase 1 attention task) was extracted from all voxels in each ROI for each trial. (B) Voxelwise activity patterns were correlated across trials of the same state (i.e., art to art, room to room) and across trials of different states (i.e., art to room). (C) All hippocampal subfields showed greater pattern similarity for same vs. different states, as did the hippocampus considered as a single ROI. In this and all subsequent figures, pattern similarity results are shown as Pearson correlations, but statistical tests were performed after applying the Fisher transformation. Error bars depict ±1 SEM of the within-participant same vs. different state difference. ***P < 0.001.
Fig. S2.
Fig. S2.
Attentional modulation of univariate activity. (A) BOLD activity evoked on art- and room-state trials was extracted from all voxels in each ROI and averaged across voxels. Baseline corresponds to unmodeled periods of passive viewing of a blank screen. (B) Univariate activity across trials was calculated separately within the art and room states. (C) In the MTL cortex, PHc was more active for the room vs. art state (t31 = 9.06, P < 0.0001). ERc showed a trend in the same direction (t31 = 2.01, P = 0.053), and PRc showed no difference (t31 = 0.59, P = 0.56). In the hippocampus, subiculum was more active for the room vs. art state (t31 = 2.25, P = 0.03), whereas CA1 and CA2/CA3/DG were more active for the art vs. room state (CA1: t31 = 4.21, P = 0.0002; CA2/CA3/DG: t31 = 6.24, P < 0.0001). Considered as a single ROI, the hippocampus was more active for the art vs. room states (t31 = 4.27, P = 0002). Error bars depict ±1 SEM of the within-participant art- vs. room-state difference. Results are shown as Pearson correlations, but statistical tests were performed after Fisher transformation. *P < 0.05, ***P < 0.001.
Fig. S3.
Fig. S3.
Comparison of pattern similarity between states. (A) BOLD activity was extracted from all voxels in each ROI for each trial. (B) Activity patterns were separately correlated across trials of the art state and across trials of the room state. (C) In the MTL cortex, all subregions showed greater pattern similarity for room vs. art states (PHc: t31 = 8.85, P < 0.0001; PRc: t31 = 4.05, P = 0.0003; ERc: t31 = 4.03, P = 0.0003). In the hippocampus, all subfields showed greater pattern similarity for room vs. art states (subiculum: t31 = 8.66, P < 0.0001; CA1: t31 = 8.24, P < 0.0001; CA2/CA3/DG: t31 = 8.31, P < 0.0001). Considered as a single ROI, the hippocampus showed greater pattern similarity for room vs. art states (t31 = 10.54, P < 0.0001). Error bars depict ±1 SEM of the within-participant art vs. room state difference. Results are shown as Pearson correlations, but statistical tests were performed after Fisher transformation. ***P < 0.001.
Fig. S4.
Fig. S4.
Multivariate-univariate dependence (MUD) analysis. We carried out a MUD analysis (10) to examine the relationship between attentional modulation of univariate activity and pattern similarity for ROIs that showed both effects. The contribution of each voxel to pattern similarity was estimated by normalizing BOLD activity over voxels within an ROI for each trial and computing pairwise products across trials. Voxels with positive products increase pattern similarity and voxels with negative products decrease pattern similarity, in both cases proportional to the magnitude of the product. In each voxel, the products for all pairs of trials were averaged, resulting in one contribution score per voxel. These scores were then correlated across voxels with the average activity level in those voxels to produce an index of the dependence between activity and pattern similarity within each ROI. The PHc and subiculum showed higher univariate activity (Fig. S2) and pattern similarity (Fig. S3) for the room state, and the MUD coefficient was positive (PHc: t31 = 19.06, P < 0.0001; subiculum: t31 = 8.83, P < 0.0001), indicating that these effects were partially driven by modulation of the same voxels. CA1 and CA2/CA3/DG showed lower univariate activity (Fig. S2) and higher pattern similarity (Fig. S3) for the room state. The MUD coefficient for these ROIs was not different from zero (CA1: t31 = 1.76, P = 0.09; CA2/CA3/DG: t31 = 1.12, P = 0.27), indicating that at least partly nonoverlapping sets of voxels made the biggest contributions to these effects. Error bars depict ±1 SEM across participants. Results are shown as Pearson correlations, but statistical tests were performed after Fisher transformation. ***P < 0.001.
Fig. S5.
Fig. S5.
Brain/behavior relationships in the attention task. Individual differences in room-state pattern similarity in CA1 were correlated with individual differences in behavioral performance (A′) on valid trials of the room task [r27 = 0.47, P = 0.01; note that robust correlation methods were used (60)]. This effect was not found in any other region (PHc: r26 = 0.16, P = 0.41; PRc: r26 = −0.01, P = 0.96; ERc: r29 = 0.14, P = 0.46; Sub: r28 = 0.21, P = 0.26; CA2/CA3/DG: r24 = 0.27, P = 0.18). Note, however, that CA2/3 alone did show a reliable effect (see Fig. S1C). Additionally, the correlation for CA1 was specific to room-state pattern similarity and room-state behavior: room-state activity did not predict room-state behavior (r27 = −0.11, P = 0.56) and room-state pattern similarity did not predict art-state behavior (r26 = −0.03, P = 0.87). Finally, controlling for room-state pattern similarity, art-state pattern similarity did not predict room-state behavior (r26 = 0.12, P = 0.56). There were no reliable correlations between art-state pattern similarity and art-state behavior in any ROI (all Ps > 0.10). **P < 0.01.
Fig. S6.
Fig. S6.
Whole-brain univariate analysis of art vs. room states in the attention task. Regions showing greater activity for the art compared with the room state (Upper) were primarily distributed anteriorly in the brain: bilateral superior temporal sulcus, superior temporal gyrus, middle temporal gyrus, temporal pole, hippocampus, perirhinal cortex, amygdala, putamen, insula, orbitofrontal cortex, medial prefrontal cortex, cingulate gyrus, and occipital pole. Regions showing greater activity for the room compared with the art state (Lower) were primarily distributed posteriorly: bilateral primary visual cortex, thalamus, lateral occipital cortex, lingual gyrus, fusiform gyrus, parahippocampal cortex, precuneus, posterior cingulate/retrosplenial cortex, intraparietal sulcus, inferior parietal lobule, superior parietal lobule, and caudate nucleus. P < 0.05 TFCE-corrected.
Fig. 4.
Fig. 4.
Subsequent memory analysis of attentional state in hippocampus. (A) From the phase 1 attention task, mean art- and room-state templates were obtained by averaging activity patterns across all trials of the respective state. From the phase 2 encoding task, the activity pattern for each trial was extracted from each ROI. (B) These trial-specific encoding patterns were correlated with the task-relevant attentional-state template (e.g., art encoding to art template) and the task-irrelevant attentional-state template (e.g., art encoding to room template). The difference of these correlations was the dependent measure of interest. (C) These correlation values were binned according to memory in phase 3. (D) There was greater pattern similarity with the template for the task-relevant vs. -irrelevant state for subsequent hits vs. misses in CA2/CA3/DG, but not subiculum or CA1. This effect remained significant when considering the hippocampus as a single ROI. For analyses with separate CA2/3 and DG ROIs, see Fig. S1. Error bars depict ±1 SEM of the within-participant hits vs. misses difference. *P < 0.05.
Fig. 5.
Fig. 5.
Subsequent memory analysis of generic pattern similarity in the hippocampus. (A) Activity patterns for each encoding trial in phase 2 were extracted from each ROI. Trials were then binned according to memory in phase 3. (B) Within each task at encoding (art and room), the activity patterns for all subsequent hits were correlated with one another and the activity patterns for all subsequent misses were correlated with one another, controlling for their similarity to the task-relevant attentional-state template. These partial correlations were then averaged across tasks separately for hits and misses. (C) There was no similarity difference for hits vs. misses in any hippocampal subfield or in the hippocampus as a whole. Error bars depict ±1 SEM of the within-participant hits vs. misses difference.
Fig. 6.
Fig. 6.
Subsequent memory analysis of univariate activity in hippocampus. (A) The average evoked activity over voxels was extracted from each encoding trial in phase 2 for each ROI. Trials were then binned according to memory in phase 3. (B) Univariate activity was averaged separately for all subsequent hits and for all subsequent misses. (C) There was no difference between hits and misses in any hippocampal subfield or in the hippocampus considered as a single ROI. Error bars depict ±1 SEM of the within-participant hits vs. misses difference.
Fig. 7.
Fig. 7.
Attention and memory signals outside of the hippocampus. During the phase 1 attention task, state-dependent activity patterns were observed in (A) MTL cortex and (B) object-/scene-selective cortex. Error bars depict ±1 SEM of the within-participant same vs. different state difference. During phase 2 encoding, there was no difference in attentional-state template match between subsequent hits vs. misses in (C) MTL cortex or (D) object-/scene-selective cortex. Error bars depict ±1 SEM of the within-participant hits vs. misses difference. ***P < 0.001.
Fig. S7.
Fig. S7.
Attentional-state representations during encoding. (A) Whole-brain searchlight analysis showing regions where there was a greater correlation between trial-by-trial encoding activity patterns and the matching vs. mismatching attentional-state template for subsequent hits vs. misses. No clusters survived correction for multiple comparisons. (B) The same analysis as for A, but shown separately for hits and misses, with overlap in yellow. Many regions in the occipital and temporal cortex showed greater evidence for the task-relevant attentional-state representation during encoding, but this did not differ based on memory success. P < 0.05 TFCE-corrected.
Fig. 8.
Fig. 8.
Pattern connectivity between RSC and CA2/CA3/DG during memory encoding. RSC (Left) showed greater pattern connectivity with CA2/CA3/DG for subsequent hits vs. misses. Error bars depict 95% bootstrap confidence intervals. **P < 0.01.

References

    1. Chun MM, Golomb JD, Turk-Browne NB. A taxonomy of external and internal attention. Annu Rev Psychol. 2011;62:73–101. - PubMed
    1. Maunsell JHR, Treue S. Feature-based attention in visual cortex. Trends Neurosci. 2006;29(6):317–322. - PubMed
    1. Chun MM, Turk-Browne NB. Interactions between attention and memory. Curr Opin Neurobiol. 2007;17(2):177–184. - PubMed
    1. Carr VA, Engel SA, Knowlton BJ. Top-down modulation of hippocampal encoding activity as measured by high-resolution functional MRI. Neuropsychologia. 2013;51(10):1829–1837. - PMC - PubMed
    1. Davachi L, Wagner AD. Hippocampal contributions to episodic encoding: Insights from relational and item-based learning. J Neurophysiol. 2002;88(2):982–990. - PubMed

Publication types