

Metabolomics revealed diurnal heat stress and zinc supplementation-induced changes in amino acid, lipid, and microbial metabolism
- PMID: 26755737
- PMCID: PMC4760408
- DOI: 10.14814/phy2.12676
Metabolomics revealed diurnal heat stress and zinc supplementation-induced changes in amino acid, lipid, and microbial metabolism
Abstract
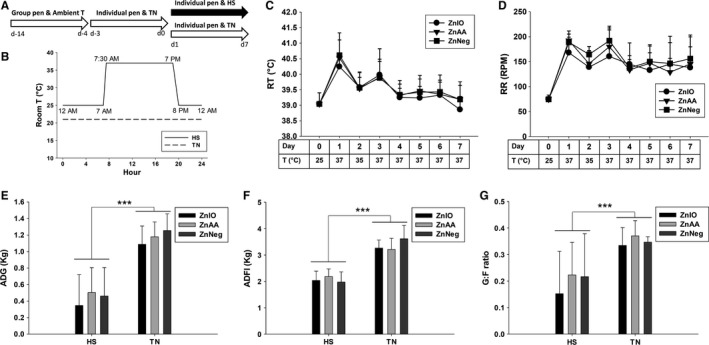
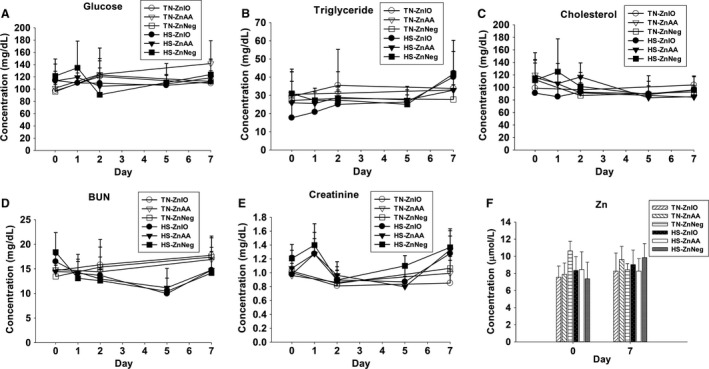
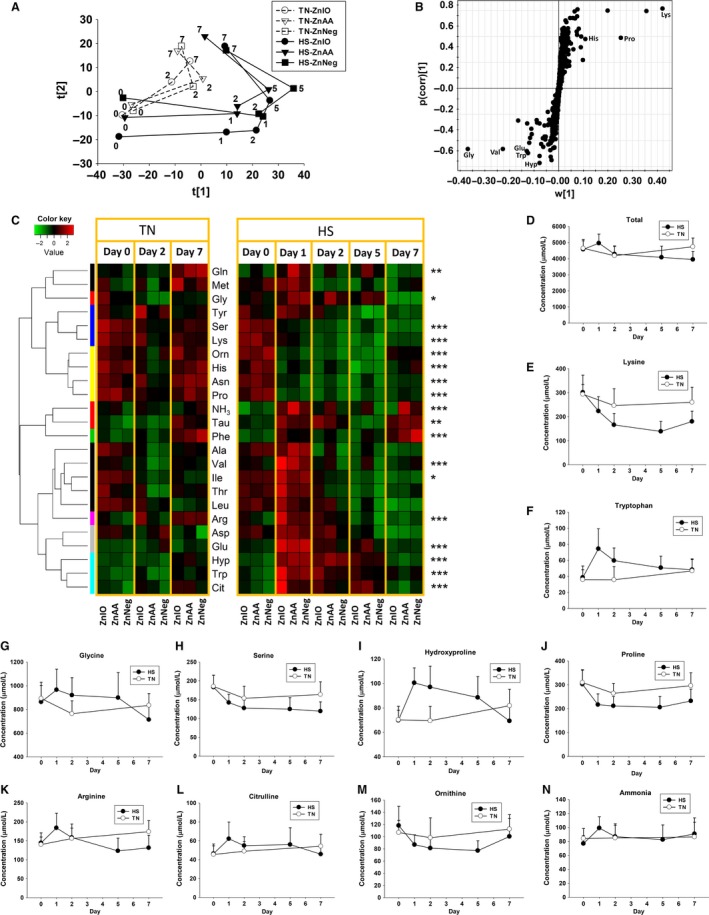
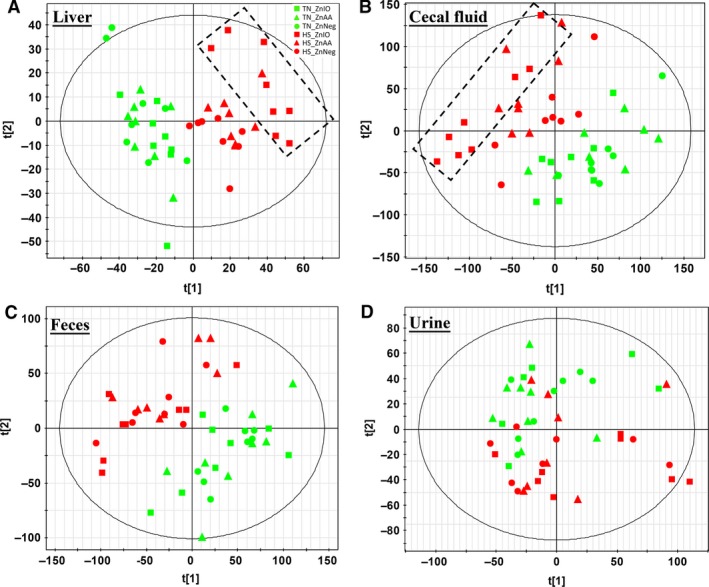
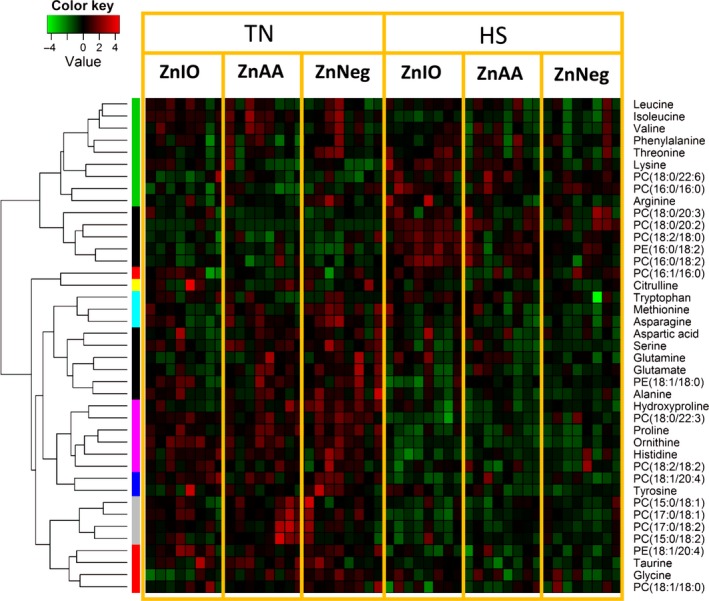
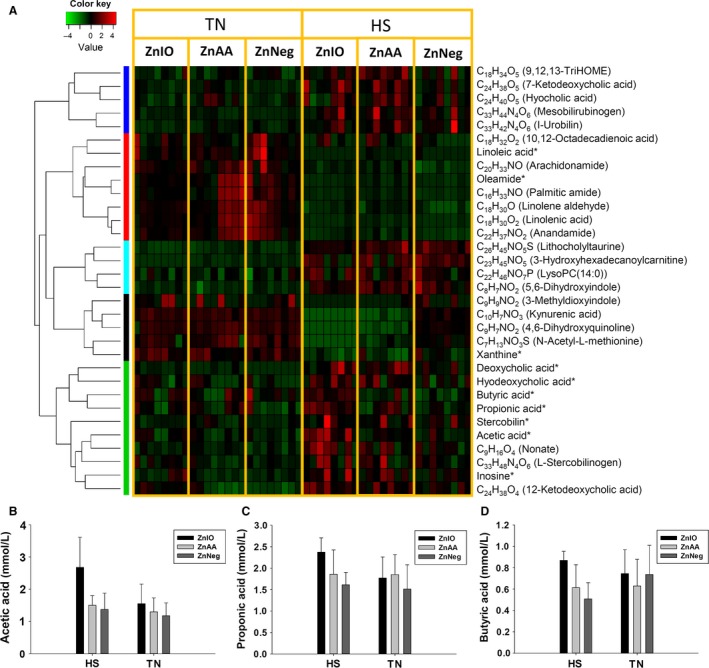
Heat stress (HS) dramatically disrupts the events in energy and nutrient metabolism, many of which requires zinc (Zn) as a cofactor. In this study, metabolic effects of HS and Zn supplementation were evaluated by examining growth performance, blood chemistry, and metabolomes of crossbred gilts fed with ZnNeg (no Zn supplementation), ZnIO (120 ppm ZnSO4), or ZnAA (60 ppm ZnSO4 + 60 ppm zinc amino acid complex) diets under diurnal HS or thermal-neutral (TN) condition. The results showed that growth performance was reduced by HS but not by Zn supplementation. Among measured serum biochemicals, HS was found to increase creatinine but decrease blood urea nitrogen (BUN) level. Metabolomic analysis indicated that HS greatly affected diverse metabolites associated with amino acid, lipid, and microbial metabolism, including urea cycle metabolites, essential amino acids, phospholipids, medium-chain dicarboxylic acids, fatty acid amides, and secondary bile acids. More importantly, many changes in these metabolite markers were correlated with both acute and adaptive responses to HS. Relative to HS-induced metabolic effects, Zn supplementation-associated effects were much more limited. A prominent observation was that ZnIO diet, potentially through its influences on microbial metabolism, yielded different responses to HS compared with two other diets, which included higher levels of short-chain fatty acids (SCFAs) in cecal fluid and higher levels of lysine in the liver and feces. Overall, comprehensive metabolomic analysis identified novel metabolite markers associated with HS and Zn supplementation, which could guide further investigation on the mechanisms of these metabolic effects.
Keywords: Heat stress; metabolism; metabolomics; zinc supplementation.
© 2016 The Authors. Physiological Reports published by Wiley Periodicals, Inc. on behalf of the American Physiological Society and The Physiological Society.
Figures


Similar articles
-
Effects of Chromium Methionine Supplementation with Different Sources of Zinc on Growth Performance, Carcass Traits, Meat Quality, Serum Metabolites, Endocrine Parameters, and the Antioxidant Status in Growing-Finishing Pigs.Biol Trace Elem Res. 2017 Sep;179(1):70-78. doi: 10.1007/s12011-017-0935-0. Epub 2017 Jan 21. Biol Trace Elem Res. 2017. PMID: 28108862 Clinical Trial.
-
Dietary organic zinc attenuates heat stress-induced changes in pig intestinal integrity and metabolism.J Anim Sci. 2015 Oct;93(10):4702-13. doi: 10.2527/jas.2015-9018. J Anim Sci. 2015. PMID: 26523563 Clinical Trial.
-
Effects of supplemental zinc amino acid complex on gut integrity in heat-stressed growing pigs.Animal. 2014 Jan;8(1):43-50. doi: 10.1017/S1751731113001961. Epub 2013 Nov 7. Animal. 2014. PMID: 24229744
-
Metabolic responses and "omics" technologies for elucidating the effects of heat stress in dairy cows.Int J Biometeorol. 2017 Jun;61(6):1149-1158. doi: 10.1007/s00484-016-1283-z. Epub 2016 Nov 30. Int J Biometeorol. 2017. PMID: 27904969 Free PMC article. Review.
-
The potential role of amino acids in myopia: inspiration from metabolomics.Metabolomics. 2024 Dec 15;21(1):6. doi: 10.1007/s11306-024-02207-x. Metabolomics. 2024. PMID: 39676079 Review.
Cited by
-
Evaluating the therapeutic potential of moxibustion on polycystic ovary syndrome: a rat model study on gut microbiota and metabolite interaction.Front Cell Infect Microbiol. 2024 Apr 11;14:1328741. doi: 10.3389/fcimb.2024.1328741. eCollection 2024. Front Cell Infect Microbiol. 2024. PMID: 38665877 Free PMC article.
-
High Glucose Levels Promote Switch to Synthetic Vascular Smooth Muscle Cells via Lactate/GPR81.Cells. 2024 Jan 26;13(3):236. doi: 10.3390/cells13030236. Cells. 2024. PMID: 38334628 Free PMC article.
-
Effects of Zinc Supplementation on Metabolomic Profiles in Tanzanian Infants: A Randomized Trial.J Nutr. 2024 Feb;154(2):403-411. doi: 10.1016/j.tjnut.2023.12.011. Epub 2023 Dec 11. J Nutr. 2024. PMID: 38092153 Free PMC article. Clinical Trial.
-
Integrated rumen microbiome and serum metabolome analysis responses to feed type that contribution to meat quality in lambs.Anim Microbiome. 2023 Dec 19;5(1):65. doi: 10.1186/s42523-023-00288-y. Anim Microbiome. 2023. PMID: 38115081 Free PMC article.
-
Forming 4-Methylcatechol as the Dominant Bioavailable Metabolite of Intraruminal Rutin Inhibits p-Cresol Production in Dairy Cows.Metabolites. 2021 Dec 24;12(1):16. doi: 10.3390/metabo12010016. Metabolites. 2021. PMID: 35050138 Free PMC article.
References
-
- Abumrad, N. N. , and Miller B.. 1983. The physiologic and nutritional significance of plasma‐free amino acid levels. JPEN J. Parenter. Enteral Nutr. 7:163–170. - PubMed
-
- Aggarwal, A. , and Upadhyay R.. 2013. Heat stress and animal productivity. Springer, New Delhi, India. p. 27‐42.
-
- Baumgard, L. H. , and Rhoads R. P. Jr. 2013. Effects of heat stress on postabsorptive metabolism and energetics. Annu. Rev. Anim. Biosci. 1:311–337. - PubMed
-
- Belhadj Slimen, I. , Najar T., Ghram A., and Abdrrabba M.. 2015. Heat stress effects on livestock: molecular, cellular and metabolic aspects, a review. J. Anim. Physiol. Anim. Nutr. (Berl). doi: 10.1111/jpn.12379. - DOI - PubMed
-
- Bligh, E. G. , and Dyer W. J.. 1959. A rapid method of total lipid extraction and purification. Can J. Biochem. Physiol. 37:911–917. - PubMed
Publication types
MeSH terms
Substances
LinkOut - more resources
Full Text Sources
Other Literature Sources
Medical
