Review
. 2016 Jan 7;22(1):284-99.
doi: 10.3748/wjg.v22.i1.284.

Differentiation of hepatocellular carcinoma from its various mimickers in liver magnetic resonance imaging: What are the tips when using hepatocyte-specific agents?

Affiliations
Review

Differentiation of hepatocellular carcinoma from its various mimickers in liver magnetic resonance imaging: What are the tips when using hepatocyte-specific agents?

Yang Shin Park et al. World J Gastroenterol. .

Abstract

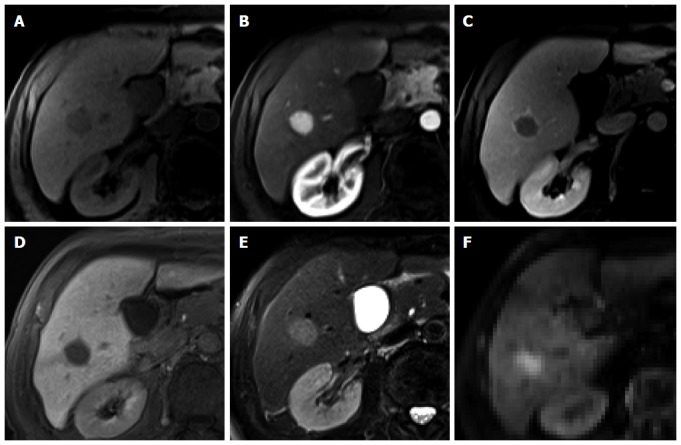
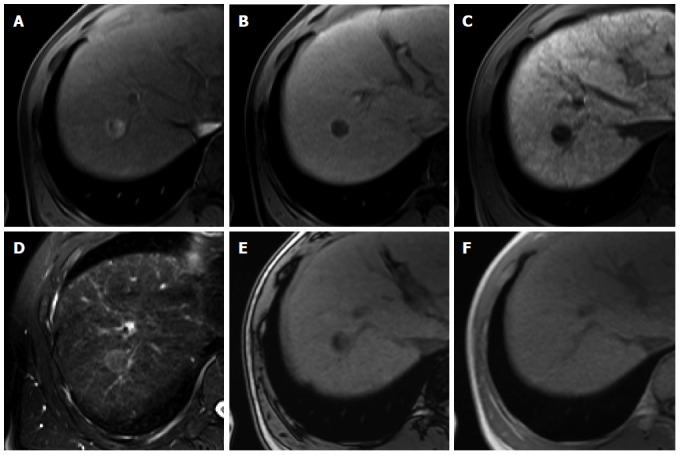
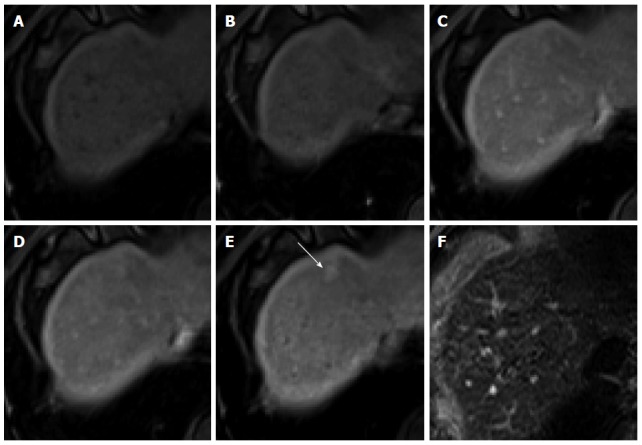
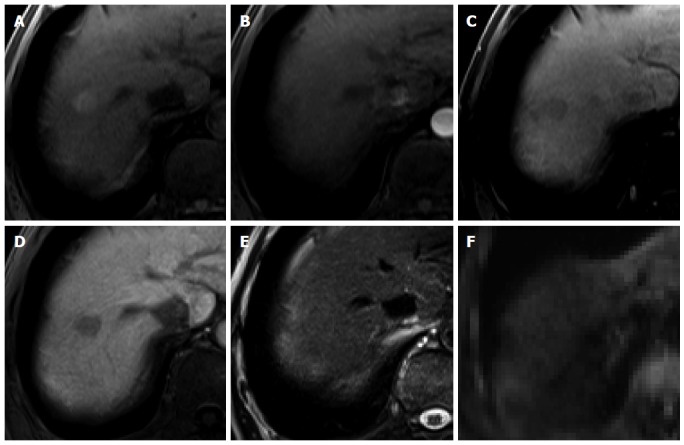
Hepatocellular carcinoma is the most common primary hepatic malignant tumor. With widespread use of liver imaging, various cirrhosis-related nodules are frequently detected in patients with chronic liver disease, while diverse hypervascular hepatic lesions are incidentally detected but undiagnosed on dynamic computed tomography and magnetic resonance imaging (MRI). However, use of hepatocyte-specific MR contrast agents with combined perfusion and hepatocyte-selective properties have improved diagnostic performance in detection and characterization of focal liver lesions. Meanwhile, the enhancement patterns observed during dynamic phases using hepatocyte-specific agents may be different from those observed during MRI using conventional extracellular fluid agents, leading to confusion in diagnosis. Therefore, we discuss useful tips for the differentiation of hepatocellular carcinoma from similar lesions in patients with and without chronic liver disease using liver MRI with hepatocyte-specific agents.

Keywords: Gadoxetic acid; Hepatocellular carcinoma; Liver cirrhosis; Magnetic resonance imaging.


Figures

Figure 1
Figure 1
Hepatocellular carcinoma in a 74-year-old man with hepatitis C infection. A: Precontrast T1-weighted image shows a hypointense nodule in segment 6; B: Hepatic arterial phase of gadoxetic acid-enhanced MRI shows homogeneous marked enhancement of the tumor; C: Transitional phase shows washout of the contrast medium in the tumor with capsular enhancement; D: Hepatobiliary phase shows marked hypointensity of the tumor relative to the liver parenchyma; E, F: T2-weighted image and diffusion weighted image (b = 800) show high SI of the tumor.
Figure 2
Figure 2
Fat-containing hepatocellular carcinoma in a 57-year-old man with hepatitis B infection. A: Hepatic arterial phase using gadoxetic acid shows heterogeneously arterial enhancement with intralesional low SI area; B: Transitional phase shows washout of the contrast medium in the tumor with capsular enhancement; C: Hepatobiliary phase shows marked hypointensity of the tumor relative to the liver parenchyma; D: T2-weighted image shows high signal intensity of the tumor; E, F: Opposed phase (E) and in-phase (F) T1-weighted gradient echo images reveals area of signal drop on opposed-phase image, indicating fat-containing lesion.
Figure 3
Figure 3
Regenerative nodule in a 61-year-old man with alcoholic liver cirrhosis. A-D: Precontrast T1-weighted image, hepatic arterial phase, portal venous phase, and transitional phase show no visible lesion in the scanned area; E: Hepatobiliary phase shows a hyperintense nodule (arrow) in hepatic S4; F: T2-weighted image shows isointensity of the tumor.
Figure 4
Figure 4
Dysplastic nodule in the same patient as Figure 1. A: precontrast T1-weighted image shows a hyperintense nodule in segment 8, suggesting high contents of iron or copper; B: Hepatic arterial phase of gadoxetic acid-enhanced MRI shows isointensity of the tumor; C, D: transitional and hepatobiliary phases show hypointensity of the tumor relative to the liver parenchyma; E, F: T2-weighted image and diffusion weighted image (b = 800) show isointensity of the tumor.
Figure 5
Figure 5
Focal nodular hyperplasia-like nodule in a 45-year-old man with hepatitis B infection. A: Precontrast T1-weighted image shows isointensity of the tumor; B: Hepatic arterial phase using gadoxetic acid shows lobulating-contoured, marked enhanced nodule in segment 4; C, D: Portal venous and transitional phases show slight hyperenhancement of the tumor relative to the liver parenchyma; E: Hepatobiliary phase shows isointensity or subtle peripheral ring-like enhancement of the tumor; F: T2-weighted image shows isointensity of the tumor.
Figure 6
Figure 6
Intrahepatic cholangiocarcinoma in an 80-year-old man. A: Hepatic arterial phase using gadoxetic acid shows peripheral arterial enhancing mass with capsular retraction at the hepatic segment 8 subcapsular location; B: Portal venous and transitional phases show target appearance with peripheral enhancement and central nonenhancement; C, D: Hepatobiliary phase also shows low signal intensity of the most outer portion, high signal intensity of mid portion, and marked low signal intensity of the center of the tumor.
Figure 7
Figure 7
Intrahepatic cholangiocarcinoma in an 80-year-old man. A: Hepatic arterial phase using gadoxetic acid shows heterogeneously arterial enhancing nodule in hepatic segment 4 dome; B, C: Portal venous and transitional phases show delayed washout; D: Hepatobiliary phase shows target appearance with peripheral low signal intensity and central high signal intensity.
Figure 8
Figure 8
Focal nodular hyperplasia in a 55-year-old woman. A: Hepatic arterial phase image of gadoxetic acid-enhanced etic resonance imaging shows lobulating contoured, marked enhanced tumor; B, C: Portal venous and transitional phases show slightly hyperenhancement of the tumor relative to the liver parenchyma, and central hypointense area is suspected as central scar; D: Hepatobiliary phase shows peripheral ring-like enhancement of the tumor with larger area of markedly hypointense central scar as compared with the other phase images.
Figure 9
Figure 9
Hepatocellular adenoma in a 45-year-old woman. A: Hepatic arterial phase using gadoxetic acid shows moderate arterial enhancement; B: Transitional phase shows delayed washout without capsule or pseudocapsule; C: Hepatobiliary phase shows heterogeneous low signal intensity of the tumor; D: T2-weighted image shows a peripheral hyperintense band with moderate high signal intensity of residual tumor.
Figure 10
Figure 10
Hepatic hemangioma in a 45-year-old woman. A: Hepatic arterial phase using gadoxetic acid shows peripheral nodular enhancement of the tumor in segment 7; B: Transitional phase shows centripetal and prolonged enhancement; C: Hepatobiliary phase shows hypointense defect relative to hepatic parenchyma; D: T2-weighted image shows bright and high signal intensity.
Figure 11
Figure 11
Hepatic hemangioma in a 54-year-old man. A: Hepatic arterial phase in gadoxetic acid-enhanced MRI shows homogeneous marked enhancement of the tumor in segment 3; B: Transitional phase shows slightly low signal intensity of the tumor relative to the liver parenchyma; C: Hepatobiliary phase shows more markedly low signal intensity of the tumor; D: T2-weighted image shows bright and high signal intensity of the tumor.
Figure 12
Figure 12
Angiomyolipoma in a 33-year-old woman. A: Hepatic arterial phase using gadoxetic acid shows heterogeneous arterial enhancement of the tumor. Early venous drainage to the right hepatic vein is seen (white arrow); B: Transitional phase shows heterogeneously low signal intensity; C: Hepatobiliary phase shows homogeneously low signal intensity; D, E: Opposed phase (D) and in-phase (E) T1-weighted gradient echo images reveal hypointense mass with area of signal drop on opposed-phase image (black arrows), indicating fat-containing lesion; F: T2-weighted image shows heterogeneous signal intensity of the tumor.
Figure 13
Figure 13
Focal eosinophilic infiltration in a 52-year-old man. A: Hepatic arterial phase of gadoxetic acid-enhanced MRI shows two irregular homogeneously enhancing nodular lesions in segments 7 and 8; B: Hepatobiliary phase shows low signal intensities with ill-defined margin and nonspherical shape; C: Heavily T2-weighted image shows smaller size of the lesions in S8, compared to (B).
Figure 14
Figure 14
Hypervascular pseudolesion in a 49-year-old man with normal liver. A: Precontrast T1-weighted image shows no focal hepatic lesion; B: Hepatic arterial phase using gadoxetic acid shows several arterial enhancing nodular lesions in the liver (arrows); C-F: Transitional, hepatobiliary, T2-weighted, and diffusion weighted images show no signal change.
Figure 15
Figure 15
Hepatic metastasis from colon cancer in a 74-year-old man. A: Hepatic arterial phase using gadoxetic acid shows multiple arterial rim-like enhancing tumors with lobulating margin; B, C: Portal venous and transitional phases show heterogeneously low signal intensity of the tumors; D: Hepatobiliary phase shows peripheral hypointense rim with subtle high signal intensity of the center.
Figure 16
Figure 16
Hepatic metastasis from breast cancer in a 61-year-old woman. A: Hepatic arterial phase using gadoxetic acid shows arterial rim-like enhancement; B, C: Portal venous and transitional phases show delayed washout of periphery of the tumor with central nonenhancement; D: Hepatobiliary phase shows target appearance with subtle high signal intensity of the center and peripheral low signal intensity rim.

Similar articles

Cited by

References

    1. Nordenstedt H, White DL, El-Serag HB. The changing pattern of epidemiology in hepatocellular carcinoma. Dig Liver Dis. 2010;42 Suppl 3:S206–S214. - PMC - PubMed
    1. Ferlay J, Shin HR, Bray F, Forman D, Mathers C, Parkin DM. Estimates of worldwide burden of cancer in 2008: GLOBOCAN 2008. Int J Cancer. 2010;127:2893–2917. - PubMed
    1. European Association For The Study Of The Liver; European Organisation For Research And Treatment Of Cancer. EASL-EORTC clinical practice guidelines: management of hepatocellular carcinoma. J Hepatol. 2012;56:908–943. - PubMed
    1. Bruix J, Sherman M. Management of hepatocellular carcinoma: an update. Hepatology. 2011;53:1020–1022. - PMC - PubMed
    1. Colli A, Fraquelli M, Casazza G, Massironi S, Colucci A, Conte D, Duca P. Accuracy of ultrasonography, spiral CT, magnetic resonance, and alpha-fetoprotein in diagnosing hepatocellular carcinoma: a systematic review. Am J Gastroenterol. 2006;101:513–523. - PubMed

MeSH terms