

Nuclear magnetic resonance based metabolomics and liver diseases: Recent advances and future clinical applications
- PMID: 26755887
- PMCID: PMC4698504
- DOI: 10.3748/wjg.v22.i1.417
Nuclear magnetic resonance based metabolomics and liver diseases: Recent advances and future clinical applications
Abstract
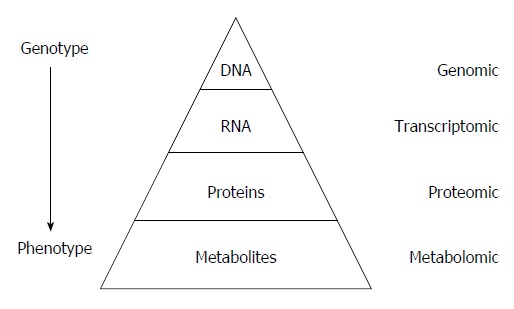
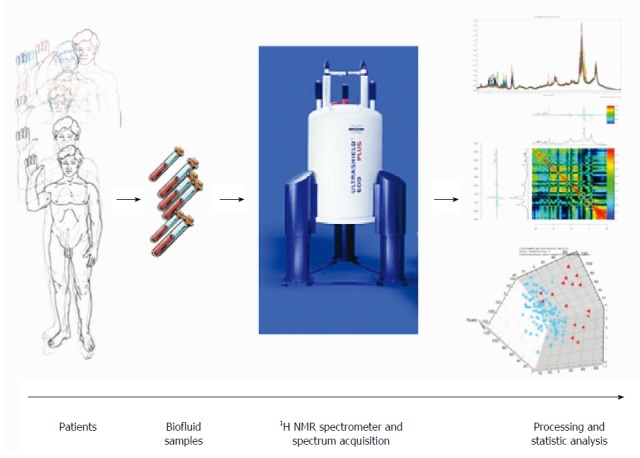
Metabolomics is defined as the quantitative measurement of the dynamic multiparametric metabolic response of living systems to pathophysiological stimuli or genetic modification. It is an "omics" technique that is situated downstream of genomics, transcriptomics and proteomics. Metabolomics is recognized as a promising technique in the field of systems biology for the evaluation of global metabolic changes. During the last decade, metabolomics approaches have become widely used in the study of liver diseases for the detection of early biomarkers and altered metabolic pathways. It is a powerful technique to improve our pathophysiological knowledge of various liver diseases. It can be a useful tool to help clinicians in the diagnostic process especially to distinguish malignant and non-malignant liver disease as well as to determine the etiology or severity of the liver disease. It can also assess therapeutic response or predict drug induced liver injury. Nevertheless, the usefulness of metabolomics is often not understood by clinicians, especially the concept of metabolomics profiling or fingerprinting. In the present work, after a concise description of the different techniques and processes used in metabolomics, we will review the main research on this subject by focusing specifically on in vitro proton nuclear magnetic resonance spectroscopy based metabolomics approaches in human studies. We will first consider the clinical point of view enlighten physicians on this new approach and emphasis its future use in clinical "routine".
Keywords: Cirrhosis; In vitro nuclear magnetic resonance spectroscopy; Liver diseases; Metabolomics.
Figures
Similar articles
-
Serum metabolomics reveals γ-glutamyl dipeptides as biomarkers for discrimination among different forms of liver disease.J Hepatol. 2011 Oct;55(4):896-905. doi: 10.1016/j.jhep.2011.01.031. Epub 2011 Feb 18. J Hepatol. 2011. PMID: 21334394 Clinical Trial.
-
The metabolomic window into hepatobiliary disease.J Hepatol. 2013 Oct;59(4):842-58. doi: 10.1016/j.jhep.2013.05.030. Epub 2013 May 25. J Hepatol. 2013. PMID: 23714158 Free PMC article. Review.
-
Dynamic metabolic change is indicative of inflammation-induced transformation of hepatic cells.Int J Biochem Cell Biol. 2015 Sep;66:45-58. doi: 10.1016/j.biocel.2015.07.007. Epub 2015 Jul 20. Int J Biochem Cell Biol. 2015. PMID: 26205150
-
NMR and LC/MS-based global metabolomics to identify serum biomarkers differentiating hepatocellular carcinoma from liver cirrhosis.Int J Cancer. 2014 Aug 1;135(3):658-68. doi: 10.1002/ijc.28706. Epub 2014 Jan 17. Int J Cancer. 2014. PMID: 24382646
-
Recent Advances of Microbiome-Associated Metabolomics Profiling in Liver Disease: Principles, Mechanisms, and Applications.Int J Mol Sci. 2021 Jan 25;22(3):1160. doi: 10.3390/ijms22031160. Int J Mol Sci. 2021. PMID: 33503844 Free PMC article. Review.
Cited by
-
Cutaneous Thermal Injury Modulates Blood and Skin Metabolomes Differently in a Murine Model.J Burn Care Res. 2021 Aug 4;42(4):727-742. doi: 10.1093/jbcr/iraa209. J Burn Care Res. 2021. PMID: 33301570 Free PMC article.
-
Metabolic Characterization of Advanced Liver Fibrosis in HCV Patients as Studied by Serum 1H-NMR Spectroscopy.PLoS One. 2016 May 9;11(5):e0155094. doi: 10.1371/journal.pone.0155094. eCollection 2016. PLoS One. 2016. PMID: 27158896 Free PMC article.
-
Clinical significance of small molecule metabolites in the blood of patients with different types of liver injury.Sci Rep. 2021 Jun 2;11(1):11642. doi: 10.1038/s41598-021-91164-9. Sci Rep. 2021. PMID: 34079030 Free PMC article.
-
Short-chain fatty acid and fecal microbiota profiles are linked to fibrosis in primary biliary cholangitis.FEMS Microbiol Lett. 2021 Apr 22;368(6):fnab038. doi: 10.1093/femsle/fnab038. FEMS Microbiol Lett. 2021. PMID: 33836051 Free PMC article.
-
Spatial metabolomics and its application in the liver.Hepatology. 2024 May 1;79(5):1158-1179. doi: 10.1097/HEP.0000000000000341. Epub 2023 Feb 23. Hepatology. 2024. PMID: 36811413 Free PMC article. Review.
References
-
- Lindon JC, Nicholson JK. Spectroscopic and statistical techniques for information recovery in metabonomics and metabolomics. Annu Rev Anal Chem (Palo Alto Calif) 2008;1:45–69. - PubMed
-
- Fernie AR, Trethewey RN, Krotzky AJ, Willmitzer L. Metabolite profiling: from diagnostics to systems biology. Nat Rev Mol Cell Biol. 2004;5:763–769. - PubMed
-
- Dunn WB, Broadhurst DI, Atherton HJ, Goodacre R, Griffin JL. Systems level studies of mammalian metabolomes: the roles of mass spectrometry and nuclear magnetic resonance spectroscopy. Chem Soc Rev. 2011;40:387–426. - PubMed
-
- Goodacre R, Broadhurst D, Smilde AK, Kristal BS, Baker D, Beger RD, Bessant C, Connor S, Capuani G, Craig A, et al. Proposed minimum reporting standards for data analysis in metabolomics. Metabolomics. 2007:231–241.
Publication types
MeSH terms
LinkOut - more resources
Full Text Sources
Other Literature Sources
Medical
